

The Nuclear Receptor Rev-erbα Regulates Adipose Tissue-specific FGF21 Signaling
- PMID: 27002153
- PMCID: PMC4865931
- DOI: 10.1074/jbc.M116.719120
The Nuclear Receptor Rev-erbα Regulates Adipose Tissue-specific FGF21 Signaling
Abstract
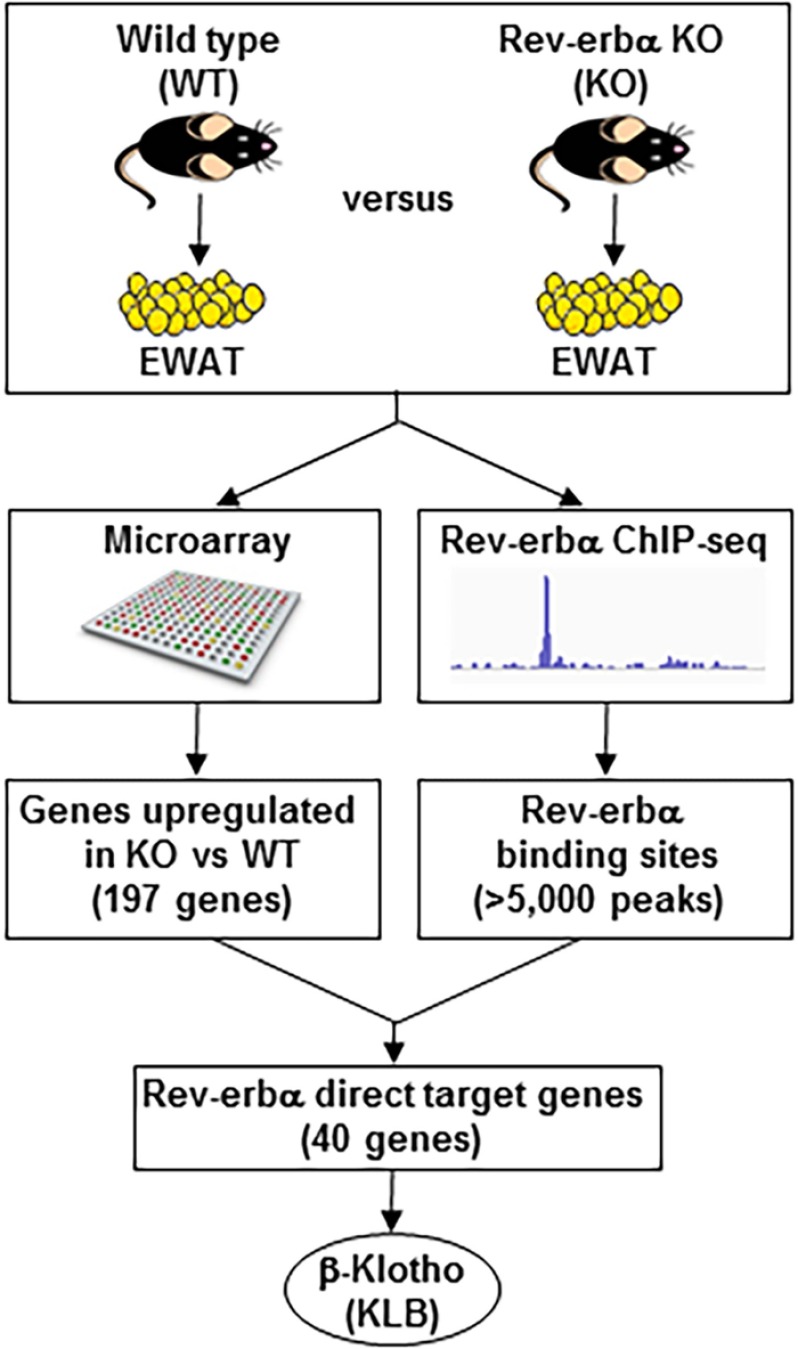
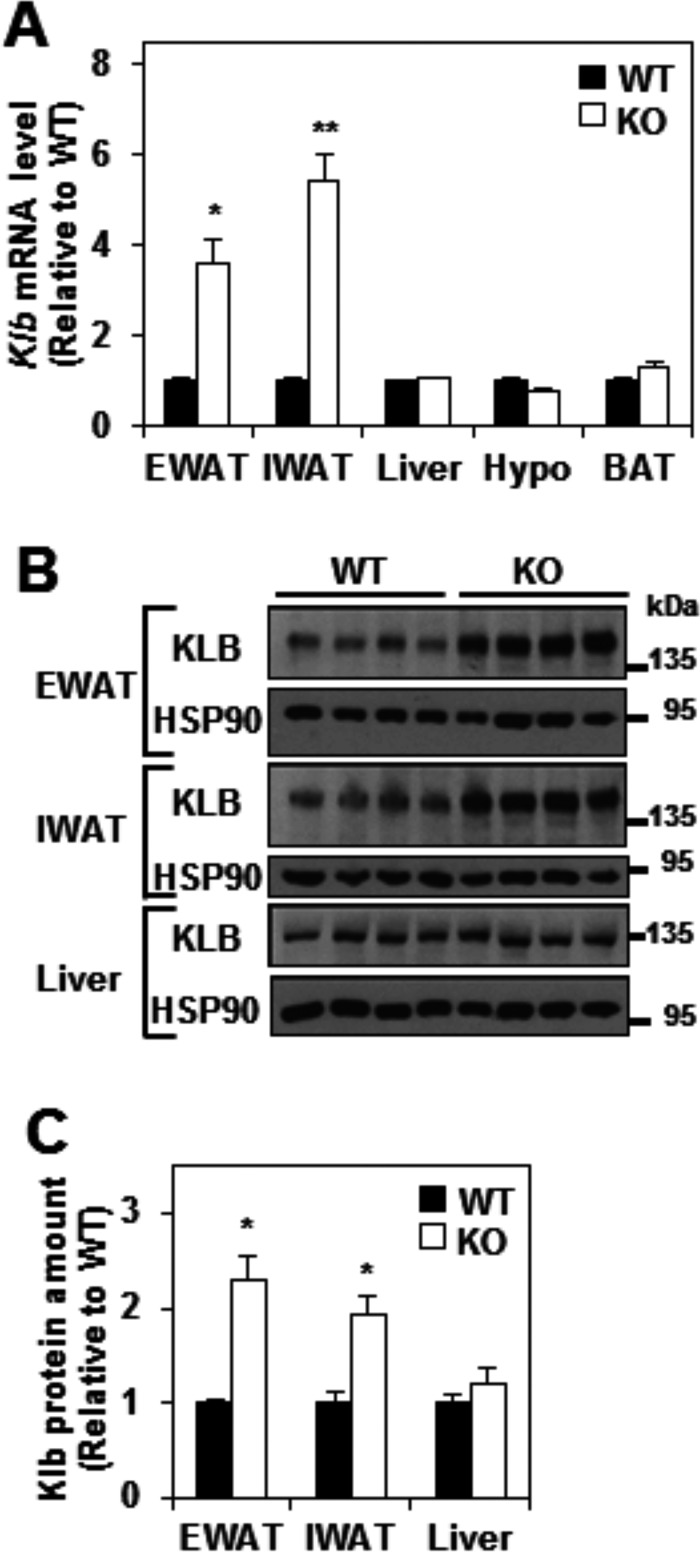
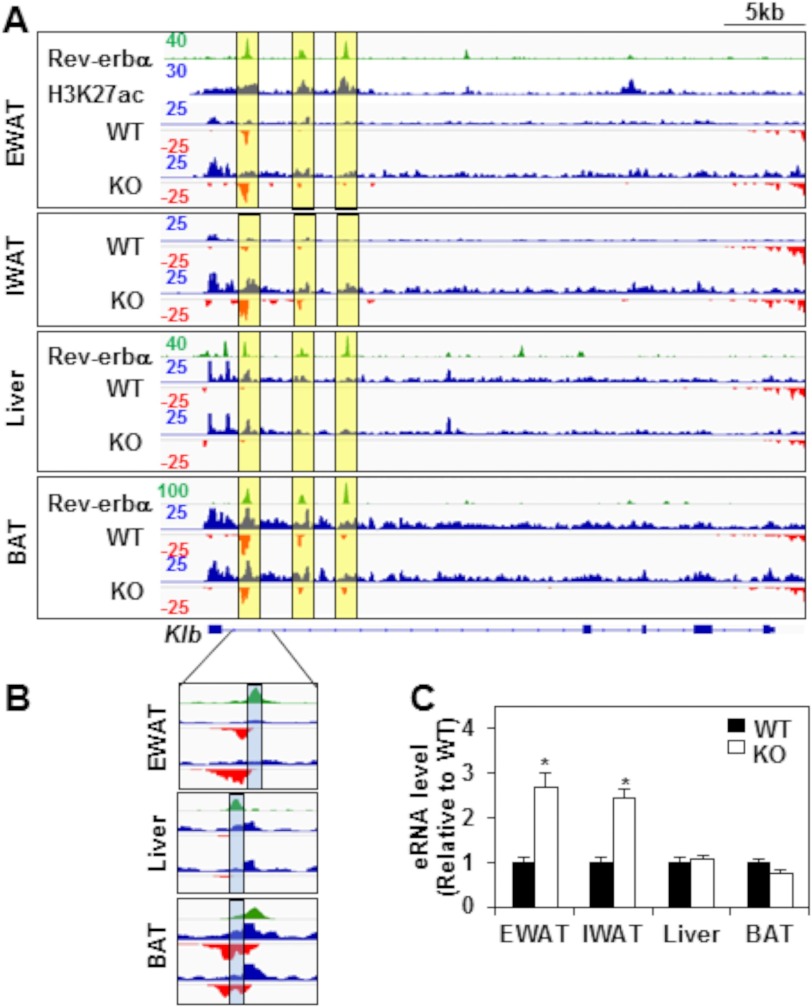
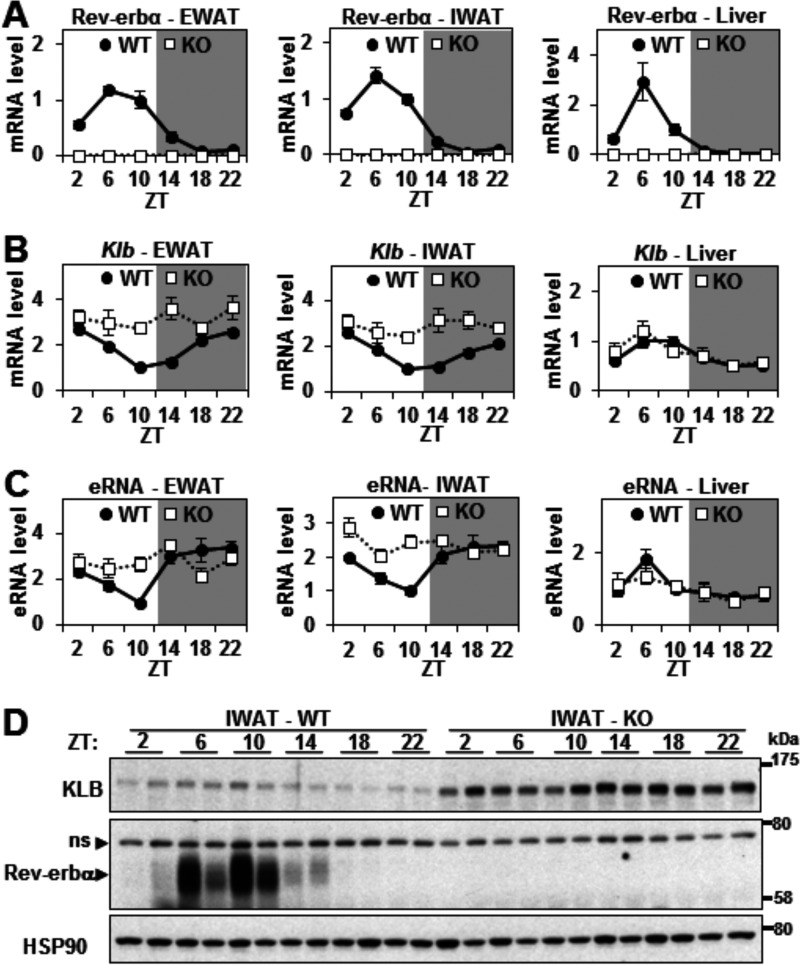
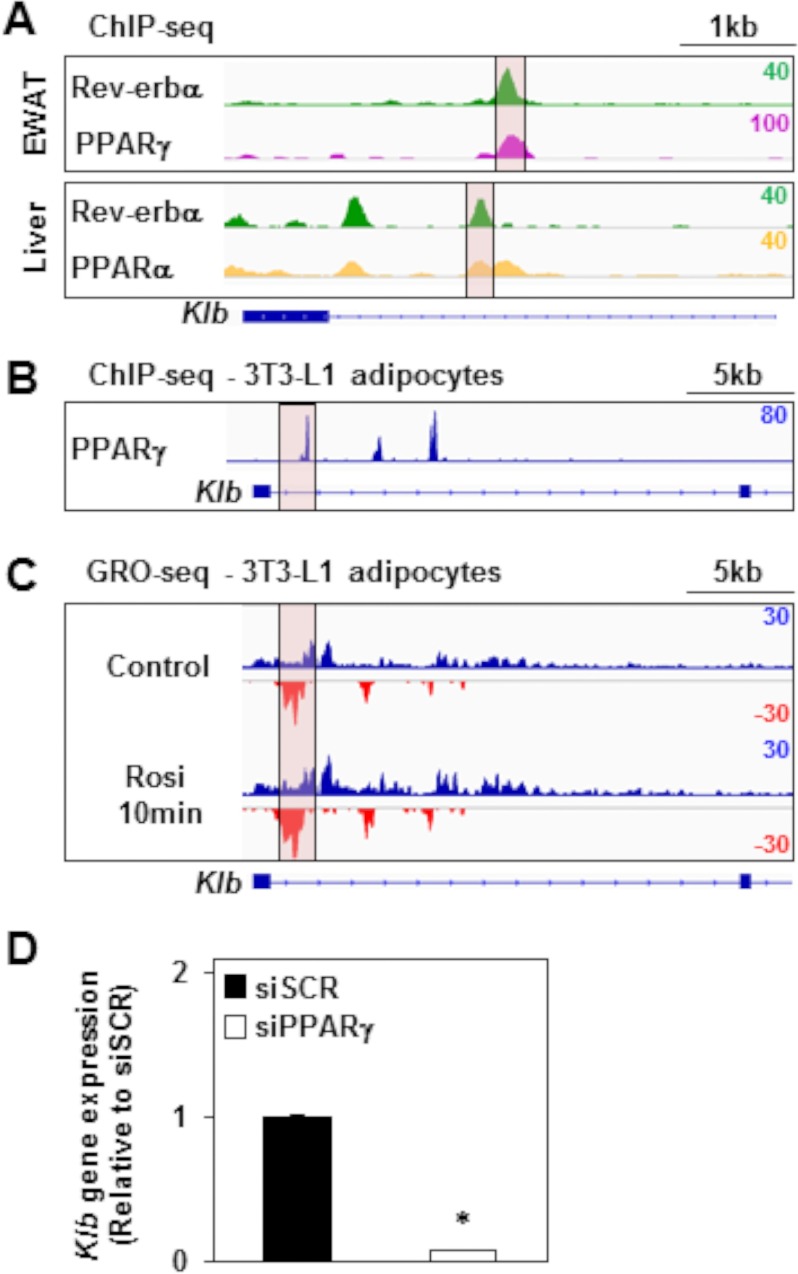
FGF21 is an atypical member of the FGF family that functions as a hormone to regulate carbohydrate and lipid metabolism. Here we demonstrate that the actions of FGF21 in mouse adipose tissue, but not in liver, are modulated by the nuclear receptor Rev-erbα, a potent transcriptional repressor. Interrogation of genes induced in the absence of Rev-erbα for Rev-erbα-binding sites identified βKlotho, an essential coreceptor for FGF21, as a direct target gene of Rev-erbα in white adipose tissue but not liver. Rev-erbα ablation led to the robust elevated expression of βKlotho. Consequently, the effects of FGF21 were markedly enhanced in the white adipose tissue of mice lacking Rev-erbα. A major Rev-erbα-controlled enhancer at the Klb locus was also bound by the adipocytic transcription factor peroxisome proliferator-activated receptor (PPAR) γ, which regulates its activity in the opposite direction. These findings establish Rev-erbα as a specific modulator of FGF21 signaling in adipose tissue.
Keywords: DNA binding protein; Rev-ErbAα (NR1D1); adipose tissue metabolism; clock gene; metabolic regulation; microarray; mouse; nuclear receptor; transcription enhancer.
© 2016 by The American Society for Biochemistry and Molecular Biology, Inc.
Figures
Similar articles
-
The orphan nuclear receptor Rev-Erbalpha is a peroxisome proliferator-activated receptor (PPAR) gamma target gene and promotes PPARgamma-induced adipocyte differentiation.J Biol Chem. 2003 Sep 26;278(39):37672-80. doi: 10.1074/jbc.M304664200. Epub 2003 Jun 23. J Biol Chem. 2003. PMID: 12821652
-
GENE REGULATION. Discrete functions of nuclear receptor Rev-erbα couple metabolism to the clock.Science. 2015 Jun 26;348(6242):1488-92. doi: 10.1126/science.aab3021. Epub 2015 Jun 4. Science. 2015. PMID: 26044300 Free PMC article.
-
REV-ERBalpha participates in circadian SREBP signaling and bile acid homeostasis.PLoS Biol. 2009 Sep;7(9):e1000181. doi: 10.1371/journal.pbio.1000181. Epub 2009 Sep 1. PLoS Biol. 2009. PMID: 19721697 Free PMC article.
-
Dissecting the Rev-erbα Cistrome and the Mechanisms Controlling Circadian Transcription in Liver.Cold Spring Harb Symp Quant Biol. 2015;80:233-8. doi: 10.1101/sqb.2015.80.027508. Epub 2015 Sep 14. Cold Spring Harb Symp Quant Biol. 2015. PMID: 26370410 Review.
-
Nuclear receptor Rev-erbalpha: a heme receptor that coordinates circadian rhythm and metabolism.Nucl Recept Signal. 2010 Apr 16;8:e001. doi: 10.1621/nrs.08001. Nucl Recept Signal. 2010. PMID: 20414452 Free PMC article. Review.
Cited by
-
Recent Advances in Hepatic Metabolic Regulation by the Nuclear Factor Rev-erbɑ.Curr Drug Metab. 2024;25(1):2-12. doi: 10.2174/0113892002290055240212074758. Curr Drug Metab. 2024. PMID: 38409696 Review.
-
Melatonin inhibits osteoclastogenesis via RANKL/OPG suppression mediated by Rev-Erbα in osteoblasts.J Cell Mol Med. 2022 Jul;26(14):4032-4047. doi: 10.1111/jcmm.17440. Epub 2022 Jun 21. J Cell Mol Med. 2022. PMID: 35726597 Free PMC article.
-
The central fibroblast growth factor receptor/beta klotho system: Comprehensive mapping in Mus musculus and comparisons to nonhuman primate and human samples using an automated in situ hybridization platform.J Comp Neurol. 2019 Aug 15;527(12):2069-2085. doi: 10.1002/cne.24668. Epub 2019 Mar 9. J Comp Neurol. 2019. PMID: 30809795 Free PMC article.
-
Targeting REV-ERBα for therapeutic purposes: promises and challenges.Theranostics. 2020 Mar 4;10(9):4168-4182. doi: 10.7150/thno.43834. eCollection 2020. Theranostics. 2020. PMID: 32226546 Free PMC article. Review.
-
Role of Circadian Transcription Factor Rev-Erb in Metabolism and Tissue Fibrosis.Int J Mol Sci. 2022 Oct 26;23(21):12954. doi: 10.3390/ijms232112954. Int J Mol Sci. 2022. PMID: 36361737 Free PMC article. Review.
References
-
- Qatanani M., and Lazar M. A. (2007) Mechanisms of obesity-associated insulin resistance: many choices on the menu. Genes Dev. 21, 1443–1455 - PubMed
-
- Anghel S. I., and Wahli W. (2007) Fat poetry: a kingdom for PPAR γ. Cell Res. 17, 486–511 - PubMed
-
- Mathieu P., Lemieux I., and Després J. P. (2010) Obesity, inflammation, and cardiovascular risk. Clin. Pharmacol. Ther. 87, 407–416 - PubMed
Publication types
MeSH terms
Substances
Grants and funding
LinkOut - more resources
Full Text Sources
Other Literature Sources
Molecular Biology Databases
