Uncovering Aberrant Mutant PKA Function with Flow Cytometric FRET
- PMID: 26997269
- PMCID: PMC4814300
- DOI: 10.1016/j.celrep.2016.02.077
Uncovering Aberrant Mutant PKA Function with Flow Cytometric FRET
Abstract
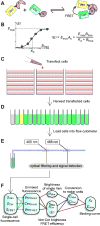
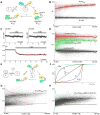
Biology has been revolutionized by tools that allow the detection and characterization of protein-protein interactions (PPIs). Förster resonance energy transfer (FRET)-based methods have become particularly attractive as they allow quantitative studies of PPIs within the convenient and relevant context of living cells. We describe here an approach that allows the rapid construction of live-cell FRET-based binding curves using a commercially available flow cytometer. We illustrate a simple method for absolutely calibrating the cytometer, validating our binding assay against the gold standard isothermal calorimetry (ITC), and using flow cytometric FRET to uncover the structural and functional effects of the Cushing-syndrome-causing mutation (L206R) on PKA's catalytic subunit. We discover that this mutation not only differentially affects PKAcat's binding to its multiple partners but also impacts its rate of catalysis. These findings improve our mechanistic understanding of this disease-causing mutation, while illustrating the simplicity, general applicability, and power of flow cytometric FRET.
Copyright © 2016 The Authors. Published by Elsevier Inc. All rights reserved.
Conflict of interest statement
We have no conflicts of interests to report.
Figures


Similar articles
-
Detecting Förster resonance energy transfer in living cells by conventional and spectral flow cytometry.Cytometry A. 2022 Oct;101(10):818-834. doi: 10.1002/cyto.a.24472. Epub 2021 Jun 24. Cytometry A. 2022. PMID: 34128311
-
Flow cytometric measurement of fluorescence (Förster) resonance energy transfer from cyan fluorescent protein to yellow fluorescent protein using single-laser excitation at 458 nm.Cytometry A. 2003 May;53(1):39-54. doi: 10.1002/cyto.a.10037. Cytometry A. 2003. PMID: 12701131
-
A flow cytometric method to detect protein-protein interaction in living cells by directly visualizing donor fluorophore quenching during CFP-->YFP fluorescence resonance energy transfer (FRET).Cytometry A. 2003 Oct;55(2):71-85. doi: 10.1002/cyto.a.10073. Cytometry A. 2003. PMID: 14505312
-
Analyzing protein kinase dynamics in living cells with FRET reporters.Methods. 2006 Nov;40(3):279-86. doi: 10.1016/j.ymeth.2006.06.013. Methods. 2006. PMID: 16908183 Review.
-
PKA: a portrait of protein kinase dynamics.Biochim Biophys Acta. 2004 Mar 11;1697(1-2):259-69. doi: 10.1016/j.bbapap.2003.11.029. Biochim Biophys Acta. 2004. PMID: 15023366 Review.
Cited by
-
Rad regulation of CaV1.2 channels controls cardiac fight-or-flight response.Nat Cardiovasc Res. 2022 Nov;1(11):1022-1038. doi: 10.1038/s44161-022-00157-y. Epub 2022 Nov 14. Nat Cardiovasc Res. 2022. PMID: 36424916 Free PMC article.
-
Targeted deubiquitination rescues distinct trafficking-deficient ion channelopathies.Nat Methods. 2020 Dec;17(12):1245-1253. doi: 10.1038/s41592-020-00992-6. Epub 2020 Nov 9. Nat Methods. 2020. PMID: 33169015 Free PMC article.
-
Protein kinase A inhibitor proteins (PKIs) divert GPCR-Gαs-cAMP signaling toward EPAC and ERK activation and are involved in tumor growth.FASEB J. 2020 Oct;34(10):13900-13917. doi: 10.1096/fj.202001515R. Epub 2020 Aug 24. FASEB J. 2020. PMID: 32830375 Free PMC article.
-
Kinetics and inhibition studies of the L205R mutant of cAMP-dependent protein kinase involved in Cushing's syndrome.FEBS Open Bio. 2018 Mar 11;8(4):606-613. doi: 10.1002/2211-5463.12396. eCollection 2018 Apr. FEBS Open Bio. 2018. PMID: 29632813 Free PMC article.
-
Chemical and Biological Strategies for Profiling Protein-Protein Interactions in Living Cells.Chem Asian J. 2023 Jul 17;18(14):e202300226. doi: 10.1002/asia.202300226. Epub 2023 May 5. Chem Asian J. 2023. PMID: 37089007 Free PMC article. Review.
References
-
- Calebiro D, Hannawacker A, Lyga S, Bathon K, Zabel U, Ronchi C, Beuschlein F, Reincke M, Lorenz K, Allolio B, et al. PKA catalytic subunit mutations in adrenocortical Cushing’s adenoma impair association with the regulatory subunit. Nature communications. 2014;5:5680. - PubMed
Publication types
MeSH terms
Substances
Grants and funding
LinkOut - more resources
Full Text Sources
Other Literature Sources

