Drug Repositioning for Cancer Therapy Based on Large-Scale Drug-Induced Transcriptional Signatures
- PMID: 26954019
- PMCID: PMC4783079
- DOI: 10.1371/journal.pone.0150460
Drug Repositioning for Cancer Therapy Based on Large-Scale Drug-Induced Transcriptional Signatures
Abstract
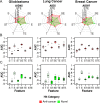
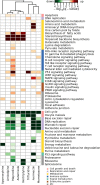
An in silico chemical genomics approach is developed to predict drug repositioning (DR) candidates for three types of cancer: glioblastoma, lung cancer, and breast cancer. It is based on a recent large-scale dataset of ~20,000 drug-induced expression profiles in multiple cancer cell lines, which provides i) a global impact of transcriptional perturbation of both known targets and unknown off-targets, and ii) rich information on drug's mode-of-action. First, the drug-induced expression profile is shown more effective than other information, such as the drug structure or known target, using multiple HTS datasets as unbiased benchmarks. Particularly, the utility of our method was robustly demonstrated in identifying novel DR candidates. Second, we predicted 14 high-scoring DR candidates solely based on expression signatures. Eight of the fourteen drugs showed significant anti-proliferative activity against glioblastoma; i.e., ivermectin, trifluridine, astemizole, amlodipine, maprotiline, apomorphine, mometasone, and nortriptyline. Our DR score strongly correlated with that of cell-based experimental results; the top seven DR candidates were positive, corresponding to an approximately 20-fold enrichment compared with conventional HTS. Despite diverse original indications and known targets, the perturbed pathways of active DR candidates show five distinct patterns that form tight clusters together with one or more known cancer drugs, suggesting common transcriptome-level mechanisms of anti-proliferative activity.
Conflict of interest statement
Figures


Similar articles
-
Accurate Drug Repositioning through Non-tissue-Specific Core Signatures from Cancer Transcriptomes.Cell Rep. 2018 Oct 9;25(2):523-535.e5. doi: 10.1016/j.celrep.2018.09.031. Cell Rep. 2018. PMID: 30304690
-
Integrating LINCS Data to Evaluate Cancer Transcriptome Modifying Potential of Small-molecule Compounds for Drug Repositioning.Comb Chem High Throughput Screen. 2021;24(9):1340-1350. doi: 10.2174/1386207323666201027120149. Comb Chem High Throughput Screen. 2021. PMID: 33109034
-
Repositioning FDA-Approved Drugs in Combination with Epigenetic Drugs to Reprogram Colon Cancer Epigenome.Mol Cancer Ther. 2017 Feb;16(2):397-407. doi: 10.1158/1535-7163.MCT-16-0588. Epub 2016 Dec 15. Mol Cancer Ther. 2017. PMID: 27980103 Free PMC article.
-
[Development of antituberculous drugs: current status and future prospects].Kekkaku. 2006 Dec;81(12):753-74. Kekkaku. 2006. PMID: 17240921 Review. Japanese.
-
A Review of Drug Repositioning Based Chemical-induced Cell Line Expression Data.Curr Med Chem. 2020;27(32):5340-5350. doi: 10.2174/0929867325666181101115801. Curr Med Chem. 2020. PMID: 30381060 Review.
Cited by
-
Aporphine and isoquinoline derivatives block glioblastoma cell stemness and enhance temozolomide cytotoxicity.Sci Rep. 2022 Dec 7;12(1):21113. doi: 10.1038/s41598-022-25534-2. Sci Rep. 2022. PMID: 36477472 Free PMC article.
-
Receptor tyrosine kinase targeting in glioblastoma: performance, limitations and future approaches.Contemp Oncol (Pozn). 2020;24(1):55-66. doi: 10.5114/wo.2020.94726. Epub 2020 Mar 30. Contemp Oncol (Pozn). 2020. PMID: 32514239 Free PMC article. Review.
-
Drug repositioning: computational approaches and research examples classified according to the evidence level.Discoveries (Craiova). 2017 Jun 30;5(2):e75. doi: 10.15190/d.2017.5. Discoveries (Craiova). 2017. PMID: 32309593 Free PMC article. Review.
-
KORE-Map 1.0: Korean medicine Omics Resource Extension Map on transcriptome data of tonifying herbal medicine.Sci Data. 2024 Sep 6;11(1):974. doi: 10.1038/s41597-024-03734-x. Sci Data. 2024. PMID: 39242618 Free PMC article.
-
Elucidating the Interaction of CF Airway Epithelial Cells and Rhinovirus: Using the Host-Pathogen Relationship to Identify Future Therapeutic Strategies.Front Pharmacol. 2018 Nov 7;9:1270. doi: 10.3389/fphar.2018.01270. eCollection 2018. Front Pharmacol. 2018. PMID: 30464745 Free PMC article. Review.
References
Publication types
MeSH terms
Substances
Grants and funding
LinkOut - more resources
Full Text Sources
Other Literature Sources

