

Applications of NMR spectroscopy to systems biochemistry
- PMID: 26952191
- PMCID: PMC4850081
- DOI: 10.1016/j.pnmrs.2016.01.005
Applications of NMR spectroscopy to systems biochemistry
Abstract
The past decades of advancements in NMR have made it a very powerful tool for metabolic research. Despite its limitations in sensitivity relative to mass spectrometric techniques, NMR has a number of unparalleled advantages for metabolic studies, most notably the rigor and versatility in structure elucidation, isotope-filtered selection of molecules, and analysis of positional isotopomer distributions in complex mixtures afforded by multinuclear and multidimensional experiments. In addition, NMR has the capacity for spatially selective in vivo imaging and dynamical analysis of metabolism in tissues of living organisms. In conjunction with the use of stable isotope tracers, NMR is a method of choice for exploring the dynamics and compartmentation of metabolic pathways and networks, for which our current understanding is grossly insufficient. In this review, we describe how various direct and isotope-edited 1D and 2D NMR methods can be employed to profile metabolites and their isotopomer distributions by stable isotope-resolved metabolomic (SIRM) analysis. We also highlight the importance of sample preparation methods including rapid cryoquenching, efficient extraction, and chemoselective derivatization to facilitate robust and reproducible NMR-based metabolomic analysis. We further illustrate how NMR has been applied in vitro, ex vivo, or in vivo in various stable isotope tracer-based metabolic studies, to gain systematic and novel metabolic insights in different biological systems, including human subjects. The pathway and network knowledge generated from NMR- and MS-based tracing of isotopically enriched substrates will be invaluable for directing functional analysis of other 'omics data to achieve understanding of regulation of biochemical systems, as demonstrated in a case study. Future developments in NMR technologies and reagents to enhance both detection sensitivity and resolution should further empower NMR in systems biochemical research.
Keywords: Hyperpolarization; In vivo NMR; Metabolic network and flux; Stable isotope resolved metabolomics; Stable isotope tracers.
Copyright © 2016 Elsevier B.V. All rights reserved.
Figures
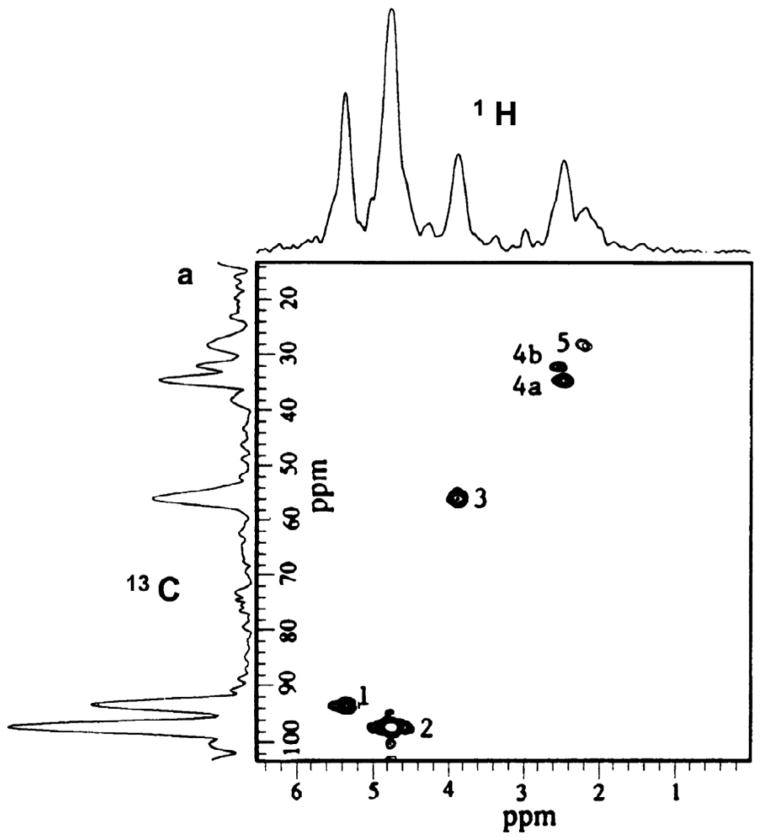
 ,
,
 ,
,
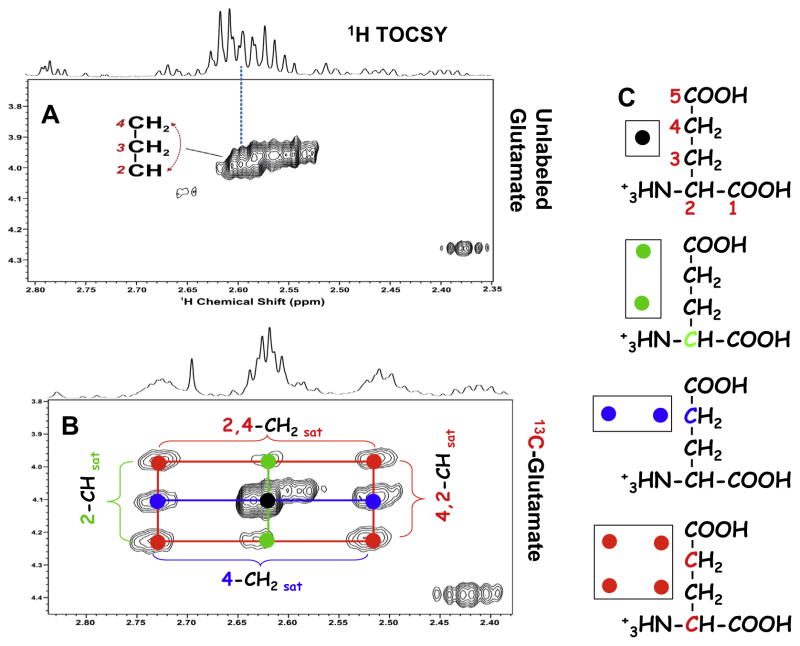
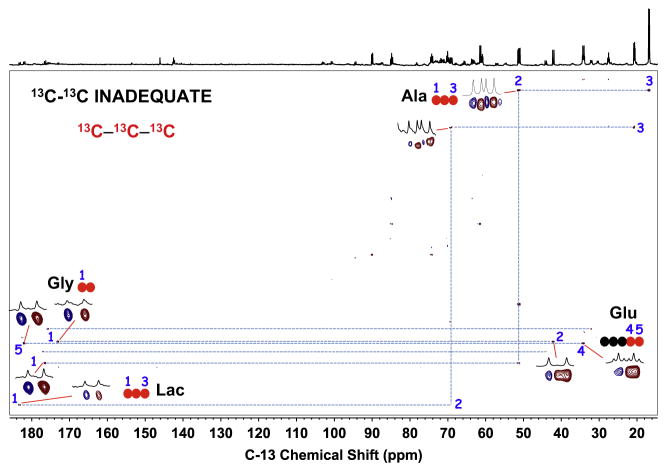
 : satellite cross-peaks of Glu-4H, Glu-2H, and Glu-2,4H, respectively. The four positional isotopomers of Glu that give rise to these cross-peak patterns are shown in (C).
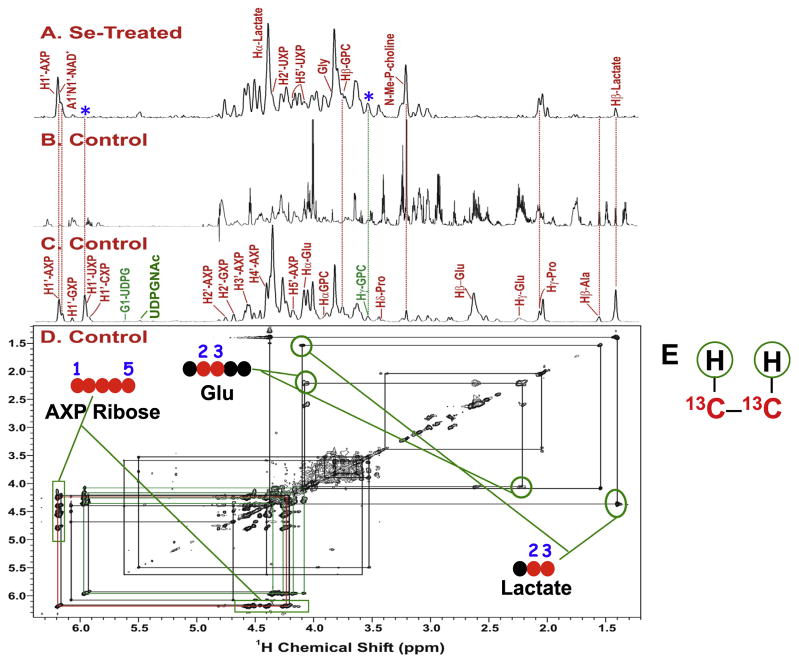
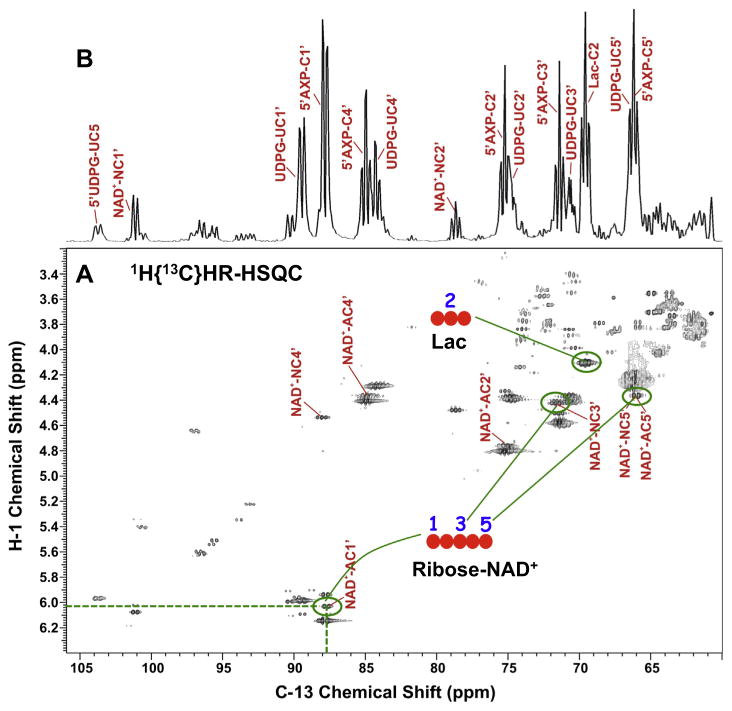
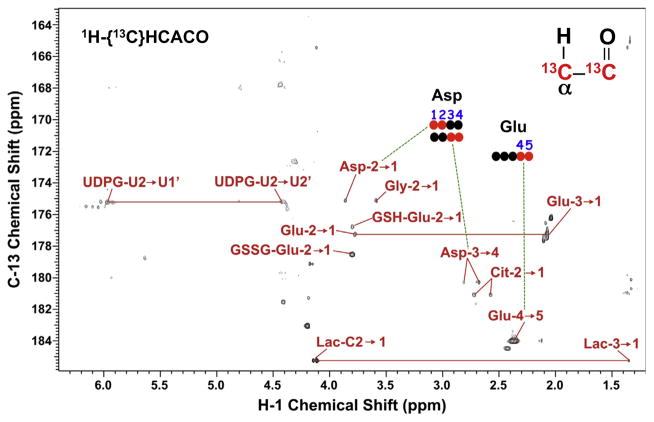
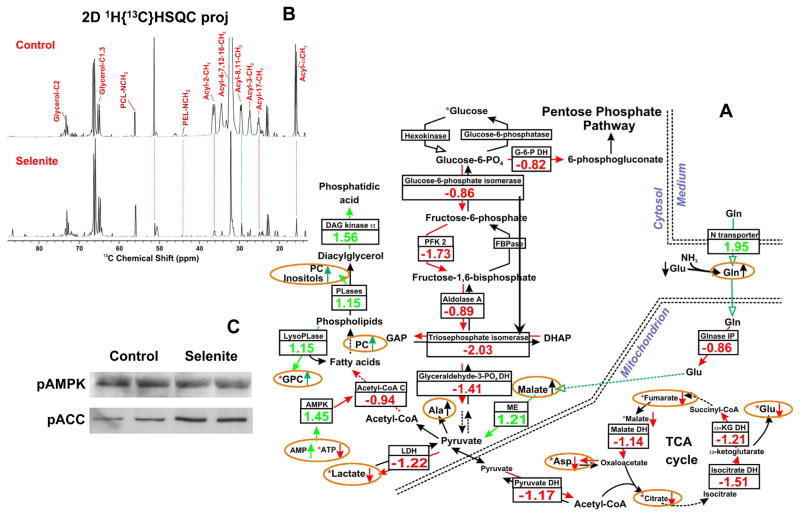
 ,
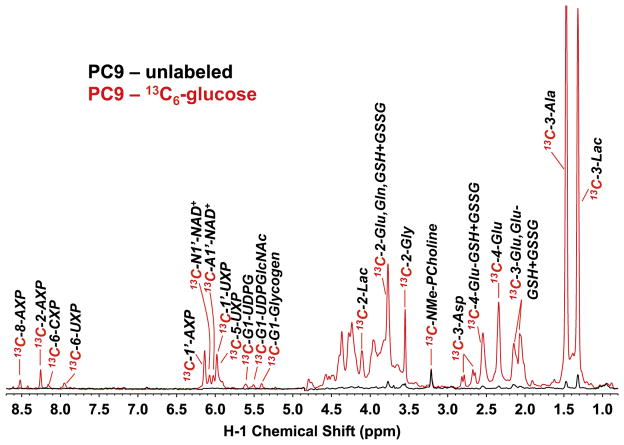
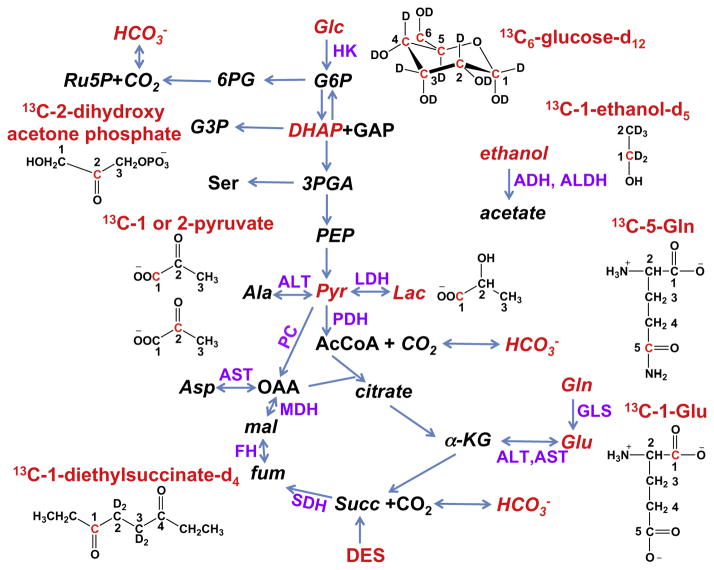
: respective 13C tracing of pyruvate dehydrogenase (PDH) or pyruvate carboxylase (PCB)-initiated Krebs cycle reactions; Lac: lactate; GSH/GSSG: reduced/oxidized glutathiones; Glc: glucose; G6P: glucose-6-phosphate; UDPGGlcNAc: UDP-N-acetylglucosamine; UDPG: UDP-glucose; UXP: uracil nucleotides; AXP: adenine nucleotides; SHMT: serine hydroxymethyl transferas.
,
: respective 13C tracing of pyruvate dehydrogenase (PDH) or pyruvate carboxylase (PCB)-initiated Krebs cycle reactions; Lac: lactate; GSH/GSSG: reduced/oxidized glutathiones; Glc: glucose; G6P: glucose-6-phosphate; UDPGGlcNAc: UDP-N-acetylglucosamine; UDPG: UDP-glucose; UXP: uracil nucleotides; AXP: adenine nucleotides; SHMT: serine hydroxymethyl transferas.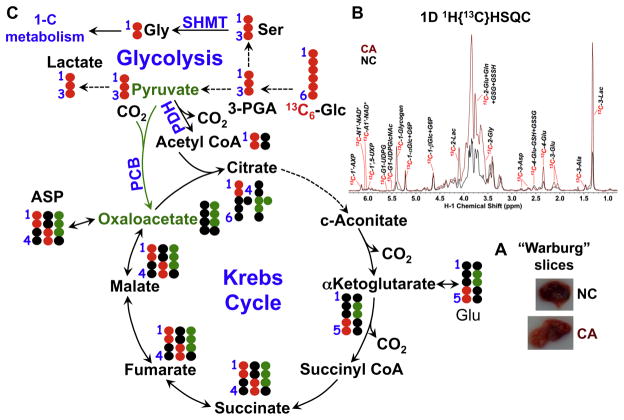

Similar articles
-
NMR-based Stable Isotope Resolved Metabolomics in systems biochemistry.Arch Biochem Biophys. 2017 Aug 15;628:123-131. doi: 10.1016/j.abb.2017.02.009. Epub 2017 Mar 2. Arch Biochem Biophys. 2017. PMID: 28263717 Free PMC article. Review.
-
NMR-based isotope editing, chemoselection and isotopomer distribution analysis in stable isotope resolved metabolomics.Methods. 2022 Oct;206:8-17. doi: 10.1016/j.ymeth.2022.07.014. Epub 2022 Jul 28. Methods. 2022. PMID: 35908585 Free PMC article. Review.
-
NMR-Based Stable Isotope Tracing of Cancer Metabolism.Methods Mol Biol. 2025;2855:457-504. doi: 10.1007/978-1-0716-4116-3_26. Methods Mol Biol. 2025. PMID: 39354323
-
Chloroformate derivatization for tracing the fate of Amino acids in cells and tissues by multiple stable isotope resolved metabolomics (mSIRM).Anal Chim Acta. 2017 Jul 11;976:63-73. doi: 10.1016/j.aca.2017.04.014. Epub 2017 Apr 10. Anal Chim Acta. 2017. PMID: 28576319 Free PMC article.
-
NMR-based stable isotope resolved metabolomics in systems biochemistry.J Biomol NMR. 2011 Apr;49(3-4):267-80. doi: 10.1007/s10858-011-9484-6. Epub 2011 Feb 26. J Biomol NMR. 2011. PMID: 21350847 Free PMC article.
Cited by
-
NMR Analysis of Carboxylate Isotopomers of 13C-Metabolites by Chemoselective Derivatization with 15N-Cholamine.Anal Chem. 2021 May 4;93(17):6629-6637. doi: 10.1021/acs.analchem.0c04220. Epub 2021 Apr 21. Anal Chem. 2021. PMID: 33880916 Free PMC article.
-
NMR spectroscopy for metabolomics in the living system: recent progress and future challenges.Anal Bioanal Chem. 2024 Apr;416(9):2319-2334. doi: 10.1007/s00216-024-05137-8. Epub 2024 Jan 19. Anal Bioanal Chem. 2024. PMID: 38240793 Free PMC article. Review.
-
Systems NMR: single-sample quantification of RNA, proteins and metabolites for biomolecular network analysis.Nat Methods. 2019 Aug;16(8):743-749. doi: 10.1038/s41592-019-0495-7. Epub 2019 Jul 29. Nat Methods. 2019. PMID: 31363225 Free PMC article.
-
tcaSIM: A Simulation Program for Optimal Design of 13C Tracer Experiments for Analysis of Metabolic Flux by NMR and Mass Spectroscopy.Curr Metabolomics. 2018;6(3):176-187. doi: 10.2174/2213235X07666181219115856. Curr Metabolomics. 2018. PMID: 31745452 Free PMC article.
-
Inhibition of Anaplerotic Glutaminolysis Underlies Selenite Toxicity in Human Lung Cancer.Proteomics. 2019 Nov;19(21-22):e1800486. doi: 10.1002/pmic.201800486. Epub 2019 Sep 12. Proteomics. 2019. PMID: 31298457 Free PMC article.
References
-
- Purcell E, Torrey H, Pound R. Resonance absorption by nuclear magnetic moments in a solid. Phys Rev. 1946;69:37–38.
-
- Bloch F. Nuclear induction. Phys Rev. 1946;70:460–474.
-
- Fan TWM, Higashi RM, Lane AN, Jardetzky O. Combined use of proton NMR and gas chromatography–mass spectra for metabolite monitoring and in vivo proton NMR assignments. Biochim Biophys Acta. 1986;882:154– 167. - PubMed
-
- Evanochko WT, Sakai TT, Ng TC, Krishna NR, Kim HD, Zeidler RB, Ghanta VK, Brockman RW, Schiffer LM, et al. NMR study of in-vivo Rif-1 tumors analysis of perchloric-acid extracts and identification of proton phosphorus-31 and carbon-13 resonances. Biochim Biophys Acta. 1984;805:104–116. - PubMed
-
- Bales JR, Higham DP, Howe I, Nicholson JK, Sadler PJ. Use of high-resolution proton nuclear magnetic resonance spectroscopy for rapid multi-component analysis of urine. Clin Chem. 1984;30:426–432. - PubMed
Publication types
MeSH terms
Substances
Grants and funding
LinkOut - more resources
Full Text Sources
Other Literature Sources
Medical
Miscellaneous
