

Human SR-BI and SR-BII Potentiate Lipopolysaccharide-Induced Inflammation and Acute Liver and Kidney Injury in Mice
- PMID: 26936883
- PMCID: PMC4856165
- DOI: 10.4049/jimmunol.1501709
Human SR-BI and SR-BII Potentiate Lipopolysaccharide-Induced Inflammation and Acute Liver and Kidney Injury in Mice
Abstract
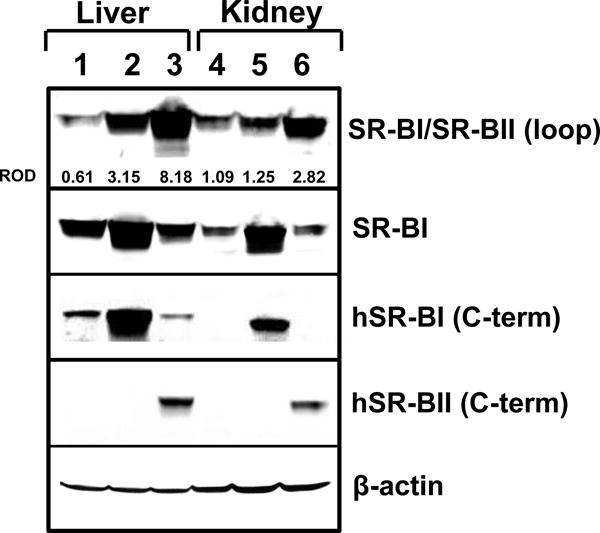
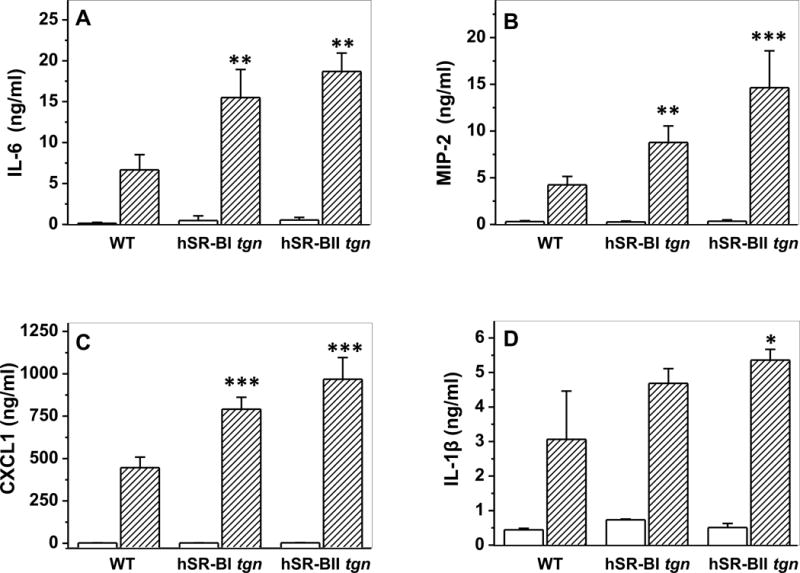
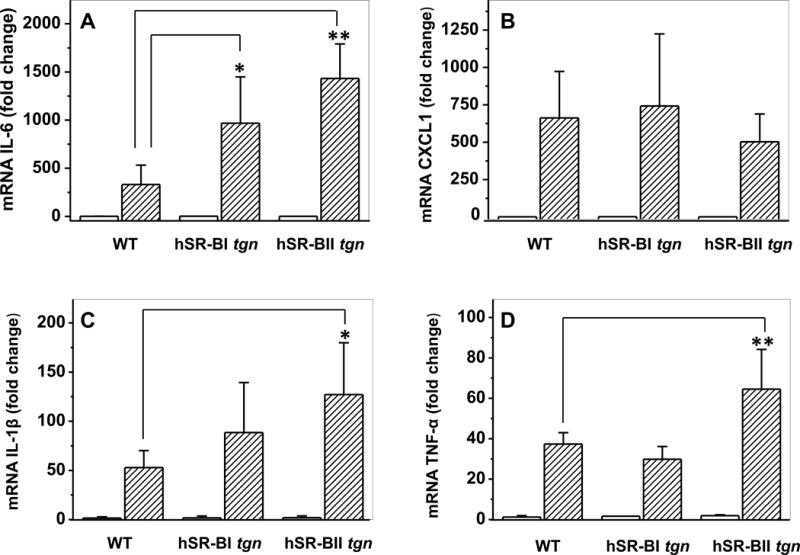
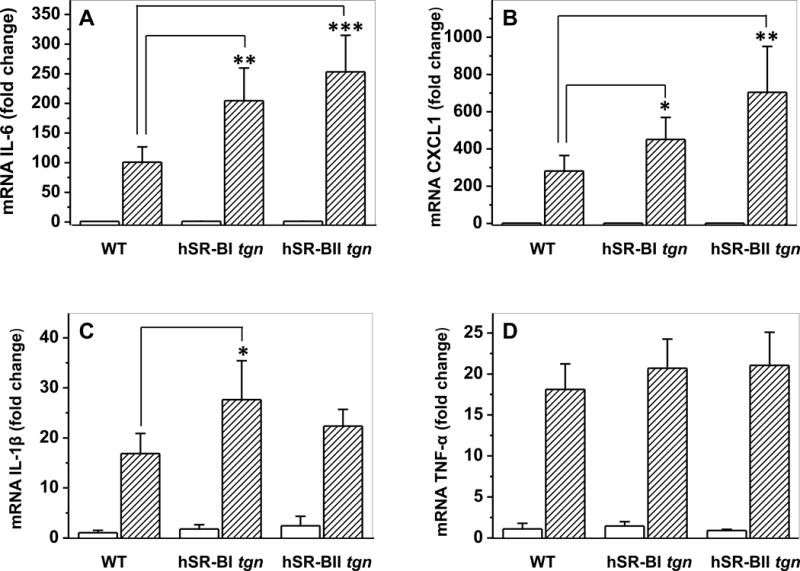
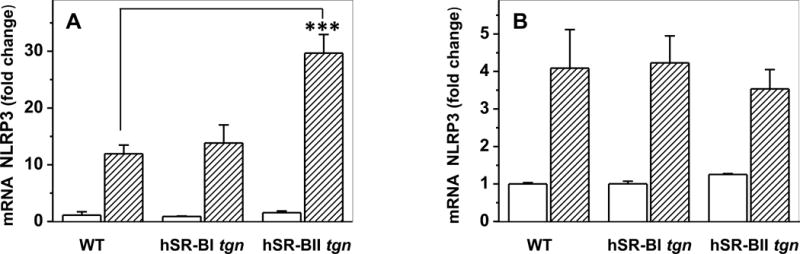
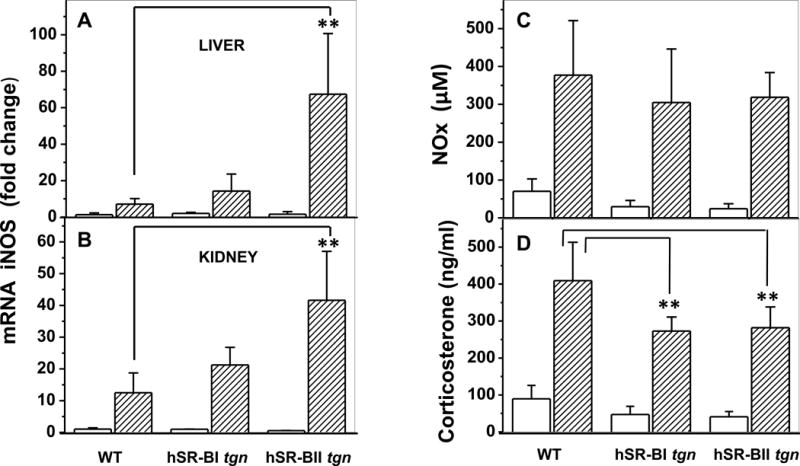
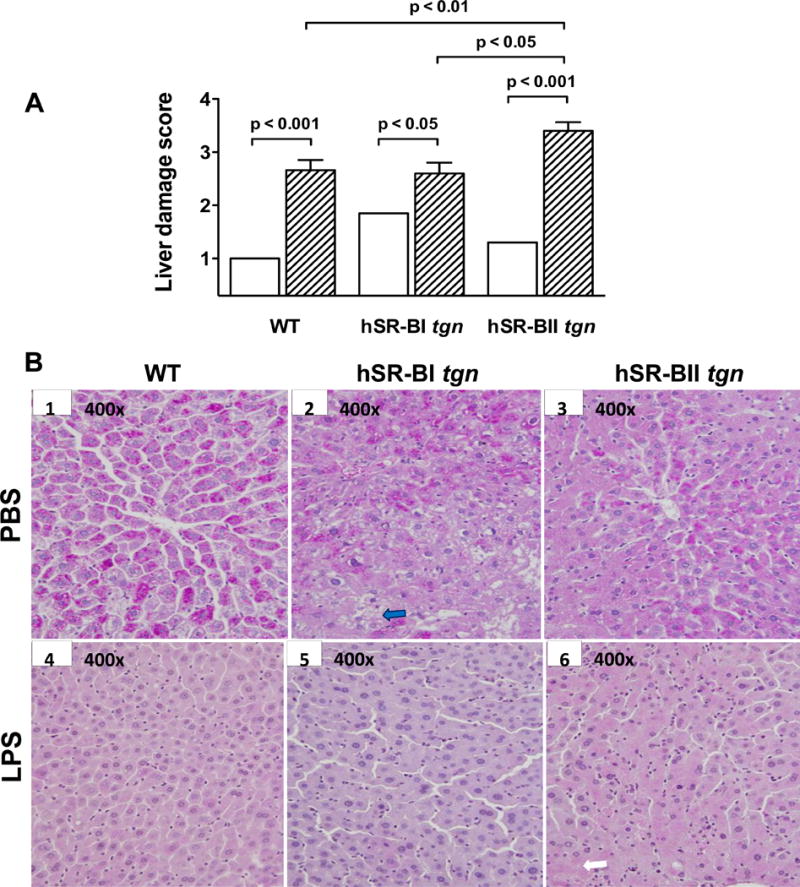
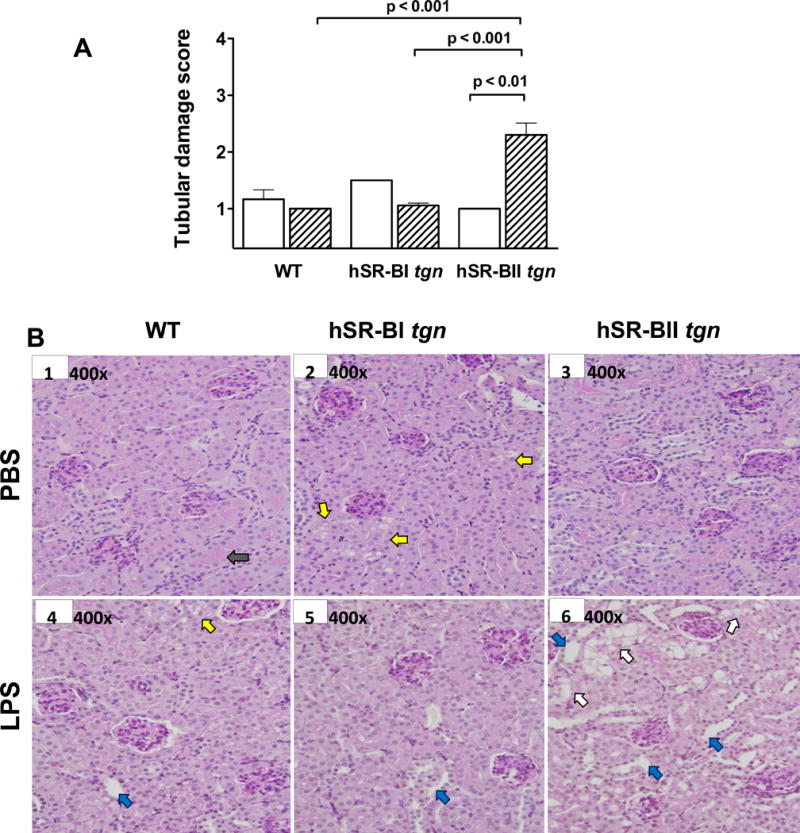
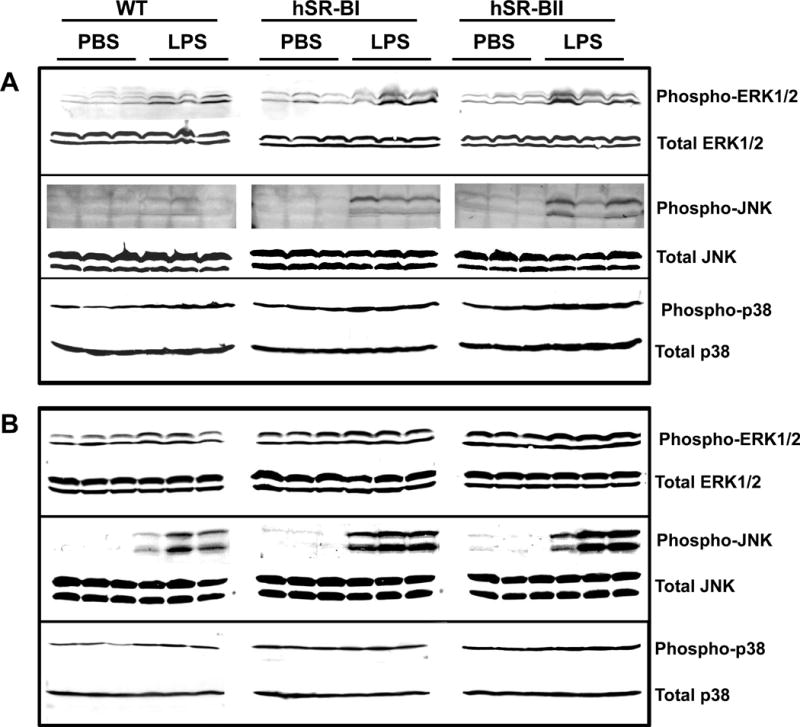
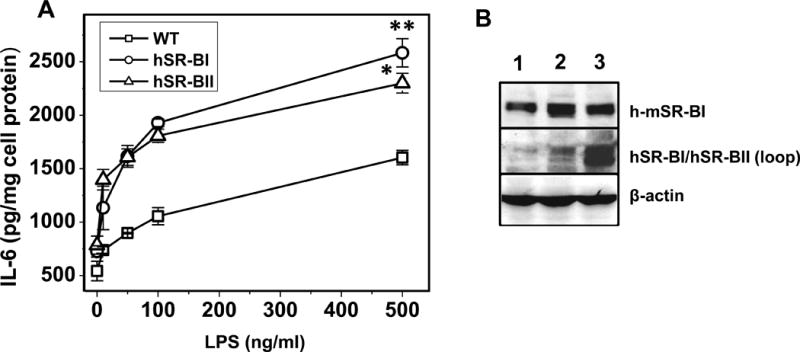
The class B scavenger receptors BI (SR-BI) and BII (SR-BII) are high-density lipoprotein receptors that recognize various pathogens, including bacteria and their products. It has been reported that SR-BI/II null mice are more sensitive than normal mice to endotoxin-induced inflammation and sepsis. Because the SR-BI/II knockout model demonstrates multiple immune and metabolic disorders, we investigated the role of each receptor in the LPS-induced inflammatory response and tissue damage using transgenic mice with pLiv-11-directed expression of human SR-BI (hSR-BI) or human SR-BII (hSR-BII). At 6 h after i.p. LPS injection, transgenic hSR-BI and hSR-BII mice demonstrated markedly higher serum levels of proinflammatory cytokines and 2- to 3-fold increased expression levels of inflammatory mediators in the liver and kidney, compared with wild-type (WT) mice. LPS-stimulated inducible NO synthase expression was 3- to 6-fold higher in the liver and kidney of both transgenic strains, although serum NO levels were similar in all mice. Despite the lower high-density lipoprotein plasma levels, both transgenic strains responded to LPS by a 5-fold increase of plasma corticosterone levels, which were only moderately lower than in WT animals. LPS treatment resulted in MAPK activation in tissues of all mice; however, the strongest response was detected for hepatic extracellular signal-regulated protein kinase 1 and 2 and kidney JNK of both transgenic mice. Histological examination of hepatic and renal tissue from LPS-challenged mice revealed more injury in hSR-BII, but not hSR-BI, transgenic mice versus WT controls. Our findings demonstrate that hSR-BII, and to a lesser extent hSR-BI, significantly increase LPS-induced inflammation and contribute to LPS-induced tissue injury in the liver and kidney, two major organs susceptible to LPS toxicity.
Figures
Similar articles
-
Human SR-BII mediates SAA uptake and contributes to SAA pro-inflammatory signaling in vitro and in vivo.PLoS One. 2017 Apr 19;12(4):e0175824. doi: 10.1371/journal.pone.0175824. eCollection 2017. PLoS One. 2017. PMID: 28423002 Free PMC article.
-
Class B Scavenger Receptors BI and BII Protect against LPS-Induced Acute Lung Injury in Mice by Mediating LPS.Infect Immun. 2021 Sep 16;89(10):e0030121. doi: 10.1128/IAI.00301-21. Epub 2021 Jun 7. Infect Immun. 2021. PMID: 34097506 Free PMC article.
-
Macrophage SR-BI regulates LPS-induced pro-inflammatory signaling in mice and isolated macrophages.J Lipid Res. 2012 Aug;53(8):1472-81. doi: 10.1194/jlr.M023234. Epub 2012 May 15. J Lipid Res. 2012. PMID: 22589557 Free PMC article.
-
Macrophage scavenger receptors and foam cell formation.J Leukoc Biol. 1999 Nov;66(5):740-6. doi: 10.1002/jlb.66.5.740. J Leukoc Biol. 1999. PMID: 10577503 Review.
-
SR-BI as target in atherosclerosis and cardiovascular disease - A comprehensive appraisal of the cellular functions of SR-BI in physiology and disease.Atherosclerosis. 2017 Mar;258:153-161. doi: 10.1016/j.atherosclerosis.2017.01.034. Epub 2017 Jan 31. Atherosclerosis. 2017. PMID: 28162236 Review.
Cited by
-
Comprehensive Evaluation of Lipopolysaccharide-Induced Changes in Rats Based on Metabolomics.J Inflamm Res. 2020 Aug 24;13:477-486. doi: 10.2147/JIR.S266012. eCollection 2020. J Inflamm Res. 2020. PMID: 32904659 Free PMC article.
-
Protective role of puerarin on LPS/D-Gal induced acute liver injury via restoring autophagy.Am J Transl Res. 2018 Mar 15;10(3):957-965. eCollection 2018. Am J Transl Res. 2018. PMID: 29636885 Free PMC article.
-
Fraxin in Combination with Dexamethasone Attenuates LPS-Induced Liver and Heart Injury and Their Anticytokine Activity in Mice.Adv Virol. 2023 Sep 11;2023:5536933. doi: 10.1155/2023/5536933. eCollection 2023. Adv Virol. 2023. PMID: 37727368 Free PMC article.
-
Orphan nuclear receptor Nur77 inhibits poly (I:C)-triggered acute liver inflammation by inducing the ubiquitin-editing enzyme A20.Oncotarget. 2017 May 9;8(37):61025-61035. doi: 10.18632/oncotarget.17731. eCollection 2017 Sep 22. Oncotarget. 2017. PMID: 28977843 Free PMC article.
-
Scavenger receptor B type 1: expression, molecular regulation, and cholesterol transport function.J Lipid Res. 2018 Jul;59(7):1114-1131. doi: 10.1194/jlr.R083121. Epub 2018 May 2. J Lipid Res. 2018. PMID: 29720388 Free PMC article. Review.
References
-
- Webb NR, Connell PM, Graf GA, Smart EJ, de Villiers WJ, de Beer FC, van der Westhuyzen DR. SR-BII, an isoform of the scavenger receptor BI containing an alternate cytoplasmic tail, mediates lipid transfer between high density lipoprotein and cells. J Biol Chem. 1998;273:15241–15248. - PubMed
-
- Murao K, Terpstra V, Green SR, Kondratenko N, Steinberg D, Quehenberger O. Characterization of CLA-1, a human homologue of rodent scavenger receptor BI, as a receptor for high density lipoprotein and apoptotic thymocytes. J Biol Chem. 1997;272:17551–17557. - PubMed
-
- Baranova IN, Vishnyakova TG, Bocharov AV, Kurlander R, Chen Z, Kimelman ML, Remaley AT, Csako G, Thomas F, Eggerman TL, Patterson AP. Serum amyloid A binding to CLA-1 (CD36 and LIMPII analogous-1) mediates serum amyloid A protein-induced activation of ERK1/2 and p38 mitogen-activated protein kinases. J Biol Chem. 2005;280:8031–8040. - PubMed
-
- Cai L, de Beer MC, de Beer FC, van der Westhuyzen DR. Serum amyloid A is a ligand for scavenger receptor class B type I and inhibits high density lipoprotein binding and selective lipid uptake. J Biol Chem. 2005;280:2954–2961. - PubMed
Publication types
MeSH terms
Substances
Grants and funding
LinkOut - more resources
Full Text Sources
Other Literature Sources
Medical
Molecular Biology Databases
Research Materials
Miscellaneous