

The targeted histone deacetylase inhibitor tefinostat (CHR-2845) shows selective in vitro efficacy in monocytoid-lineage leukaemias
- PMID: 26934551
- PMCID: PMC4941341
- DOI: 10.18632/oncotarget.7692
The targeted histone deacetylase inhibitor tefinostat (CHR-2845) shows selective in vitro efficacy in monocytoid-lineage leukaemias
Abstract
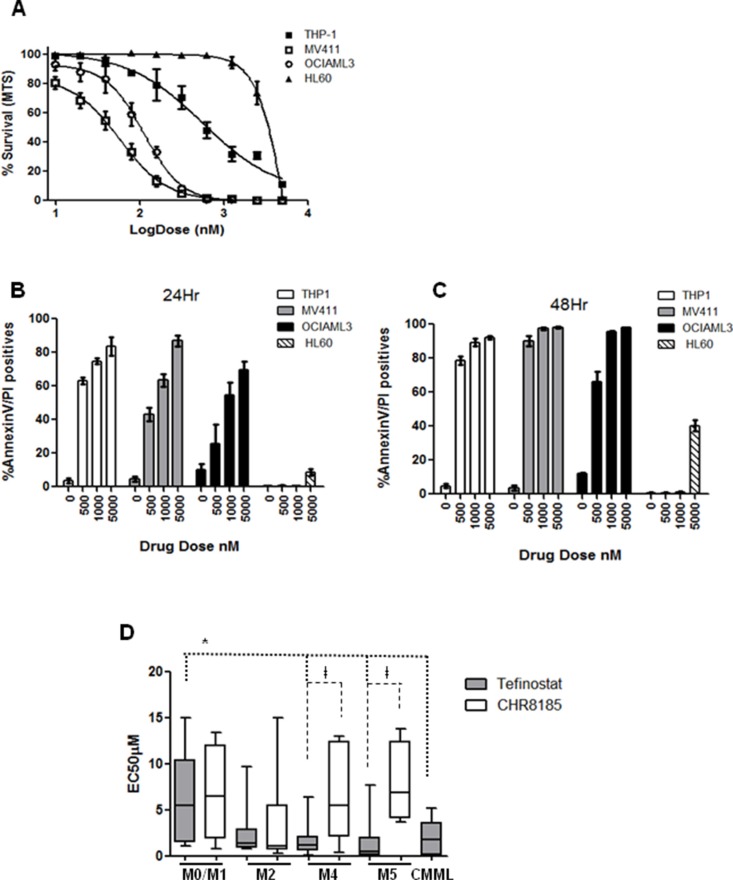
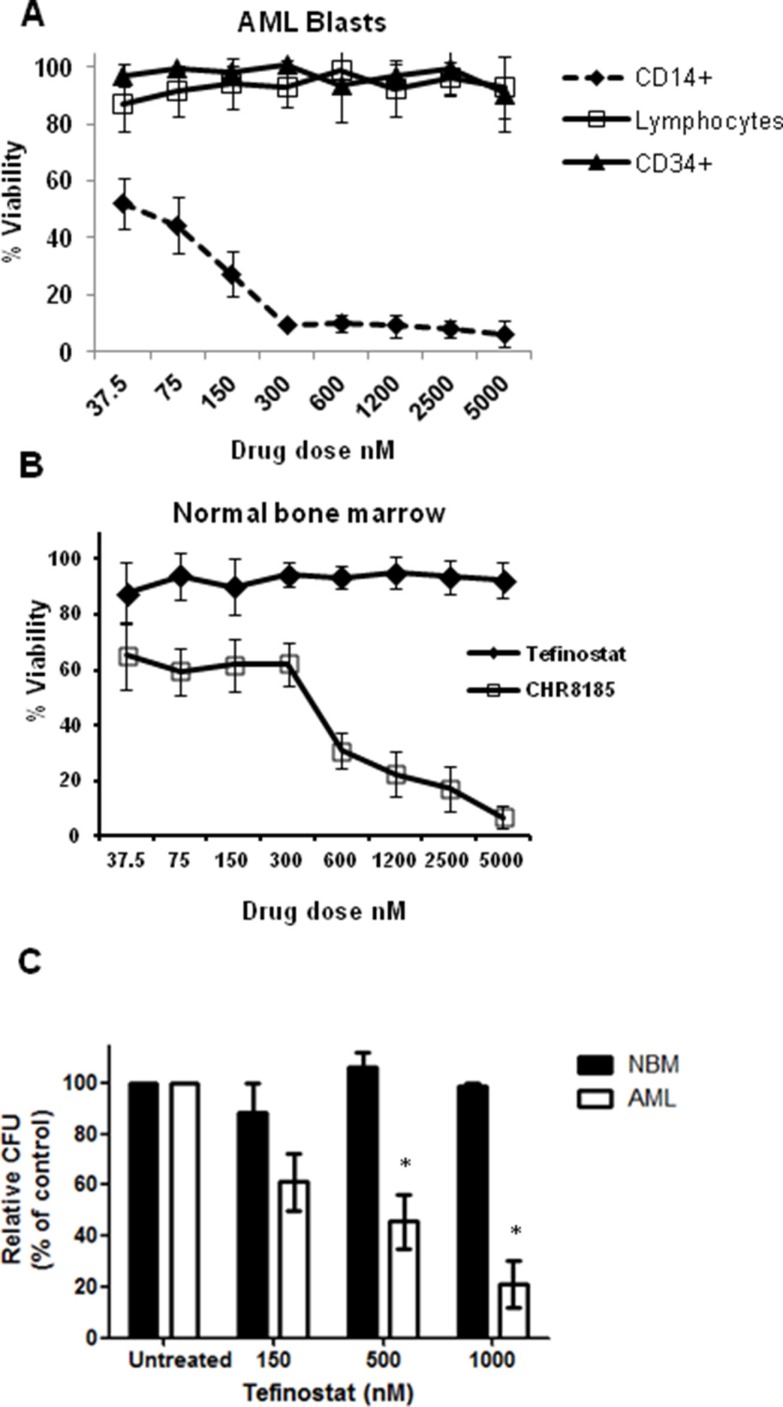
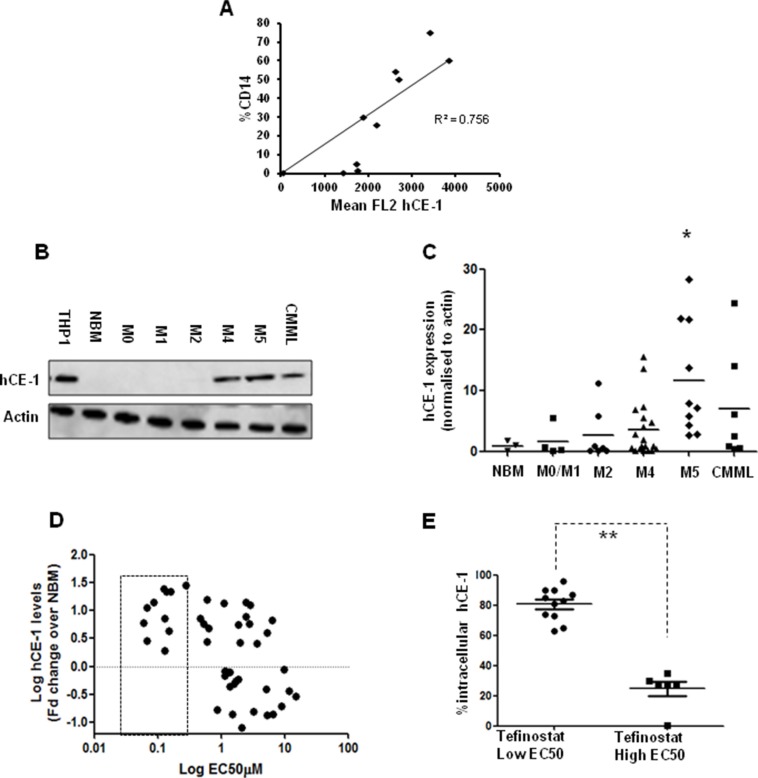
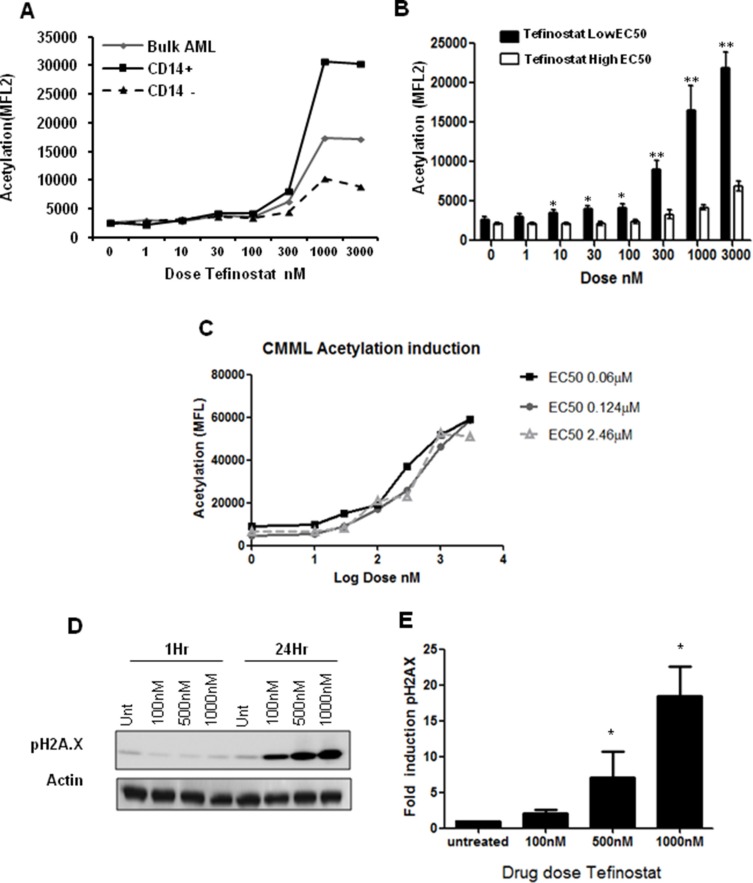
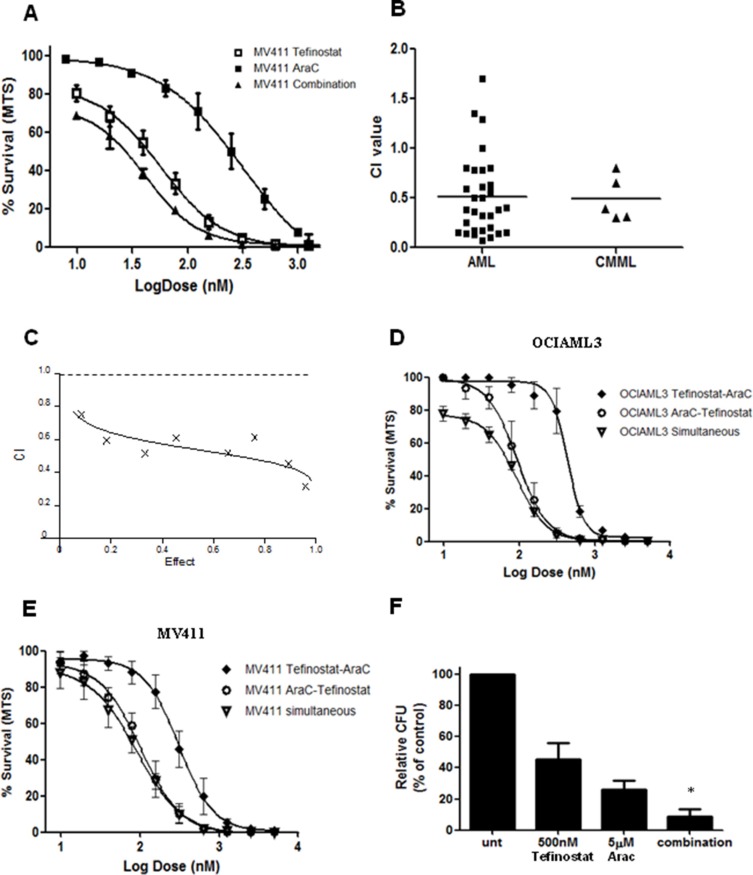
Tefinostat (CHR-2845) is a novel monocyte/macrophage-targeted histone deacetylase (HDAC) inhibitor which is cleaved into its active acid by the intracellular esterase human carboxylesterase-1 (hCE-1). The in vitro efficacy of tefinostat was characterised in cell lines and in a cohort of 73 primary AML and CMML samples. Dose-dependent induction of apoptosis and significant growth inhibitory effects were seen in myelomonocytic (M4), monocytic/monoblastic (M5) and CMML samples in comparison to non-monocytoid AML sub-types (p = 0.007). Importantly, no growth inhibitory effects were seen in normal bone marrow CD34+ cells exposed to AML-toxic doses of tefinostat in clonogenic assays. Expression of hCE-1 was measured by intracellular flow cytometry and immunoblotting across the cohort, with highest levels seen in M5 AML patients. hCE-1 levels correlated with significantly increased tefinostat sensitivity (low EC50) as measured by growth inhibition assays (p = 0.001) and concomitant elevation of the mature monocytoid marker CD14+. Strong induction of intracellular histone protein acetylation was observed in tefinostat-responsive samples, as were high levels of the DNA damage sensor γ-H2A.X, highlighting potential biomarkers of patient responsiveness. Synergistic interaction between tefinostat and the current standard treatment cytarabine was demonstrated in dose response and clonogenic assays using simultaneous drug addition in primary samples (median Combination Index value = 0.51). These data provide a strong rationale for the further clinical evaluation of tefinostat in monocytoid-lineage haematological neoplasms including CMML and monocyte-lineage AMLs.
Keywords: AML; CMML; HDACi; hCE-1; tefinostat.
Conflict of interest statement
The authors declare that there are no competing financial interests in relation to the work described.
Figures
Similar articles
-
A phase I first-in-human study with tefinostat - a monocyte/macrophage targeted histone deacetylase inhibitor - in patients with advanced haematological malignancies.Br J Haematol. 2013 Jul;162(2):191-201. doi: 10.1111/bjh.12359. Epub 2013 May 7. Br J Haematol. 2013. PMID: 23647373 Clinical Trial.
-
A novel alkylating deacetylase inhibitor molecule EDO-S101 in combination with cytarabine synergistically enhances apoptosis of acute myeloid leukemia cells.Med Oncol. 2019 Aug 1;36(9):77. doi: 10.1007/s12032-019-1302-0. Med Oncol. 2019. PMID: 31372848
-
Selective Inhibitors of Histone Deacetylases 1 and 2 Synergize with Azacitidine in Acute Myeloid Leukemia.PLoS One. 2017 Jan 6;12(1):e0169128. doi: 10.1371/journal.pone.0169128. eCollection 2017. PLoS One. 2017. PMID: 28060870 Free PMC article.
-
Resveratrol sensitizes acute myelogenous leukemia cells to histone deacetylase inhibitors through reactive oxygen species-mediated activation of the extrinsic apoptotic pathway.Mol Pharmacol. 2012 Dec;82(6):1030-41. doi: 10.1124/mol.112.079624. Epub 2012 Aug 24. Mol Pharmacol. 2012. PMID: 22923501 Free PMC article.
-
Histone deacetylase inhibition synergistically enhances pemetrexed cytotoxicity through induction of apoptosis and autophagy in non-small cell lung cancer.Mol Cancer. 2014 Oct 9;13:230. doi: 10.1186/1476-4598-13-230. Mol Cancer. 2014. PMID: 25301686 Free PMC article.
Cited by
-
Targeting Histone Deacetylases in Myeloid Cells Inhibits Their Maturation and Inflammatory Function With Limited Effects on Atherosclerosis.Front Pharmacol. 2019 Oct 29;10:1242. doi: 10.3389/fphar.2019.01242. eCollection 2019. Front Pharmacol. 2019. PMID: 31736752 Free PMC article.
-
Epigenetic regulation in hematopoiesis and its implications in the targeted therapy of hematologic malignancies.Signal Transduct Target Ther. 2023 Feb 17;8(1):71. doi: 10.1038/s41392-023-01342-6. Signal Transduct Target Ther. 2023. PMID: 36797244 Free PMC article. Review.
-
HDAC Inhibitors in Acute Myeloid Leukemia.Cancers (Basel). 2019 Nov 14;11(11):1794. doi: 10.3390/cancers11111794. Cancers (Basel). 2019. PMID: 31739588 Free PMC article. Review.
-
Treatment options for patients with myelodysplastic syndromes after hypomethylating agent failure.Hematology Am Soc Hematol Educ Program. 2016 Dec 2;2016(1):470-477. doi: 10.1182/asheducation-2016.1.470. Hematology Am Soc Hematol Educ Program. 2016. PMID: 27913518 Free PMC article. Review.
-
Histone Deacetylase Inhibitors: A Prospect in Drug Discovery.Turk J Pharm Sci. 2019 Mar;16(1):101-114. doi: 10.4274/tjps.75047. Epub 2018 Dec 31. Turk J Pharm Sci. 2019. PMID: 32454703 Free PMC article. Review.
References
-
- Bennett JM, Catovsky D, Daniel MT, Flandrin G, Galton DA, Gralnick HR, Sultan C. Proposals for the classification of the acute leukaemias. French-American-British (FAB) co-operative group. Br J Haematol. 1976;33:451–8. - PubMed
-
- Swerdlow SH, Campo E, Lee Harris N. WHO classification of tumours of hematopoietic and lymphoid tissues. 2015
-
- DiNardo CD, Cortes JE. New treatment for acute myelogenous leukemia. Expert Opin Pharmacother. 2015;16:95–106. - PubMed
-
- Bacher U, Haferlach T, Schnittger S, Kreipe H, Kroger N. Recent advances in diagnosis, molecular pathology and therapy of chronic myelomonocytic leukaemia. Br J Haematol. 2011;153:149–67. - PubMed
-
- Parikh SA, Tefferi A. Chronic myelomonocytic leukemia: 2013 update on diagnosis, risk stratification, and management. Am J Hematol. 2013;88:967–74. - PubMed
MeSH terms
Substances
Grants and funding
LinkOut - more resources
Full Text Sources
Other Literature Sources
Research Materials
