. 2016 Feb 25:6:21508.
doi: 10.1038/srep21508.

Directed evolution of G protein-coupled receptors in yeast for higher functional production in eukaryotic expression hosts

Affiliations

Directed evolution of G protein-coupled receptors in yeast for higher functional production in eukaryotic expression hosts

Marco Schütz et al. Sci Rep. .

Abstract

Despite recent successes, many G protein-coupled receptors (GPCRs) remained refractory to detailed molecular studies due to insufficient production yields, even in the most sophisticated eukaryotic expression systems. Here we introduce a robust method employing directed evolution of GPCRs in yeast that allows fast and efficient generation of receptor variants which show strongly increased functional production levels in eukaryotic expression hosts. Shown by evolving three different receptors in this study, the method is widely applicable, even for GPCRs which are very difficult to express. The evolved variants showed up to a 26-fold increase of functional production in insect cells compared to the wild-type receptors. Next to the increased production, the obtained variants exhibited improved biophysical properties, while functional properties remained largely unaffected. Thus, the presented method broadens the portfolio of GPCRs accessible for detailed investigations. Interestingly, the functional production of GPCRs in yeast can be further increased by induced host adaptation.


Conflict of interest statement

The authors declare competing financial interests. A patent application that covers the SaBRE technology has been filed by the University of Zurich.

Figures

Figure 1
Figure 1. Workflow for directed evolution of GPCRs in yeast.
Evolution of GPCRs starts with the generation of a DNA library by randomly mutagenizing the wild-type GPCR gene with error-prone PCR. Thereby, different variants with on average 2–5 non-silent mutations are created. The generated DNA library is then combined with the linearized expression vector and the mixture is used for transformation of yeast cells, during which the insert DNA and vector backbone are assembled in vivo by homologous recombination. The obtained yeast library comprises 5 × 107 − 1 × 108 different clones, each expressing a different GPCR variant (shown with different colors and different expression levels). After expression, the cells are permeabilized and incubated with fluorescent ligand (green diamonds) under saturating conditions. The fluorescent ligand binds exclusively to correctly folded GPCRs that are located in the plasma membrane, while unbound ligand is removed by washing. Correspondingly, cells producing receptor variants with high functional expression (here: red and dark blue) exhibit high fluorescence. Subsequently, these cells, which are expressing the desired GPCR phenotype, are selected during FACS by gating the top 0.5–1.0% of the most fluorescent cells. During FACS, the cells are directly sorted into growth medium for subsequent propagation. This selection by FACS is performed five times to obtain a strong enrichment of cells harbouring the best expressing GPCR variants. Whenever desired, the vectors coding for the GPCR variants can be isolated from the selected cells for analysis of individual mutants or for introduction of additional diversity by random mutagenesis for another round of evolution. Thus, one round of SaBRE includes one random mutagenesis followed by five selection rounds with FACS.
Figure 2
Figure 2. Expression levels in yeast after two rounds of SaBRE.
(a) Histogram plots of fluorescent ligand-binding flow cytometry data of expressed NTR1, NK1R, and KOR1 variants. In these flow cytometry experiments, the amount of functional receptors at the surface of intact individual cells is determined. Compared is the functional surface expression level of wild-type GPCRs (left panels), library pools obtained after the two rounds of SaBRE (middle panel) and variants evolved in E. coli (right panels). The total signal (red curves) and the nonspecific signal (green, tinted) are shown. For the wild-type GPCRs (NTR1, NK1R, KOR1) no specific signal is obtained, thus no active receptor is detected at the surface. After two rounds of SaBRE, the selected library pools (NTR1 2.5, NK1R 2.5, KOR1 2.5) show a high specific signal, reflecting a high surface expression of functional GPCRs. Variants previously evolved in E. coli (NTR1-D03, NK1R-E11) show a specific signal as well, albeit at significantly lower levels than obtained for the SaBRE library pools and for a significant fraction of cells, no functional expression is detected at the surface (note the double peak of the total signal). For instance, only 50% of the cells express NTR1-D03 at the surface, while for NK1R-E11 only a minority of cells show active surface expression. (b) Measurement of average total functional GPCRs expressed per cell of NTR1, NK1R, and KOR1 variants by radioligand binding. In contrast to flow cytometry analysis, radioligand binding assays account for the total amount of functional receptors averaged across an entire population of lysed cells, and will thus detect functional GPCRs in intracellular membranes as well. The wild-type GPCRs show very low expression levels and the receptor variants previously evolved in E. coli show a low to moderate average functional production. In contrast, the selected SaBRE library pools show high functional expression levels with on average 100,000–150,000 receptors per cell, representing an increase of up to 50- and 20-fold, compared to the wild-type receptors and the variants previously evolved in E. coli, respectively. Error bars indicate standard deviations from triplicates.
Figure 3
Figure 3. Expression of SaBRE variants in Sf9 insect cells and subsequent purification.
(ac) Measurement of average total functional GPCRs expressed per cell of NTR1, NK1R, and KOR1 variants by radioligand binding. Results from two independent expression experiments are shown (separate bars). The SaBRE variants show a significantly enhanced functional production in Sf9 insect cells with on average 4.0 × 106 — 5.5 × 106 functional receptors per cell. Compared to the corresponding wild-type receptors, NTR1-Y06 shows a 5-fold, NK1R-Y09 a 4-fold, and KOR1-Y05 a 26-fold increase in average functional expression. Error bars indicate standard deviations from triplicates. (d) Size-exclusion chromatography profiles of purified wild-type NK1R (solid lines) and NK1R-Y09 (dashed lines) purified in the presence of agonist (substance P, red lines) or antagonist (CP 99994, blue lines). Measured values for absorbance at 280 nm were normalized to the maximal absorbance obtained with NK1R-Y09. Equal amounts of cells were used for purification by immobilized metal ion affinity chromatography and the same volume of purified material was analyzed by size-exclusion chromatography. The size-exclusion chromatography profiles reflect the difference in functional expression levels and total yield of purified GPCR obtained with the wild-type receptor and the evolved variant. For NK1R-Y09, the yield of purified protein (3–6 mg/L) is increased by a factor of 4–5 compared to wild-type NK1R (≤1 mg/L).
Figure 4
Figure 4. Thermostability measurements.
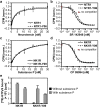
Thermostability assays for wild-type receptors (solid lines, circles) and evolved SaBRE variants (dashed lines, triangles) measured with radioligand binding are shown. (a) Thermostability measurements of NTR1 and NTR1-Y06. Compared to wild-type NTR1, NTR1-Y06 shows higher thermostability with a relative increase of the melting temperature (ΔTm) of 3.6 ± 0.8 °C. (b) Thermostability measurements of NK1R and NK1R-Y09. Compared to wild-type NK1R, NK1R-Y09 shows a higher thermostability with a relative increase of ΔTm of 5.4 ± 1.6 °C. (c) Thermostability measurements of KOR1 and KOR1-Y05. Compared to wild-type KOR1, KOR1-Y05 shows a higher thermostability with a relative increase of ΔTm of 12.4 ± 1.7 °C. Error bars indicate standard deviations from duplicates.
Figure 5
Figure 5. Analysis of the functional properties of the evolved GPCR variants.
(a,c) Determination of the apparent binding affinity of wild-type receptors (solid lines, circles) and evolved SaBRE variants (dashed lines, triangles) for agonists (neurotensin and substance P) by radioligand saturation binding. The apparent binding affinities (Kdapp ) of the corresponding receptors for neurotensin or substance P remain unaltered for the evolved receptors compared to the wild-type GPCRs. Neurotensin is bound by NTR1 with Kdapp = 3.0 ± 0.4 nM and by NTR1-Y06 with Kdapp = 3.0 ± 0.3 nM. Substance P is bound by NK1R with Kdapp = 9.4 ± 1.6 nM and by NK1R-Y09 with Kdapp = 9.2 ± 0.7 nM. Error bars indicate standard deviations from duplicates. (b,d) Determination of the apparent binding affinity of wild-type receptors (solid lines, circles) and evolved SaBRE variants (dashed lines, triangles) for antagonists (SR 142948 and CP 99994) by radioligand competition binding. The apparent binding affinities of the corresponding receptors for SR 142948 and CP 99994 remain unaltered or very similar for the evolved receptors compared to the wild-type GPCRs. SR 142948 is bound by NTR1 with Kdapp = 1.2 ± 1.1 nM and by NTR1-Y06 with Kdapp = 2.3 ± 1.1 nM. CP 99994 is bound by NK1R with Kdapp = 1.0 ± 1.1 nM and by NK1R-Y09 with Kdapp = 1.2 ± 1.1 nM. Error bars indicate standard deviations from duplicates. (e) Measurement of signalling activity of NK1R variants by [35S]-GTPγS binding. Equal amounts of active GPCR were assayed with identical concentrations of purified and reconstituted G protein in the absence (black) and presence (grey) of the agonist substance P. Results of two independent signalling assays performed with two independent GPCR expressions are shown (separate bars). The wild-type receptor as well as the evolved variant show low basal activity without agonist stimulation. Upon addition of substance P, signalling is detected by [35S]-GTPγS binding which for NK1R-Y09 remains similar to the wild-type receptor. Error bars indicate standard deviations from triplicates.
Figure 6
Figure 6. Analysis of induced adaptation in yeast cells expressing the evolved receptor variant NTR1-Y06.
(a) Expression profiles of different yeast strains expressing NTR1-Y06 measured by ligand binding flow cytometry experiments. Compared is the functional surface expression of NTR1-Y06 in a yeast strain isolated from the selected library pool NTR1 2.5, in a freshly transformed non-adapted strain, in a strain adapted by repetitive selection with FACS, and in an adapted strain that has been repetitively cultivated under non-expressing conditions. The total signal (red curves) and the nonspecific signal (green, tinted) are shown. The isolated strain shows a similar expression profile as detected for the NTR1 2.5 library pool (cf. Fig. 2a). In contrast, the freshly transformed and non-adapted strain shows a lower specific signal, corresponding to a decreased surface expression of NTR1-Y06. Furthermore, the subpopulation of cells showing no surface expression at all is increased in the non-adapted strain (note the increase of the left peak of the total signal double peak compared to the isolated strain). By five repetitive selections with FACS, the freshly transformed yeast strain can be adapted, which leads again to the high-expression profile. If the adapted strain is repetitively cultivated prior to induction of expression under non-expressing conditions, the average expression level decreases again, depicted by a drop of the specific signal in combination with an increase of the fraction of cells with no surface expression of NTR1-Y06. (b) Measurement of average total functional GPCRs produced per cell by radioligand binding. The data show the significant difference in the average number of active NTR1-Y06 receptors per cells between non-adapted and adapted strains. As shown by the flow cytometry data, the higher total expression levels can be explained by a combined effect of an increased surface expression per cell in the expressing subpopulation of cells and a decrease of the fraction of cells showing no active surface expression. Upon repetitive cultivation of the adapted strain under non-expressing conditions, the average functional receptor levels drop by about 30%. Error bars indicate standard deviations from triplicates.
Figure 7
Figure 7. Quantification of total GPCR produced in non-adapted and adapted yeast strains.
(a) GPCR expression construct with a C-terminal HA-tag used for the quantification of the total amount of receptor produced. (b) Measurement of average total functional GPCRs produced per cell of HA-tagged NTR1 variants expressed in non-adapted and adapted yeast strains by radioligand binding. Compared to expression of HA-tagged NTR1-Y06 in the non-adapted strain, adaptation leads to a further increase in average total functional production by a factor of 10. Error bars indicate standard deviations from triplicates. (c) Quantitative Western blot analysis of HA-tagged NTR1 variants expressed in non-adapted and adapted yeast strains. Equal numbers of cells were lysed for protein extraction and actin was used as a loading control (green). GPCRs were detected via their HA-tag (red), with main bands corresponding to monomeric GPCRs and bands of higher molecular weight, most likely representing GPCR dimers not disintegrated under the conditions used. For quantification (bar chart), intensities of all defined bands were accounted for. In the non-adapted strains, the total GPCR produced increases approximately 1.5-fold from wild-type NTR1 (lane 1) to NTR1-Y06 (lane 2). While the total amount of NTR1-Y06 produced increases also slightly when expressed in the adapted strain (lane 3) compared to expression in the non-adapted strain, the relative increase of total receptor produced (approximately 1.8-fold) is much lower than the increase in functional receptor observed in radioligand binding (approximately 10-fold). For a negative control (lane 4), cells expressing NTR1-Y06 without a HA-tag were used.
Figure 8
Figure 8. Analysis of intracellular and surface-expressed GPCR in non-adapted and adapted yeast strains.
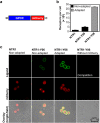
(a) GPCR expression construct with a C-terminal fusion to mCherry used for the detection of intracellular and surface-expressed receptor. (b) Radioligand binding measurements of average total functional GPCRs produced per cell of NTR1 variants with a C-terminal fusion to mCherry expressed in non-adapted and adapted yeast strains. Compared to expression of the NTR1-Y06-mCherry fusion in the non-adapted strain, adaptation leads to a further increase in average total functional production by a factor of 6. Error bars indicate standard deviations from triplicates. (c) Confocal fluorescence microscopy studies of NTR1 variants with a C-terminal fusion to mCherry in non-adapted and adapted yeast strains. Fluorescence intensities obtained by fluorescent ligand binding (top row, green) or from mCherry (middle row, red) as well as bright-field microscopy overlays (bottom row) are shown. For expression of wild-type NTR1 in the non-adapted strain (first column), no ligand binding signal at the cell surface is detected. A distinct mCherry signal is exclusively located in the cell interior, reflecting intracellularly retained receptor, which is mostly inactive according to the radioligand binding data. For expression of NTR1-Y06 in the non-adapted strain (second column), functional receptor at the surface is detected by fluorescent ligand binding. Similar as for expression of wild-type NTR1, the detected signal for mCherry is still localized to a large extent in the cell interior. For expression of NTR1-Y06 in the adapted strain (third column), strong signals for both fluorescent ligand binding and mCherry are observed at the surface, with only little mCherry detected in the cell interior. For a negative control (fourth column), cells expressing NTR1-Y06 without a mCherry fusion were incubated with fluorescently labelled ligand in excess of non-labelled ligand. Representative pictures are shown.

Similar articles

Cited by

References

    1. Fredriksson R., Lagerström M. C., Lundin L.-G. & Schiöth H. B. The G-protein-coupled receptors in the human genome form five main families. Phylogenetic analysis, paralogon groups, and fingerprints. Mol Pharmacol 63, 1256–1272 (2003). - PubMed
    1. Marinissen M. J. & Gutkind J. S. G-protein-coupled receptors and signaling networks: emerging paradigms. Trends Pharmacol Sci 22, 368–376 (2001). - PubMed
    1. Heng B. C., Aubel D. & Fussenegger M. An overview of the diverse roles of G-protein coupled receptors (GPCRs) in the pathophysiology of various human diseases. Biotechnol Adv 31, 1676–1694 (2013). - PubMed
    1. Overington J. P., Al-Lazikani B. & Hopkins A. L. How many drug targets are there? Nat Rev Drug Discov 5, 993–996 (2006). - PubMed
    1. Lagerström M. C. & Schiöth H. B. Structural diversity of G protein-coupled receptors and significance for drug discovery. Nat Rev Drug Discov 7, 339–357 (2008). - PubMed

Publication types

MeSH terms

Substances