. 2016 Apr 14;90(9):4346-4356.
doi: 10.1128/JVI.00179-16. Print 2016 May.

Expression of Oncogenic Alleles Induces Multiple Blocks to Human Cytomegalovirus Infection

Affiliations

Expression of Oncogenic Alleles Induces Multiple Blocks to Human Cytomegalovirus Infection

Shihao Xu et al. J Virol. .

Abstract

In contrast to many viruses, human cytomegalovirus (HCMV) is unable to productively infect most cancer-derived cell lines. The mechanisms of this restriction are unclear. To explore this issue, we tested whether defined oncogenic alleles, including the simian virus 40 (SV40) T antigen (TAg) and oncogenic H-Ras, inhibit HCMV infection. We found that expression of SV40 TAg blocks HCMV infection in human fibroblasts, whereas the replication of a related herpesvirus, herpes simplex virus 1 (HSV-1), was not impacted. The earliest restriction of HCMV infection involves a block of viral entry, as TAg expression prevented the nuclear delivery of viral DNA and pp65. Subsequently, we found that TAg expression reduces the abundance of platelet-derived growth factor receptor α (PDGFRα), a host protein important for HCMV entry. Viral entry into TAg-immortalized fibroblasts could largely be rescued by PDGFRα overexpression. Similarly, PDGFRα overexpression in HeLa cells markedly increased the levels of HCMV gene expression and DNA replication. However, the robust production of viral progeny was not restored by PDGFRα overexpression in either HeLa cells or TAg-immortalized fibroblasts, suggesting additional restrictions associated with transformation and TAg expression. In TAg-expressing fibroblasts, expression of the immediate early 2 (IE2) protein was not rescued to the same extent as that of the immediate early 1 (IE1) protein, suggesting that TAg expression impacts the accumulation of major immediate early (MIE) transcripts. Transduction of IE2 largely rescued HCMV gene expression in TAg-expressing fibroblasts but did not rescue the production of infectious virions. Collectively, our data indicate that oncogenic alleles induce multiple restrictions to HCMV replication.

Importance: HCMV cannot replicate in most cancerous cells, yet the causes of this restriction are not clear. The mechanisms that restrict viral replication in cancerous cells represent viral vulnerabilities that can potentially be exploited therapeutically in other contexts. Here we found that SV40 T antigen-mediated transformation inhibits HCMV infection at multiple points in the viral life cycle, including through inhibition of proper viral entry, normal expression of immediate early genes, and viral DNA replication. Our results suggest that the SV40 T antigen could be a valuable tool to dissect cellular activities that are important for successful infection, thereby potentially informing novel antiviral development strategies. This is an important consideration, given that HCMV is a leading cause of birth defects and causes severe infection in immunocompromised individuals.


Figures

FIG 1
FIG 1
The expression of SV40 TAg blocks HCMV replication. (A) The protein levels of SV40 large T antigen (LT) and H-Ras in primary fibroblasts (P) or their transduced derivatives were measured by Western blotting. These fibroblast lines include those expressing telomerase alone (P-ht), those expressing telomerase plus the SV40 early region (TAg), or those expressing the combination of telomerase, the SV40 early region, and H-RasV12 (TAgR). (B to D) The cells for which the results are shown in panel A were infected with herpes simplex virus (B) or HCMV AD169 (C and D) at an MOI of 3.0. The production of infectious virions at 1 dpi (B), 3 to 7 dpi (C), and 5 dpi (D) was measured by plaque assay. (C) Asterisks indicate significant differences between the values for primary cells and those for TAg-expressing cells (*, P < 0.05; **, P < 0.01; ****, P < 0.001). Number signs indicate significant differences between the values for primary cells and those for TAgR cells (#, P < 0.05; ##, P < 0.01). (E) The cells for which the results are shown in panel A were maintained in serum-free medium for 96 h and infected with HCMV AD169 at an MOI of 3.0. Cell cycle analysis was performed by analyzing the cellular DNA content by flow cytometry at 24 hpi. Asterisks indicate significant differences between the values for primary cells and those for TAg-expressing cells (P < 0.001). (F) The cells for which the results are shown in panel A were infected with HCMV (AD169, MOI = 3.0), and the protein levels of IE1, UL26, pp28, and GAPDH were measured by Western blotting at 4, 24, 48, and 72 hpi. The numbers to the left of the gels in panels A and F are molecular masses (in kilodaltons).
FIG 2
FIG 2
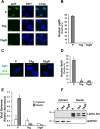
Expression of SV40 TAg blocks proper HCMV entry. (A) Primary fibroblasts and TAg and TAgR cells were infected with HCMV (AD169, MOI = 3.0), and the localization of pp65 was determined by measurement of the level of immunofluorescence at 4 hpi. Bars, 20 μm. (B) The number of nuclei with positive pp65 staining in cells infected as described in the legend to panel A was quantified. (C) The cells for which the results are shown in panel A were infected with BrdU-labeled AD169, and the localization of BrdU was determined by measurement of the level of immunofluorescence at 4 hpi. Bars, 20 μm. (D) The number of nuclei with positive BrdU staining in the cells for which the results are shown in panel C was quantified. (E) The indicated cells were infected as described in the legend to panel A, and the HCMV genomes in the cytosolic or the nuclear fractions were quantified at 4 hpi. (F) The abundance of the nuclear lamin A/C and GAPDH proteins in the cytosolic and nuclear fractions from the lysates generated in the assay whose results are presented in panel E was measured. The numbers to the left of the gels are molecular masses (in kilodaltons).
FIG 3
FIG 3
PDGFRα overexpression partly rescues HCMV entry in fibroblasts expressing SV40 TAg. (A and B) The PDGFRα protein abundance (A) or mRNA level (B) in primary fibroblasts (P) or TAg or TAgR fibroblasts was measured by Western blot and qPCR, respectively. (C) Cell lysates from primary fibroblasts or TAg or TAgR fibroblasts transduced with either PDGFRα or a control vector (Vec) were subjected to Western blotting analysis of PDGFRα. (D) The localization of pp65 in primary fibroblasts or TAg or TAgR fibroblasts transduced with PDGFRα or a control vector was determined by measurement of the level of immunofluorescence at 4 hpi (AD169, MOI = 3.0). Bars, 20 μm. (E) The number of nuclei with pp65 staining in cells infected as described in the legend to panel D was quantified. (F) The indicated cells were infected with EGFP-tagged AD169 (MOI = 3.0), and EGFP fluorescence was measured at 48 hpi. Bars, 100 μm. The numbers to the left of the gels in panels A and C are molecular masses (in kilodaltons).
FIG 4
FIG 4
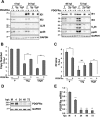
PDGFRα overexpression partly rescues HCMV gene expression and DNA replication but not virion production in TAg-expressing fibroblasts. (A) Primary fibroblasts (P) or TAg or TAgR fibroblasts transduced with PDGFRα cDNA or a control vector were infected with HCMV (AD169, MOI = 3.0). Cell lysates were harvested at 4, 24, 48, and 72 hpi and subjected to Western blotting analysis for IE1, IE2, UL26, pp28, and GAPDH. (B) The viral DNA abundance in cells infected as described in the legend to panel A was quantified and is displayed as the copy number per nanogram of input DNA on a log10 scale. Asterisks indicate significant differences between control and PDGFRα-transduced cells (***, P < 0.001). (C) Production of infectious virions was measured by plaque assay in the cells infected as described in the legend to panel A and harvested at 120 hpi. Asterisks indicate significant differences between control cells and PDGFRα-transduced cells (***, P < 0.001; NS, not significant). (D and E) Primary fibroblasts mock infected or infected with HCMV (AD169, MOI = 3.0) were harvested at the indicated times and analyzed for the abundance of the PDGFRα protein by Western blotting (D) or PDGFRα mRNA by qPCR (E). Asterisks indicate significant differences between values for mock-infected and HCMV-infected cells (***, P < 0.001). The numbers to the left of the gels in panels A and D are molecular masses (in kilodaltons).
FIG 5
FIG 5
PDGFRα and TAg expression in fibroblasts results in the differential accumulation of major immediate early transcripts. (A to C) Primary fibroblasts (P) or TAg or TAgR fibroblasts transduced with PDGFRα cDNA or a control vector were infected with HCMV (AD169, MOI = 3.0) and harvested for analysis of mRNA by qPCR. The abundances of IE1 (A), IE2 (B), and UL37 (C) mRNA were plotted after normalization to GAPDH mRNA levels. Asterisks indicate significant differences between control cells and PDGFRα-transduced cells (**, P < 0.01; ***, P < 0.001). (D and E) The fraction of IE1 or IE2 in the total sum of IE1 and IE2 was measured in cells infected as described in the legend to panel A. Asterisks indicate significant differences between the values for IE1 in the primary cells and TAg-expressing cells (*, P < 0.05). Number signs indicate significant differences between the values for IE2 in the primary cells and other cells (##, P < 0.01).
FIG 6
FIG 6
HCMV IE2 overexpression rescues HCMV gene expression but not virion production in TAg-expressing fibroblasts. (A) Lysates of primary fibroblasts infected with HCMV (MOI = 3.0) at 24 hpi PDGFRα-expressing TAg cells transduced with either the HCMV MIE gene or a control vector were subjected to Western blotting analysis of IE2. (B) Primary fibroblasts and PDGFRα-expressing TAg cells transduced with the HCMV MIE gene or a control vector were infected with HCMV (AD169, MOI = 3.0) and harvested at 4, 24, 48, and 72 hpi. The resulting lysates were subjected to Western blotting analysis of IE1, IE2, UL26, UL44, pp28, and GAPDH. The numbers to the left of the gels in panels A and B are molecular masses (in kilodaltons). (C) The viral DNA abundance in the cells infected as described in the legend to panel B was quantified and is displayed as the copy number per nanogram of input DNA on a log10 scale. (D) PDGFRα-expressing TAg cells transduced with the HCMV MIE gene or a control vector were infected with HCMV (AD169, MOI = 3.0). Production of infectious virions was measured by plaque assay at 120 hpi.
FIG 7
FIG 7
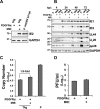
PDGFRα overexpression increases HCMV gene expression and DNA replication but not virion production in HeLa cells. (A) Lysates of HeLa cells transduced with PDGFRα cDNA or a control vector were subjected to Western blotting analysis of PDGFRα. (B) HeLa cells transduced with PDGFRα cDNA or a control vector were infected with EGFP-tagged AD169, and the fluorescence of EGFP was observed at 48 hpi. Bars, 100 μm. (C) Primary fibroblasts (P) or HeLa cells transduced with PDGFRα (HeLa-R) or a control vector (HeLa-V) were infected with HCMV (AD169, MOI = 3.0), harvested at 4, 24, 48, and 72 hpi, and subjected to Western blotting analysis for IE1, IE2, UL26, UL44, pp65, pp28, PDGFRα, and GAPDH. (D) HCMV DNA abundance in cells infected as described in the legend to panel C was measured and normalized to the quantity in HCMV-infected primary fibroblasts. (E) The production of infectious virions in HeLa cells transduced with PDGFRα cDNA or a control vector (AD169, MOI = 3.0, 120 hpi) was measured. (F) HeLa cells transduced with PDGFRα cDNA or a control vector were infected with EGFP-tagged TB40/e, and the fluorescence of EGFP was observed at 72 hpi. Bars, 100 μm. (G) The cells for which the results are presented in panel C were infected with EGFP-tagged TB40/e (MOI = 3.0), and virion production was measured at 5, 7, and 10 dpi. *, levels below the detection limit. The numbers to the left of the gels in panels A and C are molecular masses (in kilodaltons).

Similar articles

Cited by

References

    1. Mocarski ES, Shenk T, Pass RF. 2007. Cytomegaloviruses, p 2701–2757. In Knipe DM, Howley PM, Griffin DE, Lamb RA, Martin MA, Roizman B, Straus SE PM (ed), Fields virology, 5th ed Lippincott Williams & Wilkins, Philadelphia, PA.
    1. Gerna G, Baldanti F, Revello MG. 2004. Pathogenesis of human cytomegalovirus infection and cellular targets. Hum Immunol 65:381–386. doi:10.1016/j.humimm.2004.02.009. - DOI - PubMed
    1. Cannon MJ. 2009. Congenital cytomegalovirus (CMV) epidemiology and awareness. J Clin Virol 46(Suppl 4):S6–S10. doi:10.1016/j.jcv.2009.09.002. - DOI - PubMed
    1. Hahn G, Jores R, Mocarski ES. 1998. Cytomegalovirus remains latent in a common precursor of dendritic and myeloid cells. Proc Natl Acad Sci U S A 95:3937–3942. doi:10.1073/pnas.95.7.3937. - DOI - PMC - PubMed
    1. Smith JD. 1986. Human cytomegalovirus: demonstration of permissive epithelial cells and nonpermissive fibroblastic cells in a survey of human cell lines. J Virol 60:583–588. - PMC - PubMed

Publication types

MeSH terms

Substances