. 2016 May;283(9):1653-68.
doi: 10.1111/febs.13682. Epub 2016 Apr 13.

Expression profile and overexpression outcome indicate a role for βKlotho in skeletal muscle fibro/adipogenesis

Affiliations

Expression profile and overexpression outcome indicate a role for βKlotho in skeletal muscle fibro/adipogenesis

Michael Phelps et al. FEBS J. 2016 May.

Abstract

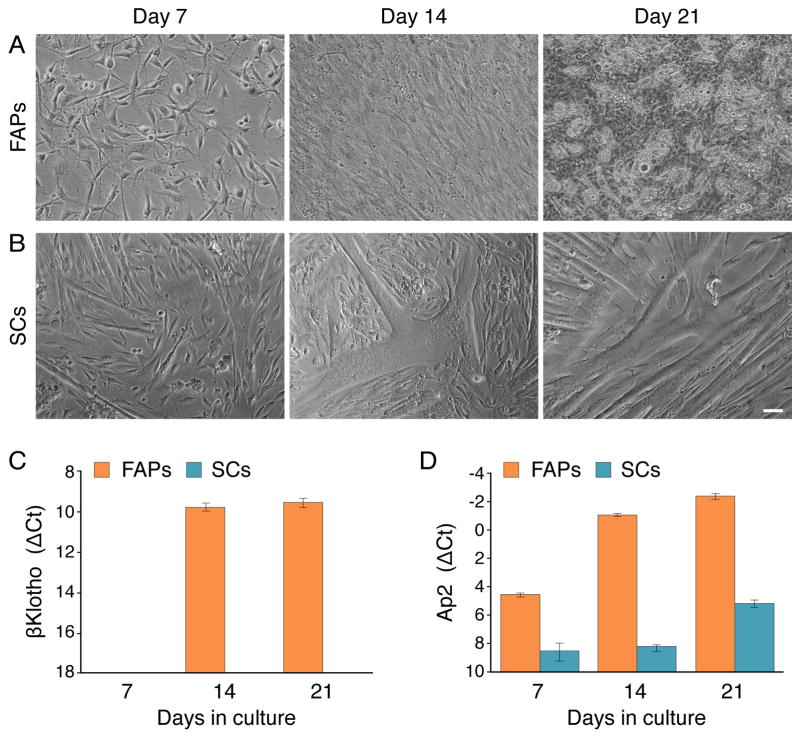
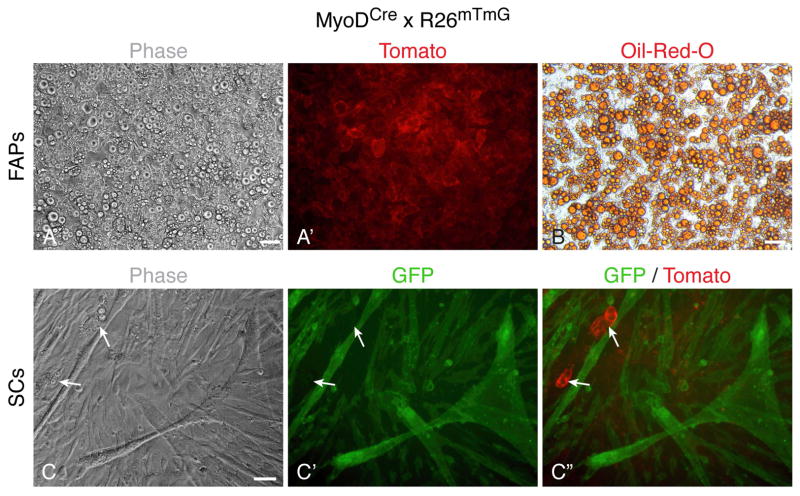
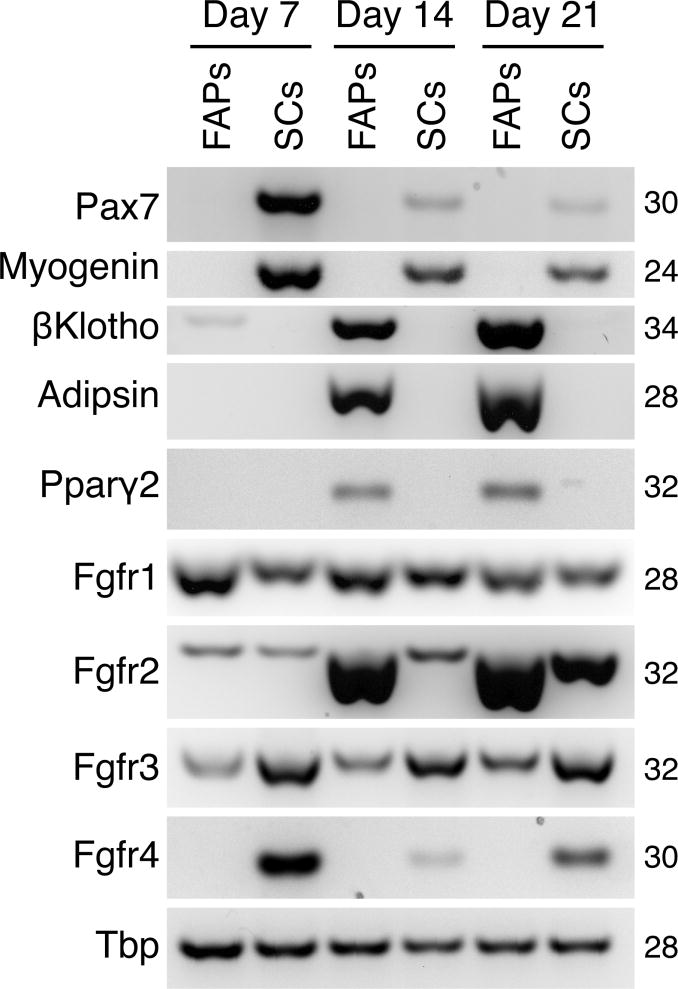
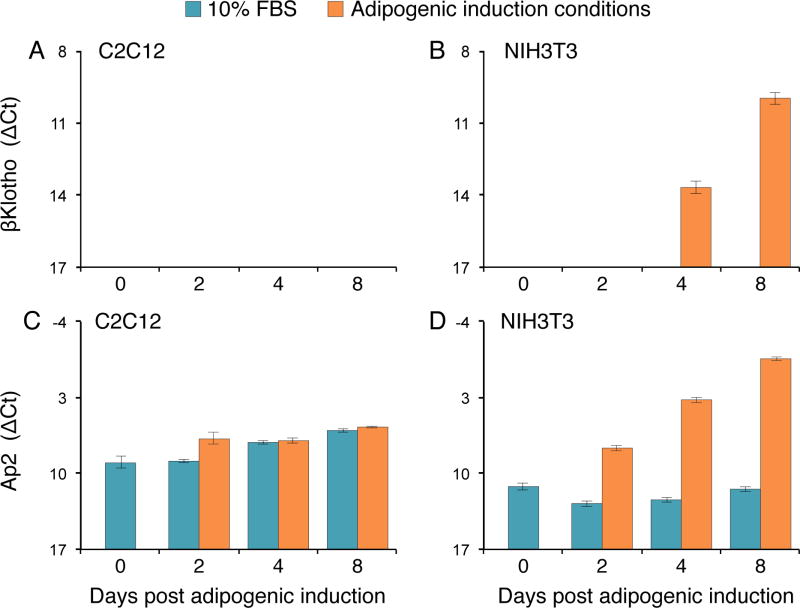
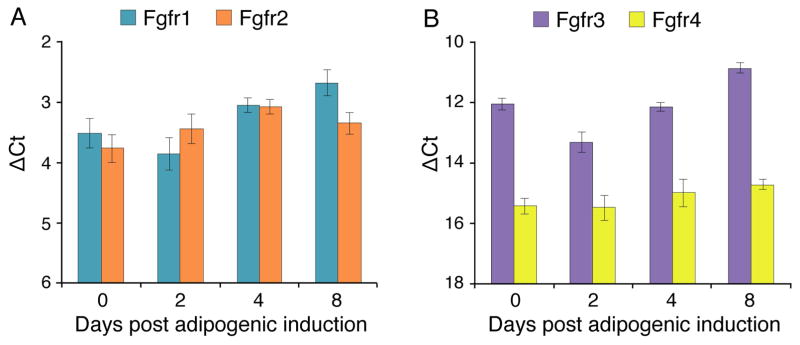
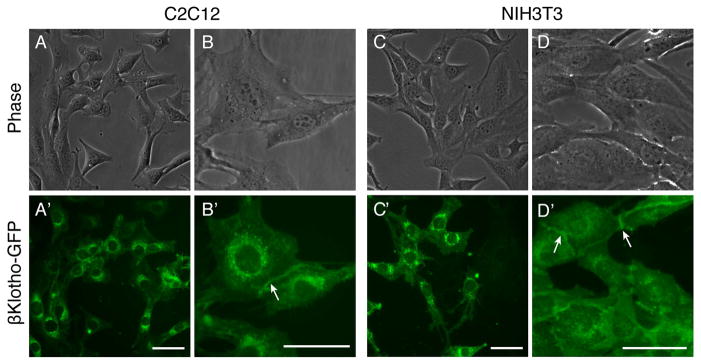
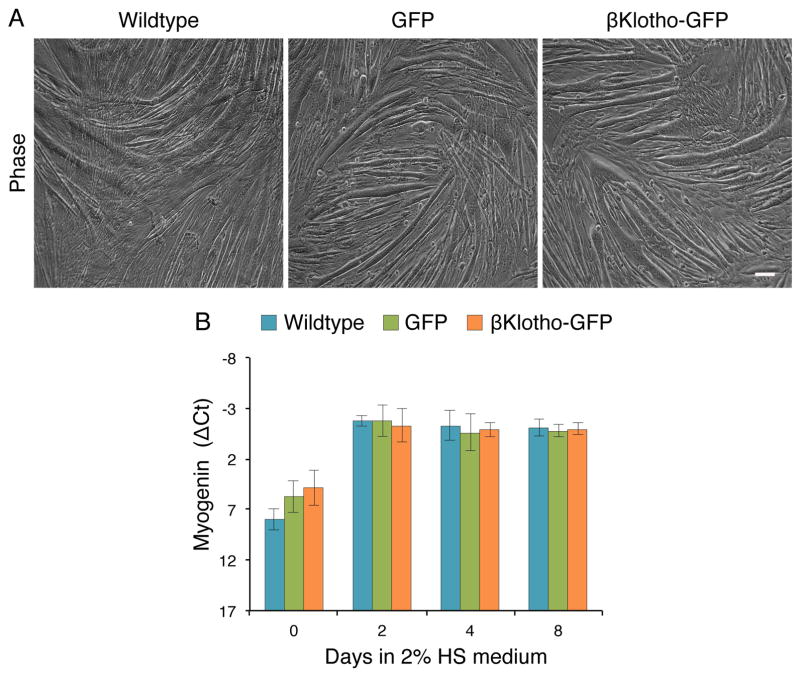
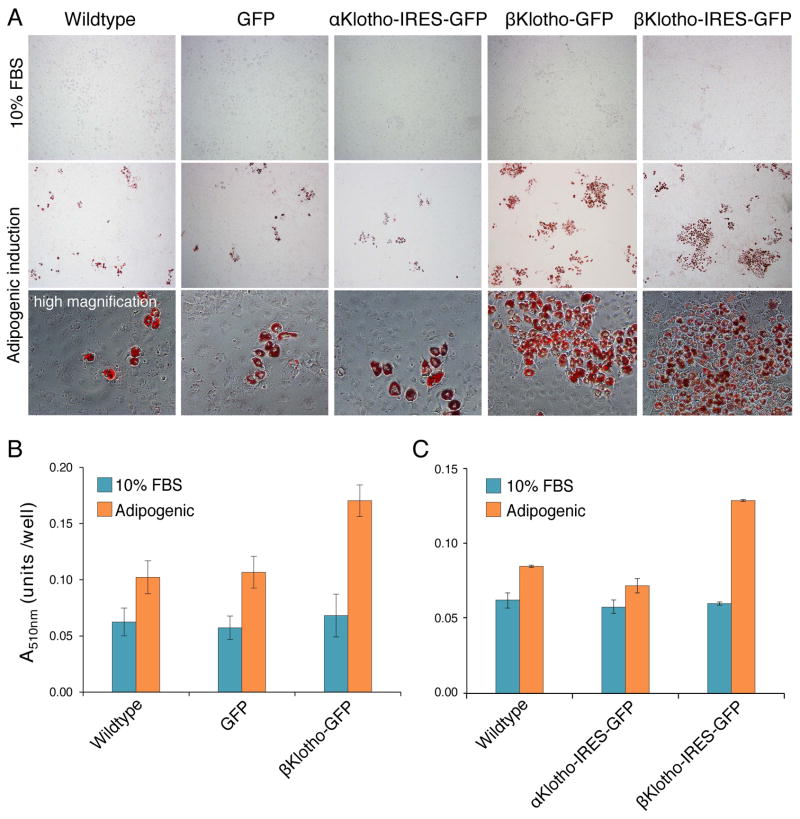
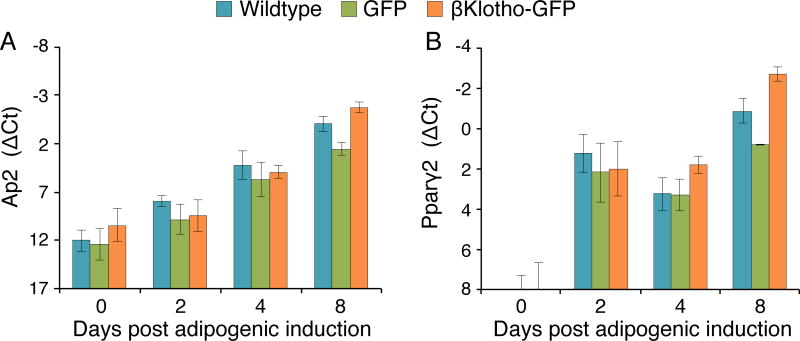
Regeneration of skeletal muscles is required throughout life to ensure optimal performance. Therefore, a better understanding of the resident cells involved in muscle repair is essential. Muscle repair relies on satellite cells (SCs), the resident myogenic progenitors, but also involves the contribution of interstitial cells including fibro/adipocyte progenitors (FAPs). To elucidate the role of the fibroblast growth factor (FGF) signaling in these two cell populations, we previously analyzed freshly isolated cells for their FGF receptor (FGFR) signature. Transcript analysis of the four Fgfr genes revealed distinct expression profiles for SCs and FAPs, raising the possibility that these two cell types have different FGF-mediated processes. Here, we pursued this hypothesis exploring the role of the Klotho genes, whose products are known to function as FGFR co-receptors for the endocrine FGF subfamily. Isolated SC and FAP populations were analyzed in culture, exhibiting spontaneous myogenic or adipogenic differentiation, respectively. αKlotho expression was not detected in either population. βKlotho expression, while not detected in SCs, was strongly upregulated in FAPs entering adipogenic differentiation, coinciding with expression of a panel of adipogenic genes and preceding the appearance of intracellular lipid droplets. Overexpression of βKlotho in mouse cell line models enhanced adipogenesis in NIH3T3 fibroblasts but had no effect on C2C12 myogenic cells. Our study supports a pro-adipogenic role for βKlotho in skeletal muscle fibro/adipogenesis and calls for further research on involvement of the FGF-FGFR-βKlotho axis in the fibro/adipogenic infiltration associated with functional deterioration of skeletal muscle in aging and muscular dystrophy.

Keywords: FAPs; FGF21; PiggyBac transposon; adipogenesis; adipogenic differentiation; fibro/adipocytes; fibroblast growth factor receptor; satellite cells; αKlotho; βKlotho.


Figures

Fig. 1
Fig. 1
Morphological (A, B) and quantitative RT-PCR (C, D) analyses of FAP and SC cultures harvested on days 7, 14, and 21 following initial plating. FAP and SC populations were isolated by FACS after obtaining single cell suspensions from hindlimb muscles of adult wildtype mice, and cultured in our standard (mitogen-rich) primary culture medium that promotes spontaneous adipogenesis and myogenesis of FAPs and SCs, respectively. The cultures were followed up morphologically (A, B), then harvested for quantitative RT-PCR analyses of βKlotho and the early adipogenic marker Ap2 (C, D). Notably, the presence of adipocytes containing multivacuolar lipid droplets seen in advanced FAP cultures (but not in SC cultures) has been also confirmed by Oil-Red-O staining as performed in Fig. 2. ΔCt values were normalized in reference to Eef2 gene expression. Results are noted as mean ± SD, n=3. Scale bars, 50 μm.
Fig. 2
Fig. 2
Lineage tracing analysis of FAP and SC cultures maintained under adipogenic induction conditions. FAPs and SCs were isolated from hindlimb muscles of adult MyoDCre x R26mTmG mice by FACS and cultured in our standard (mitogen-rich) primary culture medium until reaching near confluence, then switched to adipogenic induction conditions for up to 2 weeks. The R26mTmG reporter operates on a membrane-localized dual fluorescent system where all cells express Tomato until Cre-mediated excision of the Tomato gene allows for GFP expression in the targeted cell lineage [72]. Consequently, due to ancestral MyoD expression in the myogenic lineage [71], in the MyoDCre x R26mTmG cross, all skeletal muscles and their resident SCs are GFP+ while all other cells are Tomato+, as described in our previous studies [7, 39, 73]. (A, A′) Upon adipogenic induction, FAP cultures underwent robust adipogenesis with nearly all cells developing into adipocytes as illustrated by the presence of large intracellular lipid droplets (A′) stained with Oil-Red-O staining (B). Notably, images in (A, A′) and (B) were taken from two different replicative wells as the Oil-Red-O staining causes a general red autofluorescence, which preclude any reliable co-analysis of Tomato+ fluorescence. (C–C″) Differently, SC cultures, even when switched to adipogenic induction conditions, maintained a myogenic fate with only very rare adipocytes detected, which were Tomato+ indicating their non-myogenic source. Scale bars, 50 μm.
Fig. 3
Fig. 3
Semi-quantitative RT-PCR analyses of FAP and SC cultures harvested on days 7, 14, and 21 following initial plating. FAP and SC populations were isolated by flow cytometry from hindlimb muscles of adult wildtype mice and cultured in our standard (mitogen-rich) primary culture medium (as in Fig. 1). Pax7, Myogenin, βKlotho, Adipsin, Pparγ2, Ffgr1, Fgfr2, Fgfr3, and Fgfr4 transcript levels were determined and the expression level of Tbp was used as a reference gene.
Fig. 4
Fig. 4
Quantitative RT-PCR analysis of βKlotho and the early adipogenic gene Ap2 in (A, C) C2C12 and (B, D) NIH3T3 cultures maintained throughout the experiment in our standard 10% FBS cell line growth medium or switched to the adipogenic induction conditions. Day 0 refers to cultures just prior to the switch and subsequent days 2, 4, 6, 8 reflect time following the switch to the adipogenic induction conditions. ΔCt values were normalized in reference to Eef2 gene expression. Results are noted as mean ± SD, n=6.
Fig. 5
Fig. 5
Quantitative RT-PCR analysis of expression levels of (A) Fgfr1/Fgfr2, and (B) Fgfr3/Fgfr4 genes in NIH3T3 cultures switched to the adipogenic induction conditions. Day 0 refers to cultures just prior to the switch and subsequent days 2, 4, 8 reflect time following the switch to the adipogenic induction conditions. ΔCt values were normalized in reference to Eef2 gene expression. Results are noted as mean ± SD, n=3.
Fig. 6
Fig. 6
Morphological and quantitative RT-PCR characterization of all C2C12 and NIH3T3 stable cell lines developed in the current study. Cell lines that have integrated the βKlotho-GFP fusion construct were compared to wildtype and cell lines that have integrated a control GFP construct; additional NIH3T3 stable cell lines that have integrated a βKlotho-IRES-GFP or a αKlotho-IRES-GFP construct were also analyzed as controls. (A) Representative phase and GFP fluorescent images (live cultures). Cell lines overexpressing a GFP, αKlotho-IRES-GFP, or βKlotho-IRES-GFP construct show a typical ubiquitous GFP fluorescence pattern with the latter two lines depicting lower level of GFP, likely due to GFP gene being downstream of IRES sequence. C2C12 and NIH3T3 cells overexpresssing the βKlotho-GFP fusion construct demonstrate specifically localized GFP fluorescence in perinuclear and cell-cell contact regions as further depicted in higher magnification images in Fig. 7. C2C12 cultures shown were switched to 2% HS medium to promote synchronized myogenic differentiation, and both myoblasts and myotubes exhibit similar ubiquitous (GFP construct) or localized (βKlotho-GFP construct) GFP distribution pattern. (B, C) Overexpression of βKlotho was measured at the transcript level by quantitative RT-PCR in (B) C2C12 and (C) NIH3T3 cell lines. ΔCt values were normalized in reference to Eef2 gene expression. Results are noted as mean ± SD, n=3.
Fig. 7
Fig. 7
Localization of overexpressed βKlotho-GFP fusion protein in C2C12 myoblasts and NIH3T3 fibroblasts cultured in standard 10% growth medium. In both cell lines, βKlotho-GFP detected by direct GFP localization in live cells is localized to (A–D′) perinuclear regions and occasionally (B–B′, D–D′) areas of cell-cell contact (arrows). Scale bars, 5 μm.
Fig. 8
Fig. 8
βKlotho overexpressing C2C12 cells retain their myogenic fate as determined by morphological and transcript expression analyses. Wildtype C2C12 cells and C2C12 cells overexpressing GFP or βKlotho-GFP were cultured in standard 10% FBS growth medium and when near confluence, switched (day 0) into a DMEM-based medium containing 2% HS in order to promote a synchronized myogenic differentiation. (A) Representative phase images of day 5 cultures demonstrating a typical morphology of differentiated myogenic cultures for all three stable cell lines analyzed. (B) Myogenin gene expression profile as determined by quantitative RT-PCR. ΔCt values were normalized in reference to Eef2 gene expression. Results are noted as mean ± SD, n=6. Scale bars, 100 μm.
Fig. 9
Fig. 9
βKlotho overexpressing NIH3T3 cells demonstrate enhanced adipogenic differentiation compared to control cells as determined by Oil-Red-O staining. Wildtype NIH3T3 cells and NIH3T3 cells overexpressing GFP, αKlotho-IRES-GFP, βKlotho-GFP or βKlotho-IRES-GFP, were either maintained in standard 10% FBS growth medium or switched to adipogenic induction conditions for 14 days. (A) Representative phase images of Oil-Red-O stained cultures. For all cell lines, adipogenic differentiation occurs only when cells are switched to adipogenic induction conditions and is clearly enhanced upon βKlotho overexpression. Additional high magnification images clearly demonstrate the development of mature adipocytes as detected by the presence of cells containing large multivacuolar lipid droplets stained with Oil-red-O. (B, C) Quantification of Oil-Red-O staining level after extraction of the Oil-Red-O dye within each cell culture and measure of its specific absorbance (at 510 nm wavelengths) by spectrophotometry. When maintained in 10% FBS growth medium, no significant differences in the amount of Oil-Red-O staining were detected between all the different NIH3T3 cell lines tested (p=0.34). When switched to adipogenic induction conditions, βKlotho-GFP overexpressing cells demonstrated a significant increase in lipid levels compared to wildtype (67% higher, p<0.001) and GFP overexpressing (59% higher, p=0.001) controls. Similarly, in another complementary study, NIH3T3 cells overexpressing βKlotho-IRES-GFP exhibited a significant increase in the level of Oil-Red-O staining compared to wildtype (52% higher, p<0.0001) and αKlotho-IRES-GFP overexpressing cells (79% higher, p<0.0001). Data shown in (B) and (C) are from two independent studies. Results are noted as mean ± SEM. Data were analyzed with a one-way ANOVA followed by a Bonferroni post hoc test, n=14 and n=6 for data in (B) and (C), respectively.
Fig. 10
Fig. 10
Quantitative RT-PCR analysis of expression levels of early adipogenic genes in NIH3T3 βKlotho overexpressing cells versus control lines. Wildtype NIH3T3 cells and NIH3T3 cells overexpressing GFP or βKlotho-GFP were cultured in standard 10% FBS growth medium or switched to the adipogenic induction conditions. Day 0 refers to cultures just prior to the switch and subsequent days 2, 4, 8 reflect time following the switch to the adipogenic induction conditions. (A) Ap2 and (B) Pparγ2 transcript levels were determined by quantitative RT-PCR at different time points in culture. There was no apparent difference in the level of expression between cell types. ΔCt values were normalized in reference to Eef2 gene expression. Results are noted as mean ± SD, n=6.

Similar articles

Cited by

References

    1. Montarras D, L’Honoré A, Buckingham M. Lying low but ready for action: the quiescent muscle satellite cell. FEBS J. 2013;280:4036–4050. - PubMed
    1. Yablonka-Reuveni Z. The Skeletal Muscle Satellite Cell Still Young and Fascinating at 50. J Histochem Cytochem. 2011;59:1041–1059. - PMC - PubMed
    1. Mathew SJ, Hansen JM, Merrell AJ, Murphy MM, Lawson JA, Hutcheson DA, Hansen MS, Angus-Hill M, Kardon G. Connective tissue fibroblasts and Tcf4 regulate myogenesis. Development. 2011;138:371–384. - PMC - PubMed
    1. Murphy MM, Lawson JA, Mathew SJ, Hutcheson DA, Kardon G. Satellite cells, connective tissue fibroblasts and their interactions are crucial for muscle regeneration. Development. 2011;138:3625–3637. - PMC - PubMed
    1. Joe AWB, Yi L, Natarajan A, Le Grand F, So L, Wang J, Rudnicki MA, Rossi FMV. Muscle injury activates resident fibro/adipogenic progenitors that facilitate myogenesis. Nat Cell Biol. 2010;12:153–163. - PMC - PubMed

MeSH terms

Substances