Estimating Modifying Effect of Age on Genetic and Environmental Variance Components in Twin Models
- PMID: 26868768
- PMCID: PMC4827728
- DOI: 10.1534/genetics.115.183905
Estimating Modifying Effect of Age on Genetic and Environmental Variance Components in Twin Models
Abstract
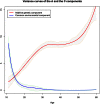
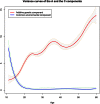
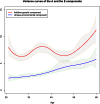
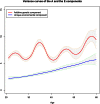
Twin studies have been adopted for decades to disentangle the relative genetic and environmental contributions for a wide range of traits. However, heritability estimation based on the classical twin models does not take into account dynamic behavior of the variance components over age. Varying variance of the genetic component over age can imply the existence of gene-environment (G×E) interactions that general genome-wide association studies (GWAS) fail to capture, which may lead to the inconsistency of heritability estimates between twin design and GWAS. Existing parametricG×Einteraction models for twin studies are limited by assuming a linear or quadratic form of the variance curves with respect to a moderator that can, however, be overly restricted in reality. Here we propose spline-based approaches to explore the variance curves of the genetic and environmental components. We choose the additive genetic, common, and unique environmental variance components (ACE) model as the starting point. We treat the component variances as variance functions with respect to age modeled by B-splines or P-splines. We develop an empirical Bayes method to estimate the variance curves together with their confidence bands and provide an R package for public use. Our simulations demonstrate that the proposed methods accurately capture dynamic behavior of the component variances in terms of mean square errors with a data set of >10,000 twin pairs. Using the proposed methods as an alternative and major extension to the classical twin models, our analyses with a large-scale Finnish twin data set (19,510 MZ twins and 27,312 DZ same-sex twins) discover that the variances of the A, C, and E components for body mass index (BMI) change substantially across life span in different patterns and the heritability of BMI drops to ∼50% after middle age. The results further indicate that the decline of heritability is due to increasing unique environmental variance, which provides more insights into age-specific heritability of BMI and evidence ofG×Einteractions. These findings highlight the fundamental importance and implication of the proposed models in facilitating twin studies to investigate the heritability specific to age and other modifying factors.
Keywords: age-specific heritability; body mass index; empirical Bayes predictor; penalized B-splines; twin models.
Copyright © 2016 by the Genetics Society of America.
Figures


Similar articles
-
ACEt: An R Package for Estimating Dynamic Heritability and Comparing Twin Models.Behav Genet. 2017 Nov;47(6):620-641. doi: 10.1007/s10519-017-9866-y. Epub 2017 Sep 6. Behav Genet. 2017. PMID: 28879484
-
The Augmented Classical Twin Design: Incorporating Genome-Wide Identity by Descent Sharing Into Twin Studies in Order to Model Violations of the Equal Environments Assumption.Behav Genet. 2021 May;51(3):223-236. doi: 10.1007/s10519-021-10044-0. Epub 2021 Feb 13. Behav Genet. 2021. PMID: 33582897
-
Genetic and environmental contributions to body mass index: comparative analysis of monozygotic twins, dizygotic twins and same-age unrelated siblings.Int J Obes (Lond). 2009 Jan;33(1):37-41. doi: 10.1038/ijo.2008.228. Epub 2008 Nov 25. Int J Obes (Lond). 2009. PMID: 19030007 Free PMC article.
-
Genetic and environmental etiology of the relationship between childhood hyperactivity/inattention and conduct problems in a South Korean twin sample.Twin Res Hum Genet. 2015 Jun;18(3):290-7. doi: 10.1017/thg.2015.26. Epub 2015 Apr 30. Twin Res Hum Genet. 2015. PMID: 25926162 Review.
-
Twin studies to GWAS: there and back again.Trends Cogn Sci. 2021 Oct;25(10):855-869. doi: 10.1016/j.tics.2021.06.007. Epub 2021 Jul 24. Trends Cogn Sci. 2021. PMID: 34312064 Free PMC article. Review.
Cited by
-
Differences in genetic and environmental variation in adult BMI by sex, age, time period, and region: an individual-based pooled analysis of 40 twin cohorts.Am J Clin Nutr. 2017 Aug;106(2):457-466. doi: 10.3945/ajcn.117.153643. Epub 2017 Jul 5. Am J Clin Nutr. 2017. PMID: 28679550 Free PMC article.
-
A genetic stochastic process model for genome-wide joint analysis of biomarker dynamics and disease susceptibility with longitudinal data.Genet Epidemiol. 2017 Nov;41(7):620-635. doi: 10.1002/gepi.22058. Epub 2017 Jun 21. Genet Epidemiol. 2017. PMID: 28636232 Free PMC article.
-
Causal Effects of Body Mass Index on Airflow Obstruction and Forced Mid-Expiratory Flow: A Mendelian Randomization Study Taking Interactions and Age-Specific Instruments Into Consideration Toward a Life Course Perspective.Front Public Health. 2021 May 11;9:584955. doi: 10.3389/fpubh.2021.584955. eCollection 2021. Front Public Health. 2021. PMID: 34046380 Free PMC article.
-
The intergenerational transmission of suicidal behavior: an offspring of siblings study.Transl Psychiatry. 2020 May 30;10(1):173. doi: 10.1038/s41398-020-0850-6. Transl Psychiatry. 2020. PMID: 32474571 Free PMC article.
-
Identification of Age-Specific and Common Key Regulatory Mechanisms Governing Eggshell Strength in Chicken Using Random Forests.Genes (Basel). 2020 Apr 24;11(4):464. doi: 10.3390/genes11040464. Genes (Basel). 2020. PMID: 32344666 Free PMC article.
References
-
- Akaike H., 1969. Fitting autoregressive models for prediction. Ann. Inst. Stat. Math. 21: 243–247.
-
- Atchley W. R., Rutledge J. J., 1980. Genetic components of size and shape. I. Dynamics of components of phenotypic variability and covariability during ontogeny in the laboratory rat. Evolution 34: 1161–1173. - PubMed
-
- Boomsma D. I., Martin N. G., Molenaar P. C., 1989. Factor and simplex models for repeated measures: application to two psychomotor measures of alcohol sensitivity in twins. Behav. Genet. 19: 79–96. - PubMed
-
- Booth J. G., Hobert J. P., 1998. Standard errors of prediction in generalized linear mixed models. J. Am. Stat. Assoc. 93: 262–272.
Publication types
MeSH terms
Grants and funding
LinkOut - more resources
Full Text Sources
Other Literature Sources
Medical
Miscellaneous

