Review
. 2016 Feb 10;80(1):205-327.
doi: 10.1128/MMBR.00040-15. Print 2016 Mar.

The Genomes of Three Uneven Siblings: Footprints of the Lifestyles of Three Trichoderma Species

Affiliations
Review

The Genomes of Three Uneven Siblings: Footprints of the Lifestyles of Three Trichoderma Species

Monika Schmoll et al. Microbiol Mol Biol Rev. .

Abstract

The genus Trichoderma contains fungi with high relevance for humans, with applications in enzyme production for plant cell wall degradation and use in biocontrol. Here, we provide a broad, comprehensive overview of the genomic content of these species for "hot topic" research aspects, including CAZymes, transport, transcription factors, and development, along with a detailed analysis and annotation of less-studied topics, such as signal transduction, genome integrity, chromatin, photobiology, or lipid, sulfur, and nitrogen metabolism in T. reesei, T. atroviride, and T. virens, and we open up new perspectives to those topics discussed previously. In total, we covered more than 2,000 of the predicted 9,000 to 11,000 genes of each Trichoderma species discussed, which is >20% of the respective gene content. Additionally, we considered available transcriptome data for the annotated genes. Highlights of our analyses include overall carbohydrate cleavage preferences due to the different genomic contents and regulation of the respective genes. We found light regulation of many sulfur metabolic genes. Additionally, a new Golgi 1,2-mannosidase likely involved in N-linked glycosylation was detected, as were indications for the ability of Trichoderma spp. to generate hybrid galactose-containing N-linked glycans. The genomic inventory of effector proteins revealed numerous compounds unique to Trichoderma, and these warrant further investigation. We found interesting expansions in the Trichoderma genus in several signaling pathways, such as G-protein-coupled receptors, RAS GTPases, and casein kinases. A particularly interesting feature absolutely unique to T. atroviride is the duplication of the alternative sulfur amino acid synthesis pathway.


Figures

FIG 1
FIG 1
Comparison of Ada and Ogt/MGMT proteins with their homologs in Trichoderma spp. The protein sequences were analyzed using the SMART server to identify domains conserved in proteins of Trichoderma spp. and to compare functional domains among them. Colors show conserved domains, such as the Ada Zn binding and HTH AraC domains, which comprise the N terminal (N-ada20), and the MT-N1 and DNA binding domains, which comprise the C terminal (C-ada19) of the Ada protein from E. coli. Ta, T. atroviride; Tr, T. reesei; Tv, T. virens.
FIG 2
FIG 2
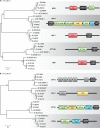
Schematic representation of different histone chaperones (HCs) found in Trichoderma spp. The HCs found in Trichoderma spp. are divided into two classes. (A) HC class I consists of HCs involved in binding, transport, or transfer. (B) HC class II consists of HCs capable of interacting with subunits of histone chaperones. The phylogenetic trees were constructed using the unrooted neighbor-joining method with the application of bootstrapping based on a multiple alignment of HC predicted protein sequences from T. virens, T. atroviride, and T. reesei genomes. N. crassa and G. zeae were used as outgroups. Phylogenetic and molecular evolutionary analyses were conducted using MEGA version 4. Domain abbreviations: WD, structural motif with tryptophan (W) and aspartic acid (D); S1, RNA binding domain, peptidase; M24, metallopeptidase; SSRP1, specific structure recognition protein 1; HIRA B, histone regulatory homolog A binding; FACT-spt16 Nlob, Fact complex subunit spt16 N-terminal lobe domain; SPT6_acidic, acidic N-terminal SPT6; HTH_44, helix-turn-helix DNA binding domain of SPT6; YqgF, Holliday junction resolvase-like of SPT6; DLD, Death-like domain of SPT6; S1, S1 RNA binding domain; SH2, Src homology 2. All conserved domains in HCs were determined using Pfam (http://pfam.xfam.org/search) and SMART (http://smart.embl-heidelberg.de/).
FIG 3
FIG 3
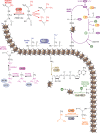
Histone-modifying enzymes. Histones can be modified in different ways to regulate gene expression and other DNA-templated processes, or to maintain genome integrity. Several distinct classes of enzymes can modify histones at multiple sites, catalyzing the addition or removal of an array of covalent modifications. The covalent modifications include acetylation/deacetylation, methylation/demethylation, phosphorylation, ADP-ribosylation, ubiquitylation, and SUMOylation. HATs catalyze the transfer of acetyl groups from acetyl-CoA to defined lysine residues of histones H3 and H4. Acetylation is a reversible process that depends on HDACs, some of which are NAD+ dependent (see the text). Methylation involves the transfer of a methyl group from S-adenosyl-l-methionine (AdoMet) to lysine and arginine of histones H3 and H4 mainly. Each lysine residue can be mono-, di-, or trimethylated by members of the SET domain-containing histone lysine methyltransferase (HKMT) family. Dot1 is another HMKT lacking the SET domain, which has a putative role in telomeric silencing. Arginine residues of histones H3 and H4 are methylated by members of the protein arginine methyltransferase (PRMT) family. Arginine can be mono- or dimethylated, the latter in a symmetric or an asymmetric way. Histone demethylation could be catalyzed by LSD1 or JmjC domain-containing histone demethylases (JHDMs). LSD1 can only remove mono- and dimethyl lysine modifications, whereas JHDMs can remove all three histone lysine methylation states. Arginine demethylation occurs as a deimination process, which may not play a role in fungi due the lack of homologous enzymes. However, the JHDM-1-like protein of Trichoderma spp. shares similarities to JMJD6 of mammals, the only arginine demethylase described so far. Serines of histone H3 are phosphorylated by members of the Aurora protein kinase family. In the ADP-ribosylation enzymatic reaction, NAD+ is cleaved into nicotinamide and ADP-ribose, with the latter attached to lysine of histones by action of PARP. The SUMOylation occurs at lysines that are frequently close to a hydrophobic residue (Φ) and to a negatively charged environment (E). SUMO is synthesized as a precursor protein that is C-terminally processed. Subsequently, the conjugation to proteins involves the E1 enzyme (AOS1/UBA2) and the E2-conjugating enzyme (Ubc9), that form thioesters (—S—) with the modifier. E3 ligase stimulates the attachment to specific lysine residues of histones. The removal of SUMO is catalyzed by the SUSP/SENP isopeptidase family. Addition of ubiquitin (Ub) in lysines of H2A, H2B, and H3 occurs by a mechanism similar to SUMOylation. In this process, Rad6 is the E2 ubiquitin conjugase and BRE1 is the E3 ligase.
FIG 4
FIG 4
Distribution of CAZymes with cleavage preferences for α- and β-glycosidic linkages in carbohydrates (A) and poly- and oligosaccharide degradation (B) between T. atroviride, T. virens, and T. reesei.
FIG 5
FIG 5
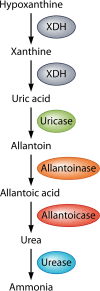
Purine catabolic pathway in fungi. The xanthine dehydrogenase XDH (TR_78797, TA_141294, and TV_40214) is the major enzyme oxidizing hypoxanthine to xanthine and xanthine to uric acid. Subsequently, uricase (TR_76381, TA_145570, and TV_78632) catalyzes the enzymatic oxidation of uric acid into allantoin, and allantoinase (TR_123795, TA_300514, and TV_89297) catalyzes the hydrolysis of allantoin into allantoic acid. The enzyme allantoicase (TR_78010, TA_148414, and TV_214821) breaks down allantoic acid into urea, and finally the urease (TR_76381, TA_145570, and TV_78632) converts urea into ammonia.
FIG 6
FIG 6
Glutamine assimilation and glutamine as nitrogen donor in N. crassa. (A) Glutamine is transaminated via glutamine transaminase (T-Gln; TR_106250, TA_84459, and TV_79678), and subsequently the 2-oxoglutarate produced is hydrolyzed to 2-oxoglutarate and ammonium through the participation of a ω-amidase (TR_104803, TA_29974, and TV_40527). (B) Thereafter, the NADP-glutamate dehydrogenase (NADP-GDH; TR_73536, TA_297025, and TV_73234) synthesizes glutamate via reductive amination. (C) Finally, the synthesis of glutamine is carried out by a glutamine synthetase (GS; TR_122287, TA_141213, and TV_87581), which incorporates ammonium into the γ-carboxyl of glutamate after being activated by ATP. (D) The final step completes the glutamine-glutamate cycling. As a result of this cycle, glutamine and glutamate are continually resynthesized, but glutamate can also be synthesized in a reaction catalyzed by glutamate synthase (GOGAT; TR_122287, TA_141213, and TV_87581). (E) Schematic representation of glutamine-glutamate cycling in N. crassa. 2-Oxoglutarate can be interconverted into ammonium (NH4+) by the ω-amidase, glutamate by the GOGAT, and GDH, whereas ammonia can be converted into glutamate through two pathways. It may be coupled directly to 2-ketoglutarate to form glutamate by GDH in the presence of NADPH. Furthermore, NH4+ is also incorporated into glutamine via GS in the presence of ATP. Glutamine and 2-ketoglutarate are converted to glutamate through GOGAT in the presence of NADH. In addition, glutamate is degraded to 2-ketoglutarate and ammonia by GDH in the presence of NAD. All the glutamine-glutamate cycling enzyme-encoding genes were found in the Trichoderma spp.
FIG 7
FIG 7
Sulfur metabolism in filamentous fungi. Putative Trichoderma spp. enzymes (also indicated by EC designation in the figure) and their gene ID numbers are as follows. For assimilation of sulfate and other sulfur sources pathway (S): sulfate permease (EC 2A.53.1.2; TR_79741, TR_57088, TR_62285, TA_45766, TA_148686, TA_41966, TV_158532, TV_59747, and TV_193580); arylsulfatase (EC 3.1.6.1; TR_61121, TA_37606, and TV_190530); choline sulfatase (EC 3.1.6.7; TR_78320, TA_140398, and TV_69180), sulfate adenylyltransferase (EC 2.7.7.4; TR_47066, TA_300938, and TV_83979); adenylylsulfate kinase (EC 2.7.1.25; TR_75704, TA_82974, and TV_210664); 3-phosphoadenosine-5-phosphosulfate (PAPS) reductase (EC 1.8.4.8; TR_65410, TA_299393, and TV_216652); sulfite reductase, alpha, beta chain (EC 1.8.1.2; TR_81576, TR_45138, TA_223153, TA_128510, TV_82368, and TV_87662); methionine permease (EC 2A.3.8.4; TR_60144, TR_54865, TR_110316, TR_68831, TA_31104, TA_297834, TA_217038, TA_293457, TV_47944, TV_177947, TV_183616, and TV_200088); taurine dioxygenase (EC 1.13.11.20; TR_112567, TR_69529, TR_103012, TR_30776, TR_123979, TA_186979, TA_132655, TA_152183, TA_49608, TA_184293, TA_139690, TV_39626, TV_232090, TV_153908, TV_189583, TV_17533, and TV_77829); cysteine dioxygenase (EC 1.13.11.20; TR_120176, TA_258544, and TV_28127); sulfite oxidase (EC 1.8.3.1; TR_106695, TR_76601, TR_62367, TA_146350, TA_313009, TV_231246, TV_215055, and TV_213747). Cysteine biosynthesis pathway (C): serine O-acetyltransferase (EC 2.3.1.30; TR_66517, TA_45036, and TV_214328); cysteine synthase (EC 2.5.1.47; TR_76018, TA_147947, and TV_40598). Methionine biosynthesis pathway (M): cystathionine gamma-synthase (EC 2.5.1.48; TR_3641, TA_137525, and TV_37054); cystathionine beta-lyase (EC 4.4.1.8; TR_82547, TA_298488, and TV_90179); methionine synthase (EC 2.1.1.14; TR_121820, TA_136004, and TV_87179). Alternative sulfur amino acids pathway (A): homoserine O-acetyltransferase (EC 2.3.1.31; TR_123633, TA_299508, TA_260926, and TV_50363); O-acetyl-l-homoserine sulfhydrylase (EC 2.5.1.49; TR_122301, TA_195487, TA_93352, and TV_74905). Reverse transsulfuration pathway (R): S-adenosylmethionine synthetase (EC 2.5.1.6; TR_46238, TA_301763, and TV_87758); various methyltransferases (EC 2.1.1.-); SAH lyase (EC 3.3.1.1; TR_110171, TA_129664, and TV_82877); cystathionine beta-synthase (EC 4.2.1.22; TR_81089, TA_134949, and TV_81462); cystathionine gamma-lyase (EC 4.4.1.1; TR_63919, TA_299967, and TV_176825). CH3-folate metabolism (F): glycine/serine hydroxymethyltransferase (EC 2.1.2.1; TR_65295, TR_121686, TA_301356, TA_300337, TV_190230, and TV_111115); methylenetetrahydrofolate reductase (EC 1.5.1.20; TR_81824, TR_55055, TA_93509, TA_33767, TV_229117, and TV_90038); folyl polyglutamate synthase (EC 6.3.2.17; TR_ 64029, TR_ 28050, TA_ 167387, TA_ 252788, TV_ 15479, and TV_ 81938).
FIG 8
FIG 8
Sulfur metabolite repression system in fungi. The SCF ubiquitin ligase complex consists of several core components: the adaptor protein Skp1 (TR_73823, TA_146592, and TV_215651), scaffold protein cullin (TR_55706, TR_2707, TR_82651, TR_5148, TA_130811, TA_289394, TA_30100, TA_41324, TV_170804, TV_160722, TV_37896, and TV_43883), an F-box protein (TR_77795, TA_29353, and TV_56502), the RING finger protein Rbx1 (TR_121950, TA_297990, and TV_216834), and the ubiquitin-conjugating enzyme E2. The interchangeable F-box proteins determine the complex specificity. Identified F-box proteins involved in sulfur metabolism include S. cerevisiae Met30p, N. crassa SCON-2, and A. nidulans SconB, targeting ubiquitination of the bZIP protein at high concentration of cysteine. The red circle with a minus sign is a low-molecular-weight effector of the SCF complex. The ubiquitinated bZIP activator (in Trichoderma spp., TR_119759, TA_297702, TV_119501, and TV_180261) is directed to degradation by the 26S proteasome or inactivated.
FIG 9
FIG 9
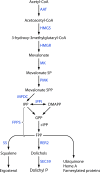
Schematic representation of the mevalonate pathway Abbreviations of enzymes shown in the scheme are as follows: AAT (acetoacetyl-CoA thiolase; EC 2.3.1.9; TR_79439, TA_303080, TV_72521, TR_120079, TA_149280, and TV_169943); HMGS (hydroxymethylglutaryl-CoA synthase; EC 2.3.3.10; TR_75589, TA_130709, and TV_70450); HMGR (hydroxymethylglutaryl-CoA reductase; EC 1.1.1.34; TR_71380, TA_143946, and TV_71643); MK (mevalonate kinase; EC 2.7.1.36; TR_121374, TA_295691, and TV_142066), PMK (phosphomevalonate kinase; EC 2.7.4.2; TR_74711, TA_34690, and TV_28802); MPDC (diphosphomevalonate decarboxylase; EC 4.1.1.33; TR_22798, TA_81597, and TV_47159); IPPI (isopentenyl diphosphate delta-isomerase; EC 5.3.3.2; TR_120106, TA_301103, and TV_84157); FPPS (farnesyl diphosphate synthase; EC 2.5.1.10; TR_49399, TA_134836, and TV_166777); RER2 (cis-prenyltransferase; EC 2.5.1.20; TR_21534, TA_299001, and TV_65319); SEC59 (dolichol kinase; EC 2.7.1.108; TR_121295, TA_287169, and TV_36104); SS (squalene synthase; EC 2.5.1.21; TR_122653, TA_303098, and TV_81989). IPP, isopentenyl diphosphate; DMAPP, dimethylallyl diphosphate; GPP, geranyl diphosphate; FPP, farnesyl diphosphate.
FIG 10
FIG 10
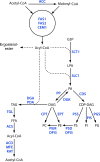
Schematic representation of lipid metabolism. Abbreviations of metabolites and enzymes (in blue) shown in the scheme are as follows: ACC, acetyl-CoA carboxylase; TR_81110, TA_147404, and TV_78374); FAS1 (fatty acid synthase alpha; TR_48788, TA_85662, and TV_48659); FAS2 (fatty acid synthase beta; TR_78591, TA_226146, and TV_171412); CEM1 (beta-keto-acyl synthase; TR_120712, TA_32217, and TV_82746); SCT1 (glycerol-3-phosphate 1-O-acyltransferase; TR_109086, TA_127885, and TV_190817); SLC1 (1-acyl-sn-glycerol-3-phosphate acyltransferase; TR_107258, TA_130298, TA_30732, TV_56309, and TV_41116); PP (phosphatidate phosphatase; TR_79560, TA_89543, and TV_143439); DGK (diacylglycerol kinase; TR_77915, TA_295259, and TV_217264); DGA (diacylglycerol acyltransferase; TR_120566, TA_157028, and TV_216961); ARE (acyl-CoA:sterol acyltransferase; TR_50607, TR_61705, TA_213158, TA_301974, TV_58320, and TV_87128); PDA (phospholipid:diacylglycerol acyltransferase; TR_121546, TA_244255, and TV_37216); CDS (CDP-diacylglycerol synthase; TR_51806, TA_39363, and TV_33697); PSS (phosphatidylserine synthase; TR_121550, TA_150107, and TV_36484); PIS (phosphatidylinositol synthase; TR_74023, TA_297712, and TV_71870); PGS (phosphatidyl glycerol phosphate synthase; TR_3600, TA_28801, and TV_213484); PSD (phosphatidylserine decarboxylase; TR_110040, TR_80958, TA_156864, TA_151310, TV_196625, and TV_77855); PEM (phosphatidylethanolamine methyltransferase; TR_44868, TA_285860, and TV_71510); OPI3 (methylene-fatty-acyl-phospholipid synthase; TR_49864, TA_300563, and TV_45525); CPT (cholinephosphotransferase; TR_55627, TA_300979, and TV_71348); EPT (sn-1,2-diacylglycerol ethanolamine- and cholinephosphotranferase; TR_122644, TA_303084, and TV_32034); TGL (triacylglycerol lipase; TR_80191, TR_67507, TR_71259, TR_122091, TR_107263, TA_193414, TA_221800, TA_281797, TA_172817, TA_30218, TV_133319, TV_59787, TV_30485, TV_49387, and TV_74421). ACS, acyl-CoA synthetase; ACD, acyl-CoA dehydrogenase; MFE, 3-hydroxyacyl-CoA dehydrogenase and enoyl-CoA hydratase (TR_2392, TA_33165, and TV_70294); KAT, 3-ketoacyl-CoA thiolase; G3P, glycerol-3-phosphate; LPA, 1-acyl-sn-glycerol-3-phosphate; PA, phosphatidic acid; DAG, diacylglycerol; PG, phosphatidylglycerol; PI, phosphatidylinositol; PS, phosphatidylserine; PE, phosphatidylethanolamine; PC, phosphatidylcholine; TAG, triacylglycerol; FFA, free fatty acid.
FIG 11
FIG 11
Representation of the putative pathways involved in the elaboration of N-linked glycans (A) and O-linked glycans (B) in Trichoderma. (Step 1) The elaboration of N-linked glycans begins in the ER with the synthesis of the oligosaccharide Glc3Man9GlcNAC2 attached to dolichol. (Step 2) Then, this oligosaccharide is transferred to the nascent proteins by the oligosaccharyl transferase complex (OST) and is processed by the ER glucosidades (TR_121351, TA_77708, and TV_86135) and α-1,2-mannosidase (TR_2662, TA_234256, and TV_82921), generating Man8GlcNAC2 (Step 3). Proteins that are expected to form part of OST are TR_119600, TR_33342, TR_45732, TR_120807, TR_64600, and TR_80584 in T. reesei; TA_298272, TA_148232, TA_301378, TA_148028, TA_155537, and TA_298708 in T. atroviride; TV_79118, TV_121404, TV_111960, TV_75107, TV_85177, and TV_88481 in T. virens. (Step 4) Next, the glycoproteins are transported to the Golgi complex, where the N-linked glycan undergoes further processing by Golgi complex mannosidases IA, IB, and IC (TR_22252, TR_79044, and TR_79960; TA_284729, TA_161121, and TA_40546; TV_112062, TV_86342, and TV_157800), generating Man5GlcNAC2. (Step 5) Proteins with significant similarity to the Golgi complex mannosidases. Finally, this structure is utilized as molecular scaffold by mannosyltransferases and galactosyltransferases to synthesize the N-linked glycan outer chain. Putative proteins participating in this step are TR_65646, TR_4561, TR_80340, TR_46443, TR_58609, TR_81211, TR_82551, TR_105557, TR_79832, TR_109361, TR_21576, TR_69868, TR_69211, TR_46421, TR_66687, and TR_48178 in T. reesei; TA_41037, TA_132346, TA_133591, TA_132601, TA_30858, TA_143140, TA_132930, TA_301583, TA_46185, TA_81367, TA_297159, TA_38402, TA_83451, TA_240794, TA_291006, and TA_301560 in T. atroviride; TV_66986, TV_32495, TV_89619, TV_231261, TV_87298, TV_82029, TV_83396, TV_184845, TV_77126, TV_31851, TV_76470, TV_33900, TV_73292, TV_83426, TV_183497, and TV_111228 in T. virens. The elaboration of O-linked glycans starts in the ER, where members of the PMT family transfer a mannose unit to Ser/Thr residues. Then, glycoproteins are exported to the Golgi complex, where mannosyltransferases elongate the O-linked glycan. It is likely that the O-linked glycans are also decorated with galactose units.
FIG 12
FIG 12
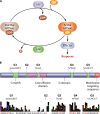
The small GTPase regulatory cycle and structure. (A) RAS- related GTPases cycle between an active (GTP-bound) and inactive (GDP-bound) state. The intrinsic GTPase activity of Ras-related GTPases is stimulated by specific GTPAse activation proteins (GAPs), which accelerate the inactivation of their regulatory activity. GEFs activate the small GTPases, which consecutively interact with specific effectors to mediate downstream pathways. (B) These small GTPases have conserved signature domains. All the Trichoderma spp. small GTPases were aligned using Clustal W with default parameters in Jalview, and the conserved domains were exported.
FIG 13
FIG 13
Evolutionary relationships of small GTPases from fungi. The evolutionary history was inferred using the neighbor-joining method. The optimal tree with a sum of branch length of 33.40865216 is shown. The evolutionary distances were computed using the Poisson correction method and are in the units of the number of amino acid substitutions per site. The analysis involved 195 amino acid sequences. All ambiguous positions were removed for each sequence pair. There were a total of 1,079 positions in the final data set. Evolutionary analyses were conducted using MEGA5. GenBank/EMBL/DDBJ database accession numbers are indicated after the name of each protein in the tree. The protein ID numbers from Trichoderma spp. shown in the figure were from the DOE Joint Genome Institute database along with the prefix for the species: TR, T. reesei; TV, T. virens; TA, T. atroviride.
FIG 14
FIG 14
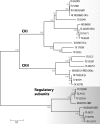
Phylogenetic analysis of casein kinase I and II homologs of T. atroviride (TA), T. virens (TV), and T. reesei (TR), along with N. crassa (NCU). Sequences were aligned using Clustal X, and phylogenetic analysis was performed with MEGA4 using the minimum evolution algorithm with 500 bootstrap cycles.
FIG 15
FIG 15
Classification of protein phosphatases based on substrate specificity and structure. The numbers indicate the numbers of genes encoding protein phosphatases in the following order: T. reesei/T. virens/T. atroviride. In this classification only the phosphatase catalytic subunits/units are included. PP, protein phosphatase; PTP, protein tyrosine phosphatase; Ser/Thr, serine-threonine; FCP/SCP TFIIF-associating component of RNA polymerase II CTD phosphatase/small CTD phosphatase; HAD, haloacid dehalogenase; PPM, protein phosphatase M sequence family; PPP, protein phosphatase P sequence family; LMW-PTP, low-molecular-weight protein tyrosine phosphatases.
FIG 16
FIG 16
Schematic representation of calcium signaling. The homeostasis of the calcium level in the cytoplasm is maintained by calcium-permeable channels, transporters, and ATPases. Calcium is required by a large number of proteins, which in turn regulate, among other things, asexual and sexual development, the circadian clock, xylanases and cellulases, and protein folding.
FIG 17
FIG 17
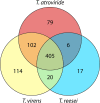
Distribution of transcription factor orthologs of T. atroviride, T. virens, and T. reesei. The Venn diagram shows the distribution found for the three species. The analysis was done using the distribution of orthologs described in reference .
FIG 18
FIG 18
Morphological stages of T. atroviride during conidiation after mechanical injury. (A) Stage 0, sealed damage hypha; (B) stage 1, growth of a new hypha from the damaged hypha; (C) stage 2, hyphal branching; (D) stage 3, phialide formation; (E) stage 4, immature conidia emergence; (F) stage 5, conidiophores (15). (The figure was designed by E. B. Beltrán-Hernández.)
FIG 19
FIG 19
Secretion of effector-like proteins during plant-Trichoderma interactions. Trichoderma spp. constitutively secrete proteins which are detected by plant cells (e.g., Sm1). These proteins are called microbe-associated molecular patterns (MAMPs). Together with the release of plant cell material (called damage-associated molecular patterns [DAMPs]) by the action of plant cell wall-degrading enzymes (PCWDE) secreted by Trichoderma, they activate the plant immune system. Plant cells release antifungal compounds, including toxins and fungal cell wall-degrading enzymes (FCWDE). The chitin released by the action of FCWDE is recognized by a specific receptor from the plant cell and activates immune responses, including the activation of MAPK and phosphorylation (red circles) of TFs, which regulate different defense responses (including the expression of pathogenesis-related proteins [PRs], toxins, and FCWDE). Trichoderma spp. also secrete proteins that are inducible during plant interaction. These proteins, here called effector-like proteins, are secreted through the type 2 secretion system. The roles of secreted proteins by Trichoderma during their interaction with plant roots may be to assist the fungus to evade, manipulate, and ultimately avoid the plant immune system. These proteins can act in the apoplast (Apo) or in the cytoplasm (Cyto). An effector might have different targets, including the scavenging of ROS, inhibition of FCWDEs and toxins in the apoplastic space, or MAPKs, TFs, or NADPH oxidases in the cytoplasm. Cytoplasmatic effector-like proteins may be translocated inside the plant cell by an unknown transporter or mechanism.
FIG 20
FIG 20
Diagrammatic outline of the process used to detect and analyze putative small secreted proteins. The initial proteome for T. atroviride, T. reesei, and T. virens was obtained from the JGI Genome database. This data set was examined with SignalP4 to detect signal peptide regions. Protein models containing secretion signals were then analyzed to detect transmembrane domains and cellular retention signals, using TMHMM and Protcomp. The predicted secretome was then analyzed for functional groups, domains, motifs, and homology to known lytic enzymes (Blast2GO, MEME, CAZy, Interpro). Tandem repeat analysis was performed with XSTREAM, and orthologs of secreted proteins in the main data set were identified. Cysteine richness and the size distribution of the secretome were analyzed using custom-designed R scripts.

Similar articles

Cited by

References

    1. Gupta VK, Schmoll M, Herrera-Estrella A, Upadhyay RS, Druzhinina I, Tuohy MG. 2014. Biotechnology and biology of Trichoderma. Elsevier, Oxford, United Kingdom.
    1. Mukherjee PK, Horwitz BA, Herrera-Estrella A, Schmoll M, Kenerley CM. 2013. Trichoderma research in the genome era. Annu Rev Phytopathol 51:105–129. doi:10.1146/annurev-phyto-082712-102353. - DOI - PubMed
    1. Mukherjee PK, Horwitz BA, Singh US, Mukherjee M, Schmoll M. 2013. Trichoderma: biology and applications. CAB International, Oxfordshire, United Kingdom.
    1. Kubicek CP, Herrera-Estrella A, Seidl-Seiboth V, Martinez DA, Druzhinina IS, Thon M, Zeilinger S, Casas-Flores S, Horwitz BA, Mukherjee PK, Mukherjee M, Kredics L, Alcaraz LD, Aerts A, Antal Z, Atanasova L, Cervantes-Badillo MG, Challacombe J, Chertkov O, McCluskey K, Coulpier F, Deshpande N, von Dohren H, Ebbole DJ, Esquivel-Naranjo EU, Fekete E, Flipphi M, Glaser F, Gomez-Rodriguez EY, Gruber S, Han C, Henrissat B, Hermosa R, Hernandez-Onate M, Karaffa L, Kosti I, Le Crom S, Lindquist E, Lucas S, Lubeck M, Lubeck PS, Margeot A, Metz B, Misra M, Nevalainen H, Omann M, Packer N, Perrone G, Uresti-Rivera EE, Salamov A, Schmoll M, Seiboth B, Shapiro H, Sukno S, Tamayo-Ramos JA, Tisch D, Wiest A, Wilkinson HH, Zhang M, Coutinho PM, Kenerley CM, Monte E, Baker SE, Grigoriev IV. 2011. Comparative genome sequence analysis underscores mycoparasitism as the ancestral life style of Trichoderma. Genome Biol 12:R40. doi:10.1186/gb-2011-12-4-r40. - DOI - PMC - PubMed
    1. Schmoll M, Seiboth B, Druzhinina I, Kubicek CP. 2014. Genomics analysis of biocontrol species and industrial enzyme producers from the genus Trichoderma, p 233–266. In Esser K, Nowrousian M (ed), The Mycota XIII. Springer, Berlin, Germany.

Publication types

MeSH terms

LinkOut - more resources