. 2016 Apr 29;291(18):9540-53.
doi: 10.1074/jbc.M115.692368. Epub 2016 Feb 9.

Reduced Ets Domain-containing Protein Elk1 Promotes Pulmonary Fibrosis via Increased Integrin αvβ6 Expression

Affiliations

Reduced Ets Domain-containing Protein Elk1 Promotes Pulmonary Fibrosis via Increased Integrin αvβ6 Expression

Amanda L Tatler et al. J Biol Chem. .

Abstract

Idiopathic pulmonary fibrosis (IPF) is a progressive fibrotic lung disease with high mortality. Active TGFβ1 is considered central to the pathogenesis of IPF. A major mechanism of TGFβ1 activation in the lung involves the epithelially restricted αvβ6 integrin. Expression of the αvβ6 integrin is dramatically increased in IPF. How αvβ6 integrin expression is regulated in the pulmonary epithelium is unknown. Here we identify a region in the β6 subunit gene (ITGB6) promoter acting to markedly repress basal gene transcription, which responds to both the Ets domain-containing protein Elk1 (Elk1) and the glucocorticoid receptor (GR). Both Elk1 and GR can regulate αvβ6 integrin expression in vitro We demonstrate Elk1 binding to the ITGB6 promoter basally and that manipulation of Elk1 or Elk1 binding alters ITGB6 promoter activity, gene transcription, and αvβ6 integrin expression. Crucially, we find that loss of Elk1 causes enhanced Itgb6 expression and exaggerated lung fibrosis in an in vivo model of fibrosis, whereas the GR agonist dexamethasone inhibits Itgb6 expression. Moreover, Elk1 dysregulation is present in epithelium from patients with IPF. These data reveal a novel role for Elk1 regulating ITGB6 expression and highlight how dysregulation of Elk1 can contribute to human disease.

Keywords: elk1; fibrosis; gene regulation; integrin; lung; pulmonary fibrosis.


Figures

FIGURE 1.
FIGURE 1.
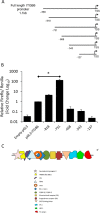
The ITGB6 gene promoter contains a large repressor region. A, schematic demonstrating the series of deletion mutants of the full-length pGL3-ITGB6 promoter luciferase reporter construct. TSS, transcription start site. B, iHBECs were transfected with the either empty pGL3 vector, full-length ITGB6 promoter reporter, or a series of ITGB6 promoter deletion mutants. After 4 h, luciferase activity was measured to determine promoter activity. Data are expressed as mean ± S.E. relative to the firefly/Renilla ratio from three independent experiments. *, p < 0.05. C, in silico analysis revealed the presence of several transcription factor binding sites between −818 and −731 from the transcription start site. This schematic shows these transcription factor binding sites.
FIGURE 2.
FIGURE 2.
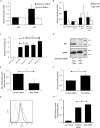
αvβ6 is repressed by Elk1 binding to the ITGB6 promoter at −772 and −752. A, basal binding of Elk1 to the repressor region of the endogenous ITGB6 promoter (−934 to −753) and a control region (−1604 to −1497) was assessed by ChIP in iHBECs. Binding of Elk1 above IgG binding levels was detected at the repressor region but not at the control region. Data are expressed as mean ± S.E. relative binding (relative to IgG) from three independent experiments. B, SDM of Elk1 sites located at either −772, −752, or both was performed. H647 cells were transfected with either non-mutated pGL3-ITGB6 reporter or either of the mutated constructs for 24 h. ChIP was performed for endogenous Elk1. Relative binding above IgG was calculated relative to the full-length, non-mutated promoter construct. Shown is mean relative binding ± S.E. from three independent experiments. C, SDM of Elk1 sites located at either −772, −752, or both was performed. iHBECs were transfected with these constructs, and luciferase activity was measured. Data are expressed as mean relative firefly/Renilla ratio ± S.E. from three independent experiments. *, p < 0.05. D, iHBECs were transfected with Elk1 or control siRNA, and Elk1 expression was measured by Western blotting. The figure is representative of three independent experiments. The ratio of Elk1:GAPDH as calculated by densitometry is shown beneath the bands. E, iHBECs were transfected with Elk1 or control siRNA, and ELK1 mRNA was assessed. Data are expressed as mean ELK1 expression ± S.E. from two independent experiments. *, p < 0.05. F, iHBECs were cotransfected with Elk1 or control siRNA with the full-length ITGB6 promoter reporter. Data are expressed as mean relative firefly/Renilla ± S.E. from three independent experiments. *, p < 0.05. G, iHBECs were transfected with either control siRNA or Elk1 siRNA, and αvβ6 expression was assessed after 2 days. Gray line, negative control (-ve); black solid line, control siRNA; dotted line, Elk1 siRNA. The histogram is representative of three independent experiments. H, amalgamated data from the experiments shown in G expressed as -fold change MFI. *, p < 0.05.
FIGURE 3.
FIGURE 3.
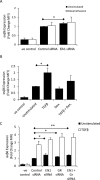
The glucocorticoid receptor, but not the progesterone receptor, represses αvβ6. A, iHBECs transfected with the ITGB6 promoter reporter (black columns) or an empty vector control (white columns) were stimulated with 2 ng/ml TGFβ1, 10 μm dexamethasone (Dex), or TGFβ1 and dexamethasone together. Data are expressed as mean relative firefly/Renilla ratio ± S.E. from three independent experiments. *, p < 0.05. B, SAECs were stimulated with dexamethasone for 3 days, and αvβ6 was assessed. Gray line, negative control; solid line, 0 μm; dotted line, 10 μm. The histogram is representative of three independent experiments. C, the data shown in B expressed as a bar chart. Shown are amalgamated data from three independent experiments expressed as -fold change MFI. **, p < 0.01. D, iHBECs were transfected with control or GR siRNA, and GR protein expression was determined by Western blotting to confirm GR knockdown. The figure is representative of three independent experiments. The ratio of GR:GAPDH as calculated by densitometry is shown beneath the bands. E, iHBECs were transfected with control or GR siRNA, and αvβ6 was assessed after 2 days. Gray line, negative control (-ve); black solid line, control siRNA; black dotted line, GR siRNA. The histogram is representative of three independent experiments. F, the data shown in E expressed as a bar chart. Shown are amalgamated data from three independent experiments expressed as -fold change MFI. **, p < 0.01. G, iHBECs were transfected with either an ITGB6 promoter reporter (black columns) or an empty vector control (white columns) and stimulated with TGFβ1 (2 ng/ml), progesterone (Prog, 10 μm), or TGFβ1 and progesterone in combination. Data are expressed as mean relative firefly/Renilla ratio ± S.E. from three independent experiments. **, p < 0.01. H, iHBECs were stimulated with 10 μm progesterone, and ITGB6 mRNA was measured by QPCR over 24 h. Data are expressed as mean -fold change relative to 0 h ± S.E. from three independent experiments. I, SAECs were stimulated with 10 μm progesterone, and αvβ6 was assessed. Gray line, negative control; solid line, 0 μm; dotted line, 10 μm progesterone. The histogram is representative of three independent experiments.
FIGURE 4.
FIGURE 4.
Inhibiting the actions of Elk1 and GR simultaneously does not have an additive effect on αvβ6 repression. A, iHBECs were transfected with Elk1 siRNA for 24 h and then stimulated with either 0 or 10 μm dexamethasone. αvβ6 expression was determined after 2 days. Shown are amalgamated data from three independent experiments. Data are expressed as -fold change in MFI relative to negative control (-ve). *, p < 0.05. B, iHBECs were left unstimulated or stimulated with 2 ng/ml TGFβ, 10 μm dexamethasone (Dex), or both agonists in combination for 3 days. αvβ6 expression was determined by flow cytometry. Shown are amalgamated data from three independent experiments. Data are expressed as -fold change in MFI. *, p < 0.05. C, iHBECs were transfected with either control siRNA, Elk1 siRNA, GR siRNA, or both siRNAs in combination for 24 h. The cells were then treated with 0 or 2 ng/ml TGFβ for 2 days. αvβ6 expression was measured by flow cytometry. Shown are amalgamated data from three independent experiments. Data are expressed as -fold change in MFI. *, p < 0.05; **, p < 0.01.
FIGURE 5.
FIGURE 5.
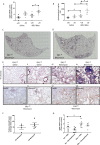
Loss of Elk1 in vivo results in an exaggerated response to bleomycin-induced lung fibrosis. A, Itgb6 mRNA levels were measured in lung homogenates by QPCR and were significantly elevated in bleomycin (Bleo)-instilled Elk1−/0 mice (n = 5 mice) compared with bleomycin-treated Elk1+/0 control mice (n = 7 mice). *, p < 0.05. B, total lung collagen, assessed by hydroxyproline levels, was significantly elevated in bleomycin-instilled Elk1−/0 mice (n = 5 mice) compared with Elk1+/0 controls (n = 7 mice). *, p < 0.05; **, p < 0.01. C, lung collagen was stained using Masson trichrome. Nikon NIS Elements was utilized to image an entire lung lobe from an Elk+/0 animal to demonstrate the deposition of collagen across the lobe. Shown is a representative single lung lobe from an Elk+/0 animal treated with bleomycin (n = 4 mice). D, lung collagen was stained using Masson trichrome. Nikon NIS Elements was utilized to image an entire lung lobe from an Elk1−/0 animal to demonstrate the deposition of collagen across the lobe. Shown is a representative single lung lobe from an Elk1−/0 animal treated with bleomycin (n = 4 mice). E, histological sections of lung from Elk1−/0 and Elk1+/0 animals following a bleomycin model of lung fibrosis were stained with Masson trichrome and for αvβ6 and pSmad2 by immunohistochemistry. All images were acquired using Nikon NIS Elements and are representative of a minimum of three (maximum of five) animals. Scale bar = 100 μm. i, saline-treated Elk1+/0 animal stained with Masson trichrome. ii, saline-treated Elk1−/0 animal stained with Masson trichrome. iii, bleomycin-treated Elk1+/0 animal stained with Masson trichrome. iv, bleomycin-treated Elk1−/0 animal stained with Masson trichrome. v, bleomycin-treated Elk1+/0 animal immunostained for αvβ6. vi, bleomycin-treated Elk1+/0 animal immunostained for pSmad2. vii, bleomycin-treated Elk1−/0 animal immunostained for αvβ6. viii, bleomycin-treated Elk1−/0 animal immunostained for pSmad2. F, histological sections of lung from Elk1−/0 and Elk1+/0 animals following a bleomycin model of lung fibrosis were stained immunohistochemically for pSmad2 (see E, vi and viii). pSmad2-positive nuclei were quantified. Data are expressed as mean brown nuclei per field of view in bleomycin-treated Elk1+/0 (n = 4) and Elk1−/0 (n = 5) animals. G, animals were instilled with either bleomycin or saline (Sal) and treated with either PBS or dexamethasone daily. Itgb6 mRNA levels were measured in lung homogenates by QPCR after 14 days and were significantly elevated in bleomycin-instilled, PBS-treated mice (n = 12 mice) compared with saline-instilled, PBS-treated mice (n = 7 mice). *, p < 0.05.
FIGURE 6.
FIGURE 6.
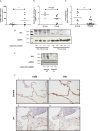
Expression of Elk1 is reduced in pulmonary fibrosis. A, relative expression of ITGB6 mRNA in NF (n = 6 donors) and PF (n = 6 donors) human lung tissue was assessed by QPCR. Data are expressed as relative mRNA expression compared with NF samples. The line demonstrates the median. *, p < 0.05. B, binding of Elk1 to the ITGB6 promoter in NF and PF tissue as measured by ChIP. Data are expressed as relative binding to the ITGB6 promoter compared with the IgG control, and the median is expressed. Relative binding of 1 or below demonstrates no binding to the promoter above IgG. C, densitometry analysis of Elk1 expression in whole-lung extracts from NF (n = 8 donors) and PF (n = 14 donors) donors. Data are expressed as a ratio of Elk1 band intensity:GAPDH band intensity. **, p < 0.01. D, representative immunoblot showing Elk1 and GAPDH expression in NF (n = 4 donors) and PF (n = 5 donors) lung tissue. The ratio of Elk1:GAPDH as calculated by densitometry is shown beneath the bands. E, immunoblot showing Elk1 and GAPDH protein expression in Elk1+/0 (n = 2 mice) and Elk1−/0 (n = 2 mice) animals. The ratio of Elk1:GAPDH as calculated by densitometry is shown beneath the bands. F, histological sections of lung from control (n = 4 donors) and PF (n = 4 donors) donors were immunostained for αvβ6 and Elk1. All images were acquired using Nikon NIS Elements and are representative of the donor samples used. Scale bar = 100 μm. i, lung tissue from a control donor was stained for αvβ6. ii, lung tissue from a PF donor was stained for αvβ6. iii, lung tissue from a control donor was stained for Elk1. iv, lung tissue from a PF donor was stained for Elk1.

Similar articles

Cited by

References

    1. Vancheri C., Failla M., Crimi N., and Raghu G. (2010) Idiopathic pulmonary fibrosis: a disease with similarities and links to cancer biology. Eur. Respir. J. 35, 496–504 - PubMed
    1. Navaratnam V., Fleming K. M., West J., Smith C. J., Jenkins R. G., Fogarty A., and Hubbard R. B. (2011) The rising incidence of idiopathic pulmonary fibrosis in the U.K. Thorax 66, 462–467 - PubMed
    1. Zoz D. F., Lawson W. E., and Blackwell T. S. (2011) Idiopathic pulmonary fibrosis: a disorder of epithelial cell dysfunction. Am. J. Med. Sci. 341, 435–438 - PMC - PubMed
    1. Tatler A. L., and Jenkins G. (2012) TGF-β activation and lung fibrosis. Proc. Am. Thorac. Soc. 9, 130–136 - PubMed
    1. Hagimoto N., Kuwano K., Inoshima I., Yoshimi M., Nakamura N., Fujita M., Maeyama T., and Hara N. (2002) TGF-β 1 as an enhancer of Fas-mediated apoptosis of lung epithelial cells. J. Immunol. 168, 6470–6478 - PubMed

Publication types

MeSH terms