

Divergent clonal evolution of castration-resistant neuroendocrine prostate cancer
- PMID: 26855148
- PMCID: PMC4777652
- DOI: 10.1038/nm.4045
Divergent clonal evolution of castration-resistant neuroendocrine prostate cancer
Abstract
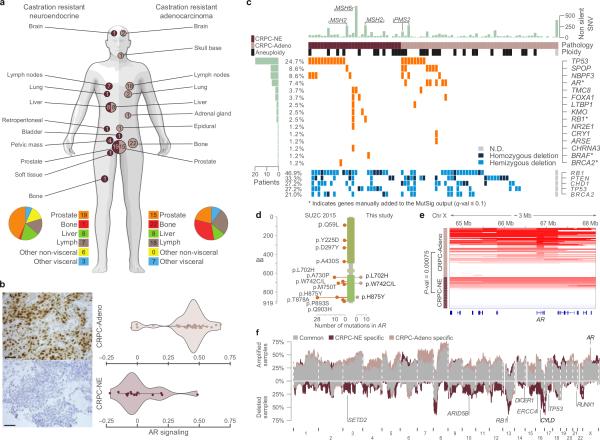
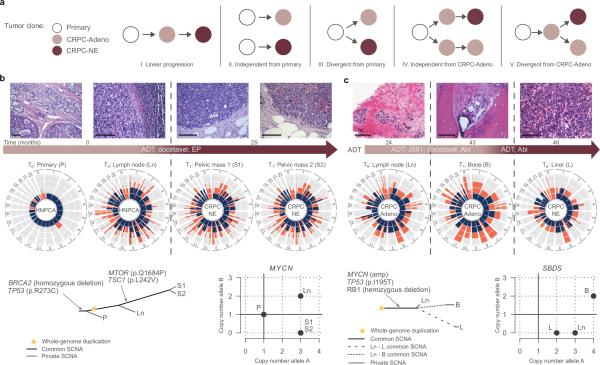
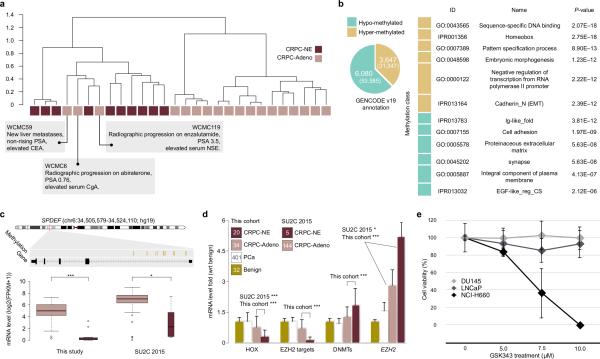
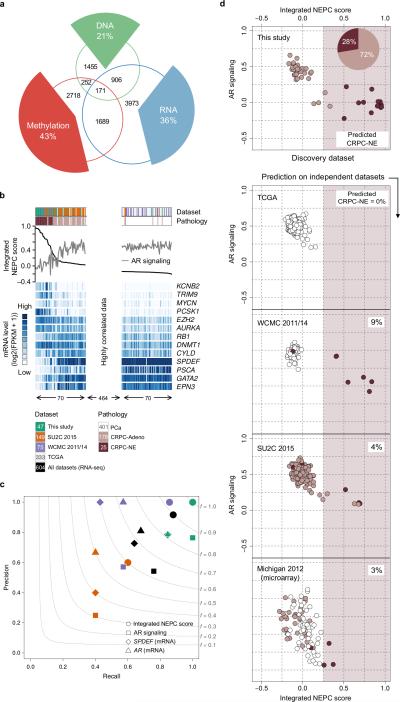
An increasingly recognized resistance mechanism to androgen receptor (AR)-directed therapy in prostate cancer involves epithelial plasticity, in which tumor cells demonstrate low to absent AR expression and often have neuroendocrine features. The etiology and molecular basis for this 'alternative' treatment-resistant cell state remain incompletely understood. Here, by analyzing whole-exome sequencing data of metastatic biopsies from patients, we observed substantial genomic overlap between castration-resistant tumors that were histologically characterized as prostate adenocarcinomas (CRPC-Adeno) and neuroendocrine prostate cancer (CRPC-NE); analysis of biopsy samples from the same individuals over time points to a model most consistent with divergent clonal evolution. Genome-wide DNA methylation analysis revealed marked epigenetic differences between CRPC-NE tumors and CRPC-Adeno, and also designated samples of CRPC-Adeno with clinical features of AR independence as CRPC-NE, suggesting that epigenetic modifiers may play a role in the induction and/or maintenance of this treatment-resistant state. This study supports the emergence of an alternative, 'AR-indifferent' cell state through divergent clonal evolution as a mechanism of treatment resistance in advanced prostate cancer.
Figures
Comment in
-
Prostate cancer: Multilayered mutation analysis indicates divergent clonal evolution.Nat Rev Urol. 2016 Apr;13(4):179. doi: 10.1038/nrurol.2016.38. Epub 2016 Feb 23. Nat Rev Urol. 2016. PMID: 26902334 No abstract available.
Similar articles
-
Prostate cancer: Multilayered mutation analysis indicates divergent clonal evolution.Nat Rev Urol. 2016 Apr;13(4):179. doi: 10.1038/nrurol.2016.38. Epub 2016 Feb 23. Nat Rev Urol. 2016. PMID: 26902334 No abstract available.
-
Genomic Aberrations Drive Clonal Evolution of Neuroendocrine Tumors.Trends Endocrinol Metab. 2016 May;27(5):242-244. doi: 10.1016/j.tem.2016.03.009. Epub 2016 Mar 29. Trends Endocrinol Metab. 2016. PMID: 27037211
-
Circulating tumor DNA profile recognizes transformation to castration-resistant neuroendocrine prostate cancer.J Clin Invest. 2020 Apr 1;130(4):1653-1668. doi: 10.1172/JCI131041. J Clin Invest. 2020. PMID: 32091413 Free PMC article. Clinical Trial.
-
Emerging Variants of Castration-Resistant Prostate Cancer.Curr Oncol Rep. 2017 May;19(5):32. doi: 10.1007/s11912-017-0593-6. Curr Oncol Rep. 2017. PMID: 28361223 Free PMC article. Review.
-
The heterogeneity of prostate cancers lacking AR activity will require diverse treatment approaches.Endocr Relat Cancer. 2021 Jul 15;28(8):T51-T66. doi: 10.1530/ERC-21-0002. Endocr Relat Cancer. 2021. PMID: 33792558 Free PMC article. Review.
Cited by
-
Mapping of m6A and Its Regulatory Targets in Prostate Cancer Reveals a METTL3-Low Induction of Therapy Resistance.Mol Cancer Res. 2021 Aug;19(8):1398-1411. doi: 10.1158/1541-7786.MCR-21-0014. Epub 2021 Jun 4. Mol Cancer Res. 2021. PMID: 34088870 Free PMC article.
-
The clinical efficacy and limitations of dutasteride-regulated abiraterone metabolism in abiraterone-resistant patients: a prospective single-arm clinical trial in Chinese patients.Transl Androl Urol. 2022 Aug;11(8):1169-1176. doi: 10.21037/tau-22-507. Transl Androl Urol. 2022. PMID: 36092845 Free PMC article.
-
Discovery of therapeutic targets in cancer using chromatin accessibility and transcriptomic data.Cell Syst. 2024 Sep 18;15(9):824-837.e6. doi: 10.1016/j.cels.2024.08.004. Epub 2024 Sep 4. Cell Syst. 2024. PMID: 39236711
-
The Role of Next-Generation Sequencing in Castration-Resistant Prostate Cancer Treatment.Cancer J. 2016 Sep/Oct;22(5):357-361. doi: 10.1097/PPO.0000000000000217. Cancer J. 2016. PMID: 27749331 Free PMC article. Review.
-
Cholinergic signaling via muscarinic M1 receptor confers resistance to docetaxel in prostate cancer.Cell Rep Med. 2024 Feb 20;5(2):101388. doi: 10.1016/j.xcrm.2023.101388. Epub 2024 Jan 22. Cell Rep Med. 2024. PMID: 38262412 Free PMC article.
References
-
- Siegel RL, Miller KD, Jemal A. Cancer statistics, 2015. CA: a cancer journal for clinicians. 2015;65:5–29. doi:10.3322/caac.21254. - PubMed
-
- Huggins C, Hodges CV. Studies on prostatic cancer: I. The effect of castration, of estrogen and of androgen injection on serum phosphatases in metastatic carcinoma of the prostate. 1941. The Journal of urology. 2002;168:9–12. - PubMed
-
- Chen CD, et al. Molecular determinants of resistance to antiandrogen therapy. Nature medicine. 2004;10:33–39. doi:10.1038/nm972. - PubMed
-
- Scher HI, et al. Increased survival with enzalutamide in prostate cancer after chemotherapy. The New England journal of medicine. 2012;367:1187–1197. doi:10.1056/NEJMoa1207506. - PubMed
Publication types
MeSH terms
Substances
Grants and funding
LinkOut - more resources
Full Text Sources
Other Literature Sources
Medical
Research Materials
