. 2016 Mar 1;7(9):9742-58.
doi: 10.18632/oncotarget.7138.

Zoledronate blocks geranylgeranylation not farnesylation to suppress human osteosarcoma U2OS cells metastasis by EMT via Rho A activation and FAK-inhibited JNK and p38 pathways

Affiliations

Zoledronate blocks geranylgeranylation not farnesylation to suppress human osteosarcoma U2OS cells metastasis by EMT via Rho A activation and FAK-inhibited JNK and p38 pathways

Hsin-Lin Cheng et al. Oncotarget. .

Abstract

Zoledronate is a standard treatment for preventing skeletal complications of osteoporosis and some types of cancer associated with bone metastases, but we little know whether the effect of zoledronate on metastasis of osteosarcoma. Here, we investigated the inhibitory effects of zoledronate on cell viability, motility, migration and invasion of 4 osteosarcoma cell lines (Saos2, MG-63, HOS and U2OS) by affecting cell morphology, epithelial-mesenchymal transition (EMT) and cytoskeletal organization as well as induction of E-cadherin and reduction of N-cadherin with activation of transcription factors Slug and Twist, especially in U2OS cells. Zoledronate decreased JNK and p38 phosphorylation and upper streams of focal adhesion kinase (FAK) and Src to suppress the motility, invasiveness and migration of U2OS cells. In addition to zoledronate-inhibited Rho A and Cdc42 membrane translocation and GTPγS activities, the anti-metastatic effects in U2OS cells including inhibition of adhesion were reversed by geranylgeraniol, but not farnesol. In conclusion, Zoledronate blocks geranylgeranylation not farnesylation to suppress human osteosarcoma U2OS cell-matrix and cell-cell interactions, migration potential, the invasive activity, and the adhesive ability by EMT via Rho A activation and FAK-inhibited JNK and p38 pathways.

Keywords: Rho A; U2OS; geranylgeranylation; metastasis; zoledronate.


Conflict of interest statement

CONFLICTS OF INTEREST

The authors declare that no conflicts of interest exist.

Figures
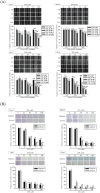
Figure 1
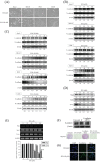
Figure 1. Effects of zoledronate on the wound healing, cell migration and invasion assays in 4 osteosarcoma (Saos2, MG-63, HOS and U2OS) cells
A. The wound healing assay after different concentrations (0, 25, 50, 75, and 100 μM) and different time (0, 6, 12, 24 h) of zoledronate treatment and B. the cell migration and invasion assays after different concentrations (0, 25, 50, 75, and 100 μM) of zoledronate treatment for 24 h in 4 osteosarcoma cells were measured as described in the Materials and Methods section. Concentration effects: wounding healing (Saos2: F = 144.888, p < 0.001. MG-63: F = 6.9, p = 0.006. HOS: F = 153.379, p < 0.001. U2OS: F = 160.048; p < 0.001); cell migration (Saos2: F = 321.366, p < 0.001. MG-63: F = 3139.028, p < 0.001. HOS: F = 630.053, p < 0.001. U2OS: F = 873.706, p < 0.001); invasion (Saos2: F = 1005.528, p < 0.001. MG-63: F = 5081.399, p < 0.001. HOS: F = 3031.602, p < 0.001. U2OS: F = 165.519, p < 0.001). aSignificantly different, p < 0.05, when compared with the vehicle group. bSignificantly different, p < 0.05, when compared with 25 μM. cSignificantly different, p < 0.05, when compared with 50 μM. dSignificantly different, p < 0.05, when compared with 75 μM. Time effects: wounding healing (Saos2: F = 239.005, p < 0.001. MG-63 F = 58.474, p < 0.001. HOS: F = 273.078, p < 0.001. U2OS: F = 114.156, p < 0.001.) †Significantly different, p < 0.05, when compared with 0 h. ‡Significantly different, p < 0.05, when compared with 6h. #Significantly different, p < 0.05, when compared with 12h.
Figure 2
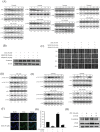
Figure 2. Effects of zoledronate on cell morphology and the EMT in 4 osteosarcoma (Saos2, MG-63, HOS and U2OS) cells
A. Cell morphology changes after 50 μM zoledronate treatment for 24 h in 4 osteosarcoma cells were observed. B. Expressions of E-cadherin and N-cadherin after different concentrations (0, 25, 50, 75, and 100 μM) and C. different time (0, 4, 6, 8, 16, 24 h) of zoledronate treatment in 4 osteosarcoma cells were measured by western blot analysis. D. Expressions and E. m-RNA levels of transcriptional factors Slug, Snail and Twist after different concentrations (0, 25, 50, 75, and 100 μM) of zoledronate treatment for 24 h in U2OS cells were measured by western blot analysis and RT-PCR, respectively. Concentration effects (Slug: F = 282.201. p < 0.001. Snail: F = 0.543, p = 0.708. Twist: F = 58.766. p < 0.001). aSignificantly different, p < 0.05, when compared with the vehicle group. bSignificantly different, p < 0.05, when compared with 25 μM. cSignificantly different, p < 0.05, when compared with 50 μM. dSignificantly different, p < 0.05, when compared with 75 μM. F. The cell migration assays after 50 μM zoledronate, siRNA E-cadherin or both treatments for 24 h in U2OS cells were measured. G. Cytoskeleton E-cadherin arrangement after 50 μM zoledronate treatment for 24 h in U2OS cells was analyzed by immunofluorescence staining.
Figure 3
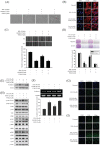
Figure 3. Effects of 50 μM zoledronate on the expressions of FAK, Src, MAPKs and PI3K-Akt in U2OS cells
A. Expressions of ERK, JNK, p38, PI3K and Akt and their phosphorylation after 50 μM zoledronate treatment for different time (0, 4, 6, 8, 16 and 24 h) in U2OS cells were measured by western blot analysis. B. The E-cadherin expression in western blotting and C. the wound healing assay after 50 μM zoledronate, the JNK inhibitor (SP600125), the p38 inhibitor (SB202190), or 50 μM zoledronate plus one inhibitor treatments for 24 h in U2OS cells were measured. D. Expressions of FAK, Src and their phosphorylation after different concentrations (0, 25, 50, 75, and 100 μM) treatment for 24 h and E. after 50 μM zoledronate treatment for different time (0, 4, 6, 8, 16 and 24 h) in U2OS cells were measured by western blot analysis. F. FAK changes after 50 μM zoledronate treatment in U2OS cells were analyzed by immunofluorescence staining. G. The cell migration assay and H. the E-cadherin expression after 50 μM zoledronate, wt-FAK or both treatments in U2OS cells were measured. F = 793.922, p < 0.001. aSignificantly different, p < 0.05, when compared with the vehicle group. bSignificantly different, p < 0.05, when compared with the zoledronate-treated group. cSignificantly different, p < 0.05, when compared with the wt-FAK-treated group.
Figure 4
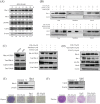
Figure 4. Effects of GGOH and FOH on zoledronate-induced anti-metastatic effects in U2OS cells
A. Cell morphology, B. cytoskeleton F-actin arrangement, C. the wound healing assay, D. the cell migration and invasion assays, E. the protein expression and F. the m-RNA level of E-cadherin, G. E-cadherin changes in immunofluorescence staining, H. expressions of MAPKs, PI3K, Akt, FAK, Src and their phosphorylation, and I. FAK changes in immunofluorescence staining after 50 μM zoledronate, 50 μM zoledronate plus 25 μM GGOH, or 50 μM zoledronate plus 25 μM FOH treatments for 24 h were observed in U2OS cells. Wound healing: F = 604.167, p < 0.001; migration: F = 224.704, p < 0.001; invasion: F = 499.471, p < 0.001; E-cadherin: F = 130.029, p < 0.001. aSignificantly different, p < 0.05, when compared with the vehicle group. bSignificantly different, p < 0.05, when compared with the zoledronate-treated group. cSignificantly different, p < 0.05, when compared with the zoledronate plus GGOH-treated group.
Figure 5
Figure 5. Effects of GGOH and FOH on zoledronate-suppressed membrane translocation and GTPγS activities of Rho A and Cdc42 in U2OS cells
A. Expressions of Rho A, Rac 1, pan-Ras and Cdc42 after 50 μM zoledronate treatment for different time (0, 4, 6, 8, 16 and 24 h) in U2OS cells were measured by western blot analysis. B. Expressions of Rho A and Cdc42 after 50 μM zoledronate, 50 μM zoledronate plus 25 μM GGOH, or 50 μM zoledronate plus 25 μM FOH treatments for 24 h were measured in cell lysate, membrane and cytosol of U2OS cells by western blot analysis. C. Activities of Rho A-GTPγS and Cdc42-GTPγS after 50 μM zoledronate, 50 μM zoledronate plus 25 μM GGOH, or 50 μM zoledronate plus 25 μM FOH treatments for 24 h were measured in U2OS cells as described in the Materials and Methods section. D. Expressions of Rho A, Rac 1, pan-Ras and Cdc42 after 50 μM zoledronate, 10 μM GGOH inhibitor (GGTI-298), or 10 μM FOH inhibitor (FTI-277) treatments for 24 h in U2OS cells were measured by western blot analysis. E. The cell migration assays after 50 μM zoledronate, siRNA Rho A or both treatments, and F. after 50 μM zoledronate, siRNA Cdc42 or both treatments in U2OS cells were measured.
Figure 6
Figure 6. Effects of GGOH and FOH on zoledronate-suppressed α4-, α6- and β1-integrins and adhesion in U2OS cells
A. The geneset list of gene ontology enrichment analysis shows the enriched bar chart of cellular function categories in U2OS cells treated with 100 μM zoledronate for 6 h. Log10 ratio indicated treated U2OS cells as compared with untreated cells. B. After treating with 50 (S50) and 100 μM (S100) zoledronate in U2OS cells for 24 h, analyses of the integrin family gene expression were pooled and used to generate the heat map that shows the result of the two-way hierarchical clustering of genes and samples. Each row represents a gene and each column represents a sample. The gene clustering tree is shown on the left, and the sample clustering tree appears at the top. Increased and decreased genes are represented in red and green, respectively. ITGA4 (α4-integrin), ITGA6 (α6-integrin) and ITGB1 (β1-integrin) genes were significantly inhibited (arrow). C. U2OS cells were treated with zoledronate (0, 25, 50, 75 and 100 μM) for 24 h before being subjected to RT-PCR for mRNA expressions of α4-, α6- and β1-integrins. α4-integrin: F = 70.869, p < 0.001; α6-integrin: F = 98.511, p = 0.006; β1-integrin: F = 181.995, p < 0.001. aSignificantly different, p < 0.05, when compared with the vehicle group. bSignificantly different, p < 0.05, when compared with 25 μM. cSignificantly different, p < 0.05, when compared with 50 μM. dSignificantly different, p < 0.05, when compared with 75 μM. D. The cell adhesion assays after 50 μM zoledronate, 50 μM zoledronate plus 25 μM GGOH, or 50 μM zoledronate plus 25 μM FOH treatments for 24 h were observed in U2OS cells. Collagen: F = 74.826, p < 0.001; gelatin: F = 36.808, p < 0.001; fibronectin: F = 3.682, p = 0.062. aSignificantly different, p < 0.05, when compared with the vehicle group. bSignificantly different, p < 0.05, when compared with the zoledronate-treated group. cSignificantly different, p < 0.05, when compared with the zoledronate plus GGOH-treated group.
Figure 7
Figure 7. The schematic representation of anti-metastasis effects of zoledronate in human osteosarcoma U2OS cells
Zoledronate blocks geranylgeranylation not farnesylation to suppress human osteosarcoma U2OS cell-matrix and cell-cell interactions, migration potential, the invasive activity, and the adhesive ability by EMT via Rho A activation and FAK-inhibited JNK and p38 pathways.

Similar articles

Cited by

References

    1. Mirabello L, Troisi RJ, Savage SA. Osteosarcoma incidence and survival rates from 1973 to 2004: data from the Surveillance, Epidemiology, and End Results Program. Cancer. 2009;115:1531–1543. - PMC - PubMed
    1. Ottaviani G, Jaffe N. The epidemiology of osteosarcoma. Cancer treatment and research. 2009;152:3–13. - PubMed
    1. Oertel S, Blattmann C, Rieken S, Jensen A, Combs SE, Huber PE, Bischof M, Kulozik A, Debus J, Schulz-Ertner D. Radiotherapy in the treatment of primary osteosarcoma—a single center experience. Tumori. 2010;96:582–588. - PubMed
    1. Valastyan S, Weinberg RA. Tumor metastasis: molecular insights and evolving paradigms. Cell. 2011;147:275–292. - PMC - PubMed
    1. Hsieh YS, Chu SC, Yang SF, Chen PN, Liu YC, Lu KH. Silibinin suppresses human osteosarcoma MG-63 cell invasion by inhibiting the ERK-dependent c-Jun/AP-1 induction of MMP-2. Carcinogenesis. 2007;28:977–987. - PubMed

Publication types

MeSH terms

Substances