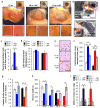
. 2016 Feb 11;530(7589):184-9.
doi: 10.1038/nature16932. Epub 2016 Feb 3.

Naturally occurring p16(Ink4a)-positive cells shorten healthy lifespan

Affiliations

Naturally occurring p16(Ink4a)-positive cells shorten healthy lifespan

Darren J Baker et al. Nature. .

Abstract

Cellular senescence, a stress-induced irreversible growth arrest often characterized by expression of p16(Ink4a) (encoded by the Ink4a/Arf locus, also known as Cdkn2a) and a distinctive secretory phenotype, prevents the proliferation of preneoplastic cells and has beneficial roles in tissue remodelling during embryogenesis and wound healing. Senescent cells accumulate in various tissues and organs over time, and have been speculated to have a role in ageing. To explore the physiological relevance and consequences of naturally occurring senescent cells, here we use a previously established transgene, INK-ATTAC, to induce apoptosis in p16(Ink4a)-expressing cells of wild-type mice by injection of AP20187 twice a week starting at one year of age. We show that compared to vehicle alone, AP20187 treatment extended median lifespan in both male and female mice of two distinct genetic backgrounds. The clearance of p16(Ink4a)-positive cells delayed tumorigenesis and attenuated age-related deterioration of several organs without apparent side effects, including kidney, heart and fat, where clearance preserved the functionality of glomeruli, cardio-protective KATP channels and adipocytes, respectively. Thus, p16(Ink4a)-positive cells that accumulate during adulthood negatively influence lifespan and promote age-dependent changes in several organs, and their therapeutic removal may be an attractive approach to extend healthy lifespan.


Figures
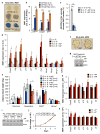
Extended Data Figure 1
Extended Data Figure 1. ATTAC transgene expression tracks with expression of senescence markers in iWAT and induces apoptosis of senescent cells upon AP administration
a, Comparative analysis of SA-β-Gal activity in intact iWAT. b, Analysis of endogenous p16Ink4a and ATTAC transcript SA-β-Gal activity in iWAT by qRT-PCR. Abbreviation: H/H (BubR1H/H) (n = 4 mice per group). Scale bar, 0.5 cm. c, FACS-based quantitation of iWAT progenitor cell numbers in 18-month-old ATTAC mice treated with vehicle or AP. d, Expression of the ATTAC transgene and senescence markers in iWAT as determined by qRT-PCR (n = 4 mice per group). Asterisks above individual bars denote significant changes to 2-month-old mice; asterisks above brackets denote significant differences between 18-month-old vehicle and AP treated mice. e, Perirenal, mesenteric, subscapular and brown adipose depot weights. f, SA-β-Gal activity in iWAT from 2-month-old ATTAC mice treated with vehicle or AP beginning at weaning age. g, p16Ink4a levels in iWAT from the mice described in f. Actin was used a loading control. h, Expression of ATTAC and senescence marker mRNA in the mice described in f (n = 3 mice per group). (ik) Early passage non-senescent ATTAC MEFs express p16Ink4a but are not susceptible to FKBP-Casp8-mediated elimination when cultured in the presence of AP. i, Levels of p16Ink4a in passage 3 ATTAC mouse embryonic fibroblasts (MEFs), with and without AP treatment. j, Growth curves of passage 3 ATTAC MEFs (n =4 independently generated MEF lines per group), with and without AP treatment. k, Expression of ATTAC and senescence marker mRNA in passage 3 ATTAC MEFs (n = 3 independently generated MEF lines per group), with and without AP treatment. Error bars indicate s.e.m. Statistical significance was determined by unpaired two-tailed t tests. *, P<0.05; **, P<0.01; ***, P<0.001. For gel source data, see Supplementary Fig. 1.
Extended Data Figure 2
Extended Data Figure 2. ATTAC lacks promoter elements required for expression in replication competent cells or aged lymphocytes expressing high levels endogenous p16Ink4a
(a–c) SV40 Large-T antigen-immortalized ATTAC MEFs robustly express endogenous p16Ink4a (due to SV40 Large T-mediated inactivation of Rb) but fail to engage the ATTAC transgene and are not subject to FKBP-Casp8-mediated elimination. a, p16Ink4a protein levels in p4 primary MEFs and MEFs immortalized with SV40 Large-T antigen. Actin was used as a loading control. b, p16Ink4a protein levels in immortalized MEFs treated with vehicle or two concentrations of AP. Actin was used as a loading control. c, Expression of ATTAC and senescence marker transcripts in p4 primary MEFs, vehicle-treated immortalized MEFs, and AP-treated immortalized MEFs (n = 3 independently generated MEF lines per group). d, Schematic representation of the endogenous p16Ink4a locus and the various p16Ink4a promoter regions driving ATTAC, 3MR and Firefly luciferase (FLUC). ATTAC and p16-3MR mice have 2.6 kb and ~50 kb p16Ink4a promoter fragments driving transgene activity, respectively. p16-FLUC has firefly lucif-erase knocked into the endogenous p16Ink4a locus, which keeps the entire promoter region intact but ablates p16Ink4a protein expression. e, p16Ink4a protein levels in early passage primary and SV40 Large-T antigen-immortalized p16-3MR MEFs. f, Expression of senescence marker mRNA in early and late passage primary MEFs and SV40 Large-T antigen-immortalized p16-3MR MEFs (n = 1 independently generated MEF line per group performed in triplicate). g, Expression of senescence marker mRNA in early and late passage primary MEFs and SV40 Large-T antigen-immortalized p16-FLUC MEFs (n = 1 independently generated MEF line per group performed in triplicate). h, Expression of ATTAC and senescence markers in CD3+ T-cells from 12 and 18-month-old ATTAC mice (n = 5 mice per group). Error bars indicate s.e.m. Statistical significance was determined by unpaired two-tailed t tests. *, P<0.05; **, P<0.01; ***, P<0.001. We note that all values in f and g have a P<0.05 compared to p4 MEFs, with the exception of the one marked NS for not significant. For gel source data, see Supplementary Fig. 1.
Extended Data Figure 3
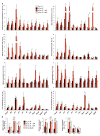
Extended Data Figure 3. ATTAC-mediated clearance of senescent cells is partial and tissue selective and attenuates expression of inflammation markers
a, Expression of the ATTAC transgene and a senescence marker panel, as determined by RT-PCR, in gastrocnemius, eye, kidney, heart (atria), spleen, lung, liver, and colon (n = 4 females per group). b, Expression of Il6, Il1α and Tnfα as determined by qRT-PCR in mouse iWAT, kidney and skeletal muscle at different ages (n = 4 females per group). Il6 values are as indicated in Extended Data Fig. 1d (iWAT) and 3a (kidney and gastrocnemius). Expression levels of inflammation markers in unmanipilated 18-month-old C57BL/6 females suggests that repeated vehicle injections were not a source of tissue inflammation. Error bars indicate s.e.m. Statistical significance was determined by unpaired two-tailed t tests. *, P<0.05; **, P<0.01; ***, P<0.001. Asterisks above individual bars in (a) denote significant changes to 2-month-old mice; asterisks above brackets denote significant differences between 18-month-old vehicle and AP treated mice.
Extended Data Figure 4
Extended Data Figure 4. Comparison of lifespans under different diets and housing facilities
a, Survival curves of unmanipulated wild-type 129Sv-C57BL/6 mice fed a 5% versus 9% fat diet. Median lifespan (in days) are indicated. b, Survival curves of unmanipulated wild-type 129Sv-C57BL/6 mice fed 9% fat diet plotted against those of vehicle- (-AP) and AP-treated (+AP) 129Sv-C57BL/6-FVB ATTAC mice from Fig. 2b. These data suggest that the lifespans of vehicle-injected 129Sv-C57BL/6-FVB control mice were quite normal for the diet that they were on and unlikely to be negatively impacted by repeated intraperitoneal injections. Log-rank tests were used to determine statistical significance. *, P<0.01; ** P<0.001; ***, P<0.001. c, d, Median survival data of unmanipulated C57BL/6 male (c) and female (d) mice from various laboratories for comparsion to the results obtained from our facility.
Extended Data Figure 5
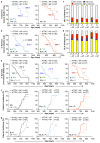
Extended Data Figure 5. Senescent cell clearance increases delays tumor and cataract formation
a, b, Survival curves of mixed (a) and C57BL/6 (b) ATTAC mice dying of cancer (mice that had an overt tumor at time of death; only mice with lymphomas, sarcomas and carcinomas were included). Median survival (in days) and percentage increase are indicated. c, d, Incidence of macroscopically detectable neoplasms (lymphomas, sarcomas and carcinomas) at time of death in mixed (c) and C57BL/6 (d) ATTAC mice from survival cohorts. e, Survival curves of C57BL/6-129Sv-FVB mice dying without cancer (mice that had an overt tumor at time of death, including lymphoma, sarcoma and/or carcinoma, were excluded). Median survival (in days) and percentage increase are indicated. fg, Cataract incidence for mixed (f) and C57BL/6 (g) ATTAC mouse cohorts. Log-rank tests were used to determine statistical significance in a, b, and e–g. *, P<0.05; **, P<0.01; ***, P<0.001.
Extended Data Figure 6
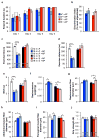
Extended Data Figure 6. Senescent cell clearance does not affect coordination, memory or exercise ability of 18-month-old ATTAC mice
a, Time spent balanced during a fixed speed rotarod test for 18-month-old ATTAC mice (n = 6 male and 8 female mice per group). b, Novel object investigation test. The percent of investigations of a novel object divided by the total investigations is graphed. Key and animal numbers are as indicated in a. c–e, Time-to-exhaustion (c), distance (d) and work (e) during a treadmill exercise test. Animal numbers are as indicated in c. f, Gastrocnemius muscle weight of ATTAC mice (n = 6 12-month-old males and females; n= 4 18-month-old –AP males and females; n = 4 18-month-old +AP males and females). g–i, Myofiber diameter measurements on isolated gastrocnemius (g), abdominal (h), and paraspinal muscle (i). Animal numbers are as indicated in f. j, Analysis of forelimb grip strength of ATTAC mice. Legends in d–j are as in c. Error bars indicate s.e.m. Unpaired two-tailed t tests were used to determine statistical significance. *, P<0.05; **, P<0.01; ***, P<0.001.
Extended Data Figure 7
Extended Data Figure 7. Senescent cell clearance has no impact on hematological parameters and age-related changes in leukocyte populations
a–l, Hematology results of 3-, and 10-month-old untreated ATTAC C57BL/6 mice and 18-month-old vehicle and AP treated ATTAC C57BL/6 mice. White blood cell count (a), platelet count (b), red blood cell count (c), hemaglobin concentration (d), haematocrit (e), mean corpuscular volume (f), mean corpuscular haemoglobin (g), neutrophils (h), lymphocyptes (i), basophils (j), monocytes (k), and eosinophils (l). (m–q), Assessment for leukocyte subpopulations in 3-, and 10-month-old untreated ATTAC C57BL/6 mice and 18-month-old vehicle and AP treated ATTAC C57BL/6 mice. CD4+ T cells (% of peripheral blood mononuclear cells or PBMC) (m), CD8+ T cells (% of PBMC) (n), CD44hi CD4+ T cells (% of CD4+) (o), CD44hi CD8+ T cells (% of CD8+) (p), and NK1.1+ cells (% of PBMC) (q). Key and animal numbers in b–l are as indicated in a, key and animal numbers in n–q are as indicated in m. Error bars indicate s.e.m. Unpaired two-tailed t tests were used to determine statistical significance. *, P<0.05; **, P<0.01; ***, P<0.001.
Extended Data Figure 8
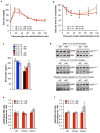
Extended Data Figure 8. Senescent cell removal does not impact somatotrophic axis signaling in vivo
a, Glucose levels following intraperitoneal glucose administration following an overnight fast in 18-month-old vehicle- and AP-treated ATTAC C57BL/6 females. b, Normalized glucose levels following intraperitoneal insulin administration following a 4 hour fast in 18-month-old vehicle- and AP-treated ATTAC C57BL/6 females. c, Serum Igf1 levels in ATTAC C57BL/6 mice (n = 4 mice of each group). d, Representative western blots for phospho-S6K, total S6K, phospho-AKTS473 and total AKT in iWAT, kidney and skeletal muscle tissue lysates from 18-month-old vehicle- and AP-treated ATTAC C57BL/6 females. Serum Igf1 levels in ATTAC C57BL/6 mice (n = 4 mice of each group). e, Quantification of phospho-S6K to total S6K ratio in blots from (d), n = 4 mice of each group. f, Quantification of phospho-AKTS473 to total AKT ratio in blots from (d), n = 4 mice of each group. Error bars indicate s.e.m. No statistically significant differences were observed in a–c and e–f using unpaired two-tailed t tests. For gel source data, see Supplementary Fig. 1.
Extended Data Figure 9
Extended Data Figure 9. Senescent cell clearance does not alter cardiac morphology and function in “resting” mice and AP treatment has no impact on healthspan of mice lacking the ATTAC transgene
a, Electron micrographs of X-Gal crystal containing cells in the aortic root. VSMC, vascular smooth muscle cell. Scale bars, 1 μm (main panel) and 200 nm (inset). (b–g) Echocardiography measurements of heart rate (b), left ventricular mass (c), posterior wall thickness (d), left ventricular inner diameter (e), ejection fraction (f), and the fractional shortening of the heart (g) in 12-month-old untreated mice and 18-month-old ATTAC mice treated with vehicle or AP. h, Fat mass (n = 9 mice per group). 18-month-old ATTAC vehicle treated mouse values are the same as indicated in Fig. 1. i, iWAT and eWAT depot weight (n = 4 mice per group). 18-month-old ATTAC vehicle treated mouse values are the same as indicated in Fig. 1. j, k, Kidney sclerosis (j) and blood urea levels (k) (n = 4 mice per group). 18-month-old ATTAC vehicle treated mouse values are the same as indicated in Fig. 4. l, Time to death following isoproterenol administration (n = 4 mice per group). 18-month-old ATTAC vehicle treated mouse values are the same as indicated in Fig. 5. Legends and number of animals in c–g are as in b, legends in i–l are as in h. Error bars indicate s.e.m. No statistically significant differences were observed using unpaired two-tailed t tests.
Extended Data Figure 10
Extended Data Figure 10. Impact of senescent cell clearance on wound healing and tissue fibrosis
a, Closure of 3-mm punch biopsy wounds in 18-month-old ATTAC females after treatment with vehicle or AP for 6 months and if drug treatment was stopped 2 days prior to skin puncture or continued during wound closure (n = 6 wounds for –AP;–AP and +AP;–AP and n = 10 wounds for –AP;+AP and +AP;+AP). AP administration during the wound healing process significantly attenuates the rate of wound closure independently of whether senescent cell removal had occurred prior to wounding. b, Closure of 3-mm punch biopsy wounds in 4-month-old ATTAC females after treatment with vehicle or AP following wounding (n = 10 wounds per group). Similar to 18-month-old mice, AP administration during the wound healing process dramatically attenuated the rate of wound closure. c, Quantification of total GFP+ cells isolated from 3-mm punch biopsy wounds of 4-month-old mice two days into the wound healing process treated with vehicle (black) or AP (red, n = 3 mice per group). d, PTAH-stained tissues sections from 18-month-old ATTAC mice for detection of fibrosis. Scale bars, 100 μm. Error bars indicate s.e.m. Unpaired two-tailed t tests were used to determine statistical significance for a–c. Mice receiving AP during the healing process in a and b are significantly different from those treated with vehicle from day 1.5 through day 9.5. *, P<0.05.
Figure 1
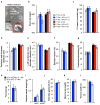
Figure 1. Clearance of senescent fat progenitor cells attenuates age-related lipodystrophy
a, FACS profiles of single-cell suspensions from iWAT of the indicated mice. b, GFP+ and GFP cell populations from iWAT of 12-month-old ATTAC mice (see a for sorting brackets) analyzed by qRT-PCR (n = 6 mice). c, SA-β-Gal activity in GFP+ and GFP iWAT cells (n = 3 mice). d, GFP+ cells in the indicated iWAT cell populations (“Rest” represents the iWAT vascular stromal fraction minus leukocytes, endothelial cells and progenitors). e–i, Fat-related analyses on C57BL/6 ATTAC mice prior to treatment (12 m) or after 6 months of treatment with vehicle (18 m –AP) or AP (18 m +AP). e, SA-β-Gal activity in iWAT (IAT) and eWAT (epididiymal). f, Electron micrograph showing perivascular X-Gal-positive cells from an 18-month-old vehicle-treated C57BL/6 ATTAC male. A, adipocyte; C, capillary. Arrows mark endothelial cells. g, Quantitation of iWAT cells containing X-Gal crystals (n = 4 mice per treatment). h, Fat mass measurements. i, iWAT and eWAT depot weights. j, Mean adipocyte diameters in iWAT. k, Expression of adipogenesis markers in iWAT (n = 4 mice per group). Scale bars: 10 μm in c; 0.5 cm in e; 2 μm in the main panel of f and 200 nm in the insets. Legends in i–k are as in h. Error bars indicate s.e.m. Statistical significance in b was determined by one sample t tests using a theoretical mean of 1, and by unpaired two-tailed t tests in all other panels. *, P<0.05; **, P<0.01; ***, P<0.001.
Figure 2
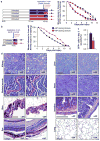
Figure 2. Senescent cell clearance extends lifespan
a, Study design for clearance of senescent cells in mixed and C57BL/6 mouse cohorts. Healthspan analysis was done at 18 months, an age where relatively few mice in vehicle (Veh)- or AP-treated have died and bias due to selection for long-lived animals is unlikely. b, c, Survival curves for vehicle- (–AP) and AP-treated (+AP) mixed (b) and C57BL/6 mice (c). Median survival (in days) and percentage increase in median survival are indicated. We note that median lifespans of our vehicle-treated cohorts are similar to those of wild-type mice administered AP (c). Log-rank tests were used to determine statistical significance. *, P<0.05; **, P<0.01; ***, P<0.001.
Figure 3
Figure 3. Clearance of senescent cells prolongs healthspan
a, Survival curves of AT-TAC mice dying of cancer (mice that had an overt tumor at time of death; mice with lymphomas, sarcomas and carcinomas were included, mice without tumors were censored). Median survival and percentage increase are indicated. b, Representative images of aged mice with and without senescent cell clearance. c, Spontaneous movement and exploratory behavior of ATTAC mice analyzed by the open field test. Error bars indicate s.e.m. Log-rank tests were used to determine statistical significance in a; unpaired two-tailed t tests were used in c. *, P<0.05; **, P<0.01; ***, P<0.001.
Figure 4
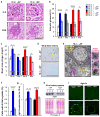
Figure 4. Senescent cells cause glomerulosclerosis, kidney dysfunction and renal RAAS hyperactivity
a, Images of sclerotic (left) and normal (right) glomeruli from the indicated mice. b, Quantification of sclerotic glomeruli. c, Measurements of blood urea nitrogen levels. d, SA-β-Gal-stained kidney sections. e, Electron micrograph showing a X-Gal crystal-containing renal epithelial cell with brush border membrane (arrowheads). Insets show X-Gal crystal close-ups. f, Percent of cells with X-Gal crystals in renal sections (n = 5 TEM grids for each treatment group). g, Renal expression of Agtr1a analyzed by qRT-PCR (n = 4 mice per group). h, Western blot of kidney lysates probed for Agtr1a (n = 3 mice per treatment group). Ponceau S staining served as loading control. i, Immunostaining of kidney sections for Agtr1a. Yellow circles denotes glomeruli. Scale bars: 50 μm in a; 250 μm in d; 5 μm (main panel) and 200 nm (insets) in e; 100 μm (top) and 50 μm (bottom) in i. Legends in c, f and g are as in b. Error bars indicate s.e.m. Statistical significance was determined by unpaired two-tailed t tests in b, c, f, and g. *, P<0.05; **, P<0.01; ***, P<0.001. For gel source data, see Supplementary Fig. 1. All mice in d–i were C57BL/6 ATTAC. +AP, AP-treated mice, –AP, vehicle-treated mice.
Figure 5
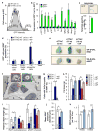
Figure 5. Senescent cells promote age-related cardiomyocyte hypertrophy and loss of cardiac stress tolerance
a, SA-β-Gal stained hearts. Insets show aortic roots (ar) from a transverse plane (arrow marks the aortic root wall) or closups of the ventricular (v) and arterial (a) boxed areas. b, Electron micrographs of X-Gal positive cells in the pericardium (red asterisk marks cilia). Insets show closeups of X-Gal crystals. c, Quantification of cells with X-Gal crystals in the visceral pedicardium (n = 4 mice per treatment). d, Measurements of left ventricle wall thickness (n = 4 mice per group). e, Representative cardiomyocyte cross-sectional images (n = 4 mice per group). f, Quantification of (e). g, Analysis of Sur2a expression in hearts by qRT-PCR (n = 4 mice per group). h, Cardiac stress resistance determined by measuring the time to death after injection of a lethal dose of isoproterenol. i, Change in left ventricular (LV) mass in response to sublethal doses of isoproterenol (10 mg.kg−1) after ten doses administered over 5 days. Scale bars: 1 mm in a; 2 μm (main panel) and 200 nm (inset) in b. Legends in f–h are as in d. Error bars indicate s.e.m. Statistical significance was determined by unpaired two-tailed t test in c, d and f–i. *, P<0.05; **, P<0.01; ***, P<0.001. All mice, except for h, were C57BL/6 ATTAC. +AP, AP-treated mice, –AP, vehicle-treated mice.

Comment in

  • Ageing: Out with the old.
    Gil J, Withers DJ. Gil J, et al. Nature. 2016 Feb 11;530(7589):164-5. doi: 10.1038/nature16875. Epub 2016 Feb 3. Nature. 2016. PMID: 26840486 Free PMC article. No abstract available.
  • Ageing: Anti-ageing formula.
    Minton K. Minton K. Nat Rev Mol Cell Biol. 2016 Mar;17(3):134-5. doi: 10.1038/nrm.2016.16. Epub 2016 Feb 17. Nat Rev Mol Cell Biol. 2016. PMID: 26883004 No abstract available.

Similar articles

Cited by

References

    1. Campisi J. Aging, cellular senescence, and cancer. Annual review of physiology. 2013;75:685–705. - PMC - PubMed
    1. Sharpless NE, Sherr CJ. Forging a signature of in vivo senescence. Nat Rev Cancer. 2015;15:397–408. - PubMed
    1. van Deursen JM. The role of senescent cells in ageing. Nature. 2014;509:439–446. - PMC - PubMed
    1. Baker DJ, et al. Clearance of p16Ink4a-positive senescent cells delays ageing-associated disorders. Nature. 2011;479:232–236. - PMC - PubMed
    1. Baker DJ, et al. Opposing roles for p16Ink4a and p19Arf in senescence and ageing caused by BubR1 insufficiency. Nature cell biology. 2008;10:825–836. - PMC - PubMed

Publication types

MeSH terms

Substances