. 2016 Feb 17;89(4):867-79.
doi: 10.1016/j.neuron.2015.12.041. Epub 2016 Jan 28.

Central Gain Restores Auditory Processing following Near-Complete Cochlear Denervation

Affiliations

Central Gain Restores Auditory Processing following Near-Complete Cochlear Denervation

Anna R Chambers et al. Neuron. .

Abstract

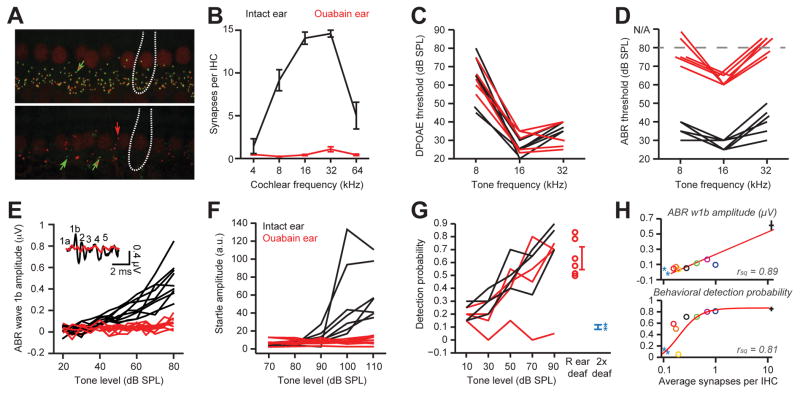
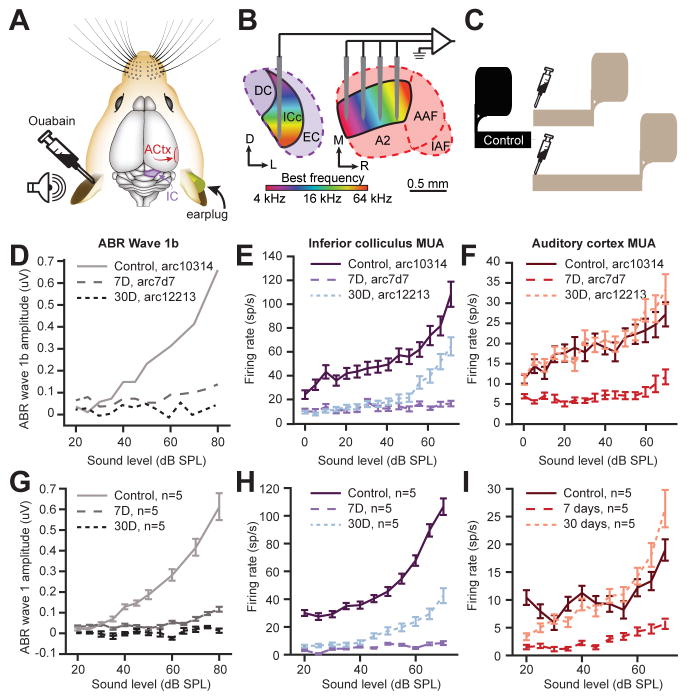
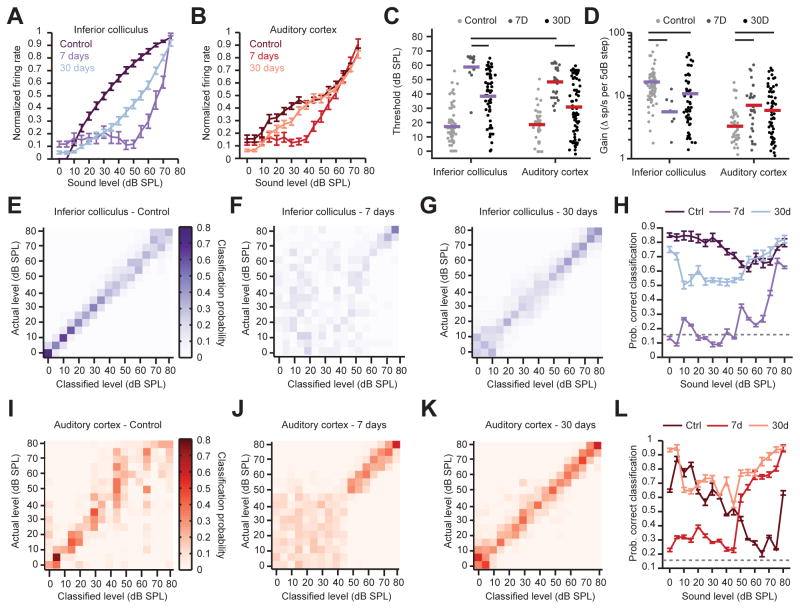
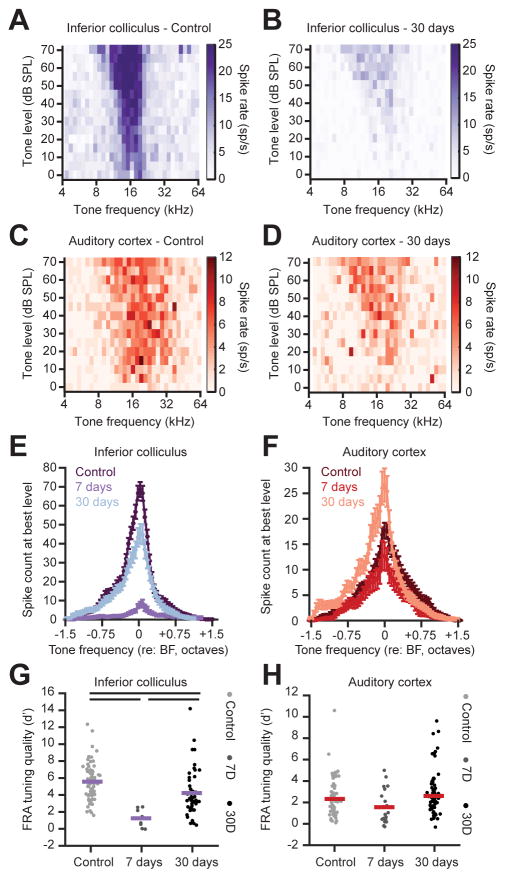
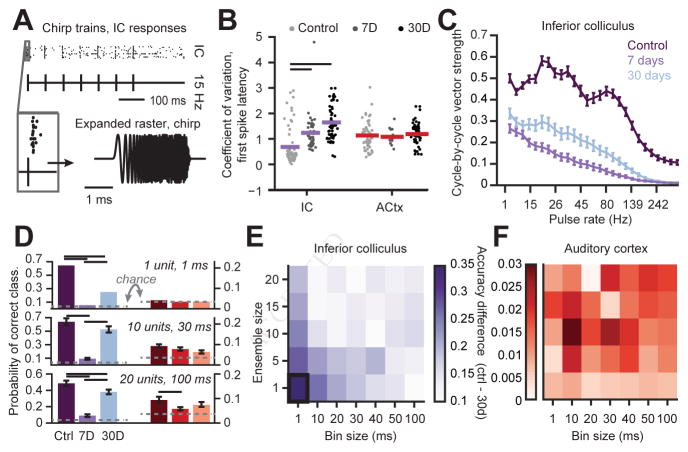
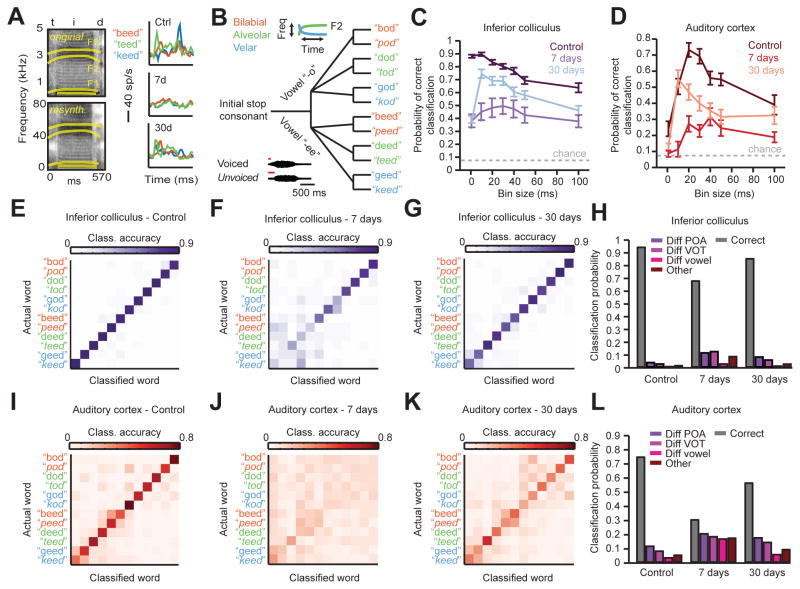
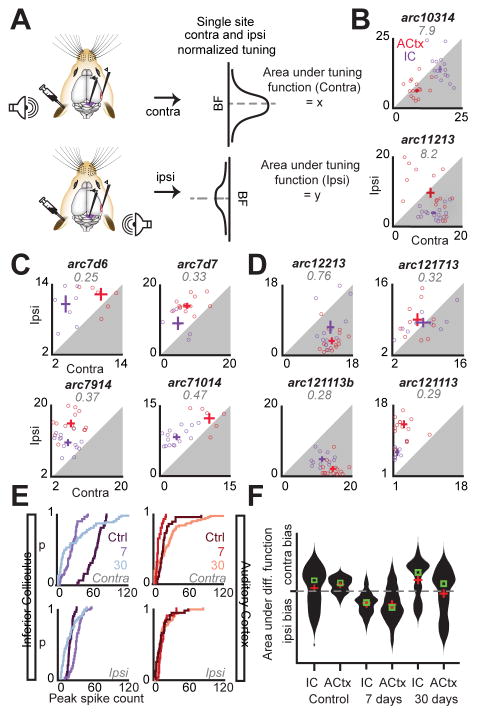
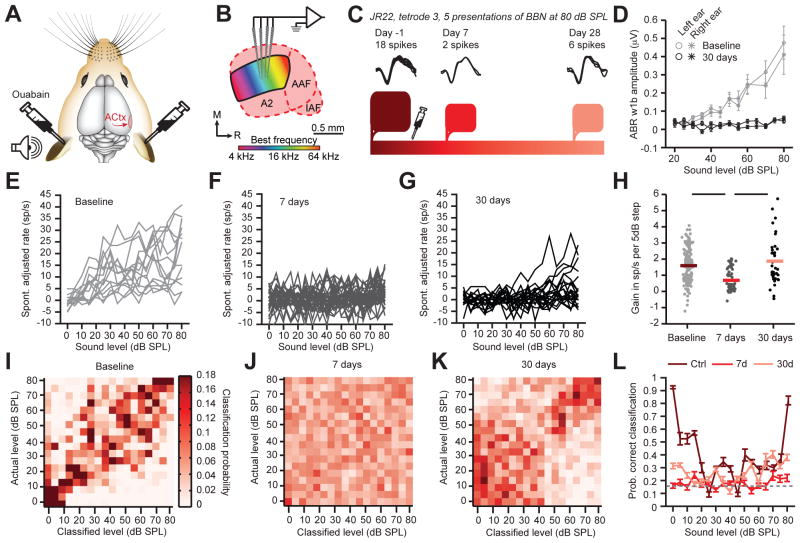
Sensory organ damage induces a host of cellular and physiological changes in the periphery and the brain. Here, we show that some aspects of auditory processing recover after profound cochlear denervation due to a progressive, compensatory plasticity at higher stages of the central auditory pathway. Lesioning >95% of cochlear nerve afferent synapses, while sparing hair cells, in adult mice virtually eliminated the auditory brainstem response and acoustic startle reflex, yet tone detection behavior was nearly normal. As sound-evoked responses from the auditory nerve grew progressively weaker following denervation, sound-evoked activity in the cortex-and, to a lesser extent, the midbrain-rebounded or surpassed control levels. Increased central gain supported the recovery of rudimentary sound features encoded by firing rate, but not features encoded by precise spike timing such as modulated noise or speech. These findings underscore the importance of central plasticity in the perceptual sequelae of cochlear hearing impairment.


Figures

Figure 1
Figure 1. Ouabain eliminated > 95% of Type-I SGN synapses and most indications of hearing according to brainstem activity, yet tone audibility remained intact
(a) Cochlear histopathology from a control (top) and ouabain-treated (bottom) adult mouse. Juxtaposition of IHC presynaptic ribbons (red) and glutamate postsynaptic receptors (green) indicate a functional synapse (combined red and green arrow). Orphaned ribbons and receptors are indicated by purely red or green arrows, respectively. IHCs are outlined in white. (b) Synaptic counts per IHC across the cochlear frequency axis (Intact ear, black line: n = 4; Ouabain ear, red line: n = 13; F = 377.7, p < 0.01, repeated measures ANOVA. Error bars are mean +/− SEM). (c) DPOAE thresholds indicated that hair cell amplification was intact and functional (Intact ear vs ouabain ear, n = 8; F = 1.1, p = 0.31, repeated measures ANOVA). (d,e) Auditory brainstem response (ABR) wave 1b (e, inset) thresholds (d, n = 8, F = 68.8, p < 0.01, repeated measures ANOVA) and amplitudes (e, n = 8, F = 28.9, p < 0.01) at 8 kHz reflect the massive loss of nerve fibers. (f–g) Auditory startle response (f) and tone detection (g) are shown for the same mice (a–e) also using 8 kHz tones. The startle response is eliminated in all mice after ouabain (n = 6, F = 11.1, p < 0.01, repeated measures ANOVA) despite normal tone sensitivity in 3/4 mice. (g, right). In a different cohort of mice, detection probability at 80–90 dB SPL through the denervated ear is tested with the control ear deafened (red, n = 6) or in mice with 100% elimination of type-I SGNs in both ears (blue, n = 2). Errorbars are mean +/− SEM. (h) 8 kHz ABR w1b amplitude (top) and 8 kHz tone detection probability at 80–90 dB (bottom) is compared to synaptic innervation at the 8kHz region of the cochlea (individual mice are distinguished by circle color).
Figure 2
Figure 2. Tone sensitivity at higher stations of auditory processing grows as the peripheral response fades
(a,b) 16 channel silicon probes were chronically implanted in the central nucleus of the inferior colliculus (IC) and the primary auditory cortex (ACtx) of adult animals with or without ouabain-mediated denervation of the contralateral ear. (c) Schematic of experimental and control groups. Control animals underwent sham (sterile water applied at the round window) or no treatment, while unilaterally ouabain-treated mice were implanted 7 days or 30 days post-treatment. (d–f) Example pure tone-elicited growth functions from ABR wave 1 (d), all IC multiunit recordings (e), and all ACtx multiunit recordings (f), measured from an individual mouse in each group (animal ID provided in the legend). (g) Mean ABR wave 1 pure tone growth functions, F(2) = 52.0, p < 0.01, between groups ANOVA), and population spiking growth functions measured from all recording sites, whether tone-responsive or not, from IC (h, n = 319 sites, F(2) = 171.5, p < 0.01, between groups ANOVA), and ACtx (i, n = 298 sites, F(2) = 19.2, p < 0.01, between groups ANOVA). Error bars represent SEM.
Figure 3
Figure 3. Increased central gain fully restored sound level coding in ACtx, with partial recovery in IC
Analysis for this and all subsequent figures are limited to recording sites with significant sound-evoked activity. ANOVA with post-hoc pairwise comparisons are used for testing statistical significance. (a,b) Normalized firing rate evoked by noise bursts of varying level for IC (a) and ACtx (b) reveal significant recovery from 7 to 30 days, relative to control (ANOVA main effects for group; IC: F(2) = 56.01, p < 0.01; ACtx: F(2) = 13.29, p < 0.01). (c) Response thresholds at 7 versus 30 days significantly decreased in both brain areas. (d) Gain can be quantified as the amount of firing rate change per fixed increment of stimulus input, assessed here in non-normalized units of spikes/sec per 5dB increment of sound level within the initial growth phase of each rate-level function. (e–g, i–k), Confusion matrices for single trial PSTH-based classification of sound level by IC sites in control (e), 7 day (f), and 30 day (g) post-ouabain groups. Classification was performed with ensembles of 20 sites, chosen with replacement over 50 repetitions. (h) Mean probability of veridical classification with IC sites (the diagonal of the confusion matrices ± 5dB) across sound level for control, 7 day, and 30 day post ouabain groups. Dashed gray lines represents chance classification. (i–k) Confusion matrices for sound level classification with ACtx sites. (l) Mean probability of correct classification for ACtx sites. Horizontal lines indicate significant differences after unpaired t-tests, corrected for multiple comparisons (p < 0.05).
Figure 4
Figure 4. Cochlear denervation induces a short-term loss of frequency tuning in IC but not ACtx
(a–d) FRAs from representative IC (a,b) and ACtx (c,d) recording sites in control or 30 day mice. (e,f) Mean frequency response functions are derived from the most effective sound level and centered on the best frequency (BF) for all tone-responsive recording sites. In the IC (e), response magnitude at BF is significantly greater at 30 days post ouabain compared to 7 days (p < 0.005), but is still significantly lower than that observed in the control group (p < 0.001). Conversely, in the ACtx (f), tone-evoked responses in the 7 day group were not significantly suppressed compared to control (p = 0.6), while peak responses in the 30 day group were significantly higher than control (p < 0.05). (g,h) FRA quality was assessed using a d-prime metric, which quantifies the separability of firing rate distributions drawn from frequencies within versus outside the receptive field boundary (see Supplemental Methods). In the IC (g), d-prime values were significantly lower at 7 days compared to control. They were significantly higher in the 30 day group, but did not recover to control levels. In the ACtx (h), d-prime values were not significantly different across groups. Between groups ANOVA used to test statistical significance. Horizontal lines above scatter plots indicate pairwise statistical significance after correcting for multiple comparisons. See Supplemental Table 1 for complete reports on each statistical test.
Figure 5
Figure 5. Cochlear denervation irreversibly disrupts precise temporal decoding of modulation rate
(a) Trains of 1 ms broadband chirp stimuli (top, one chirp shown in expanded view at bottom) were presented at 20 dB above chip response threshold for each recording site, while unit responses (top, raster to initial chirp shown in expanded view at bottom) were recorded from IC or ACtx. (b) The coefficient of variation of the first spike latency to a single chirp was measured in both brain areas. In the IC, the first spike latency in the 7 days and 30 days group were significantly elevated compared to controls (post-hoc pairwise tests, p < 0.01 for each comparison after correcting for multiple comparisons) but not from each other (post-hoc pairwise test, p = 0.29). (c) Cycle-by-cycle vector strength, a metric of synchronization, was calculated for IC only, as ACtx exhibited only asynchronous responses to chirp trains in all conditions. Synchronization was significantly impaired relative to control at both the 7 days and 30 days time points. (d) Mean probability of correct classification averaged across all pulse rates for various combinations of bin size and ensemble size. Note difference in y-axis scaling for IC and ACtx. Horizontal lines above bar plots indicate significant differences after pairwise tests, corrected for multiple comparisons. Broken horizontal lines indicate probability of correct classification by chance. (e,f) Ensemble classification in IC and ACtx for various ensemble sizes and PSTH time bins. Color scale represents Control mean classification minus 30 days mean classification, therefore positive values indicate a persistent decoding deficit at 30 days. Note difference in color axis scaling between IC and ACtx. Between groups ANOVA used to test statistical significance.
Figure 6
Figure 6. Midbrain and cortical coding of speech tokens is persistently impaired after ouabain treatment
(a, left) Spectrograms of an English speech token in its original form (top) and resynthesized for mouse hearing (bottom). (a, right) Example PSTHs from representative ensembles of 10 recording sites taken in control (top), 7 days post-ouabain (middle), and 30 days post-ouabain (bottom) conditions. Scale bar shows y-axis firing rate scale for PSTHs. Color of PSTH indicates word identity. Although speech tokens evoke significant activity in the 30 day condition, PSTHs from various words are less distinguishable. (b) Phonetic taxonomy for speech tokens, separated into vowel category, place of articulation (color, inset shows formant transitions for two tokens with different places of articulation), and voicing (italics, inset shows example amplitude envelope for a voiced versus unvoiced consonant). (c,d) Mean probability of veridical speech token classification from single trials of ensemble spiking in IC (b) and ACtx (c) using PSTH bin sizes ranging from 1 ms to 100 ms. In IC, classification performance is significantly impaired after ouabain treatment (F(2) = 16.8, p < 0.01). Although there is a trend for improvement between 7 and 30 days post-treatment for bin sizes larger than 1 ms, this is not significant (p = 0.06). Significant impairment is also seen in ACtx after ouabain treatment (F(2) = 27.16, p < 0.01). From 7 to 30 days post-treatment, classification performance significantly improves, (p < 0.01) but not to the level of control (p < 0.01). (e–g) Confusion matrices showing mean ensemble classification for IC recordings using the optimal bin size in control (e), 7 days post-ouabain (f) and 30 days post-ouabain (g) conditions. (h) Correct and erroneous classification probabilities. (i–l) Same as (e–h), but for ACtx ensembles. Classification errors persist in ACtx at 30 days, even at the optimal bin size, particularly for tokens that differ by POA or VOT. Between groups ANOVA used to test statistical significance.
Figure 7
Figure 7. Dynamic switches in representational dominance between the denervated and intact ears
(a) Unilaterally ouabain-treated animals were fitted with an earplug in either the control or treated ear as sound stimuli were presented to the unplugged ear. Recordings were performed in the IC and ACtx, contralateral to the treated ear, and ipsilateral to the control ear. Stimuli were pure tones from 4–64 kHz in frequency and 0–70 dB in level. Normalized frequency response functions at best level were calculated at significantly responsive (through either ear) recording sites for the ipsilateral (intact ear) and contralateral (ouabain-treated ear) stimulation conditions. The integral of each tuning function was calculated using a trapezoidal approximation, and plotted for each site with Contra on the x axis and Ipsi on the y axis. (b) Ipsi vs Contra tuning function area from the IC and ACtx of two control animals (animal ID indicated in black text, gray italic text indicates the average number of synapses per IHC as revealed by cochlear histopathology). Frequency response functions tend to have a contralateral bias, as evidenced by the mean for each brain area lying below the diagonal. Bi-directional error bars (thick lines) reflect standard error of the mean. (c) Data from 4 animals recorded 7 days after ouabain treatment. Having lost a significant amount of input from the normally dominant contralateral ear, multiunit sites show a bias toward the intact, ipsilateral ear, particularly in IC recordings. (d) Data from 4 animals tested at 30 days after ouabain treatment. Ipsilateral dominance persists in two mice (arc121113 and arc121713) while other mice have reverted to contralateral bias (arc12213 and 121113b). (e) Cumulative probability distribution of peak spike counts from contralateral (top row) and ipsilateral (bottom row) recording sites in IC (left column) and ACtx (right column). Bidirectional modulation of spike rates is evidenced by the extension of spike count range to above and below control levels after 30 days. (f) Distribution plots of the area of the difference function (contra – ipsi) for control, 7 day, and 30 day post ouabain conditions. Ipsilateral tuning functions are negative. Mean and median are indicated by red crosses and green squares, respectively.
Figure 8
Figure 8. Comparatively modest cortical recovery following bilateral cochlear denervation
In this series of experiments, ouabain was applied bilaterally (a–b) and long-term recording of single units (n = 82 units from 6 mice) in the right primary auditory cortex was achieved with 4 implanted tetrodes. (c) With this approach, we could record single unit activity from fixed points in ACtx for several days prior to bilateral ouabain application, and then again at the 7 day and 30 day time points. We provide an example of all spike waveforms recorded during 5 trials of a 100ms noise token presented at 80 dB SPL from a single tetrode wire over a 30 day period from one mouse. (e–g) Noise-evoked spike rate as a function of SPL after first correcting for pre-stimulus spontaneous firing rate for all single units recorded either before ouabain application (e) or 7 days (f) and 30 days (g) following oubain application. Modest recovery of sound-evoked firing rate was observed along with a transient loss and subsequent recovery of normative response gain (h). (i–k) Confusion matrices for sound level classification based on ensembles of 13 ACtx units. (l) Mean probability of correct classification for ACtx sites. Dashed gray line represents chance classification. Horizontal lines indicate significant differences after unpaired t-tests, corrected for multiple comparisons (p < 0.05).

Comment in

Similar articles

Cited by

References

    1. Atencio Ca, Sharpee TO, Schreiner CE. Receptive field dimensionality increases from the auditory midbrain to cortex. J Neurophysiol. 2012;107:2594–2603. - PMC - PubMed
    1. Atiani S, Elhilali M, David SV, Fritz JB, Shamma SA. Task Difficulty and Performance Induce Diverse Adaptive Patterns in Gain and Shape of Primary Auditory Cortical Receptive Fields. Neuron. 2009;61:467–480. - PMC - PubMed
    1. Auerbach BD, Rodrigues PV, Salvi RJ. Central gain control in tinnitus and hyperacusis. Front Neurol. 2014;5 - PMC - PubMed
    1. Ayala Ya, Pérez-González D, Duque D, Nelken I, Malmierca MS. Frequency discrimination and stimulus deviance in the inferior colliculus and cochlear nucleus. Front Neural Circuits. 2013;6:119. - PMC - PubMed
    1. Berlin CI, Hood LJ, Morlet T, Wilensky D, Li L, Mattingly KR, Taylor-Jeanfreau J, Keats BJB, John PS, Montgomery E, et al. Multi-site diagnosis and management of 260 patients with Auditory Neuropathy/Dys-synchrony (Auditory Neuropathy Spectrum Disorder) Int J Audiol. 2010;49:30–43. - PubMed

Publication types

MeSH terms