. 2016 Feb 2:7:10417.
doi: 10.1038/ncomms10417.

Affinity and competition for TBP are molecular determinants of gene expression noise

Affiliations

Affinity and competition for TBP are molecular determinants of gene expression noise

Charles N J Ravarani et al. Nat Commun. .

Abstract

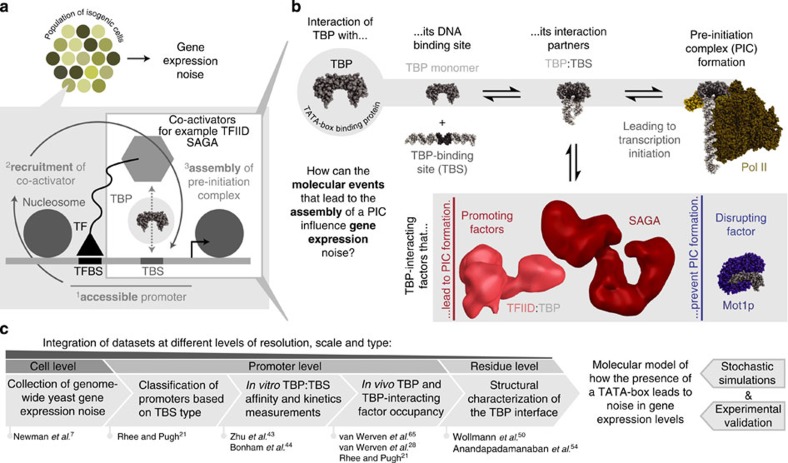
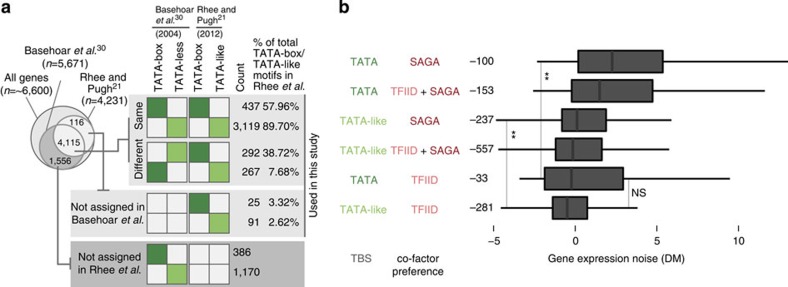
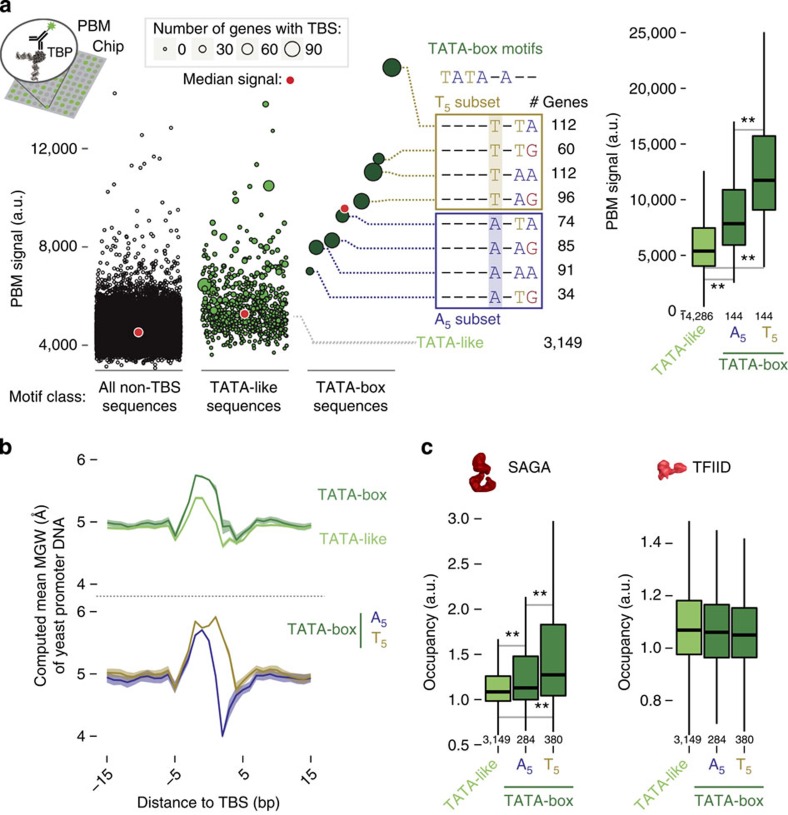
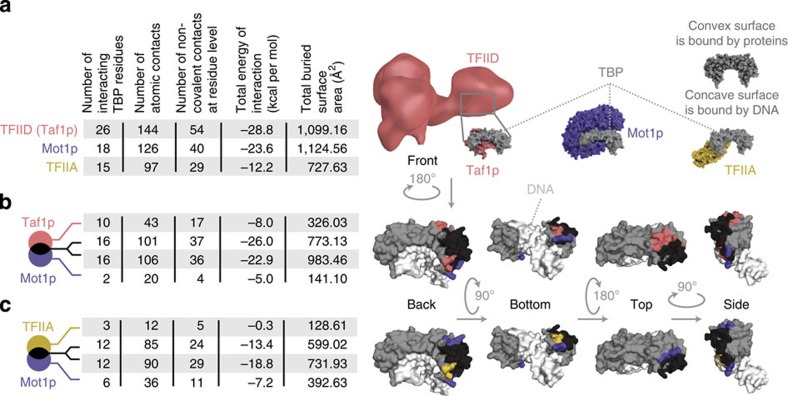
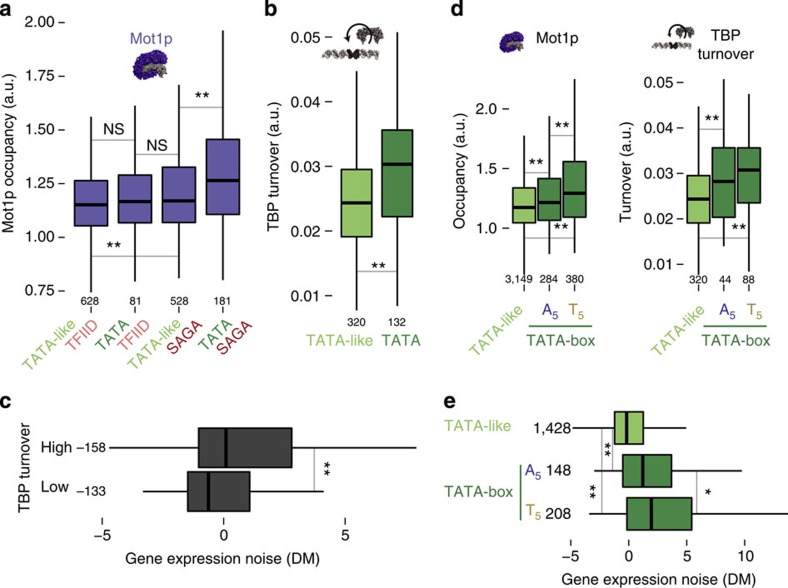
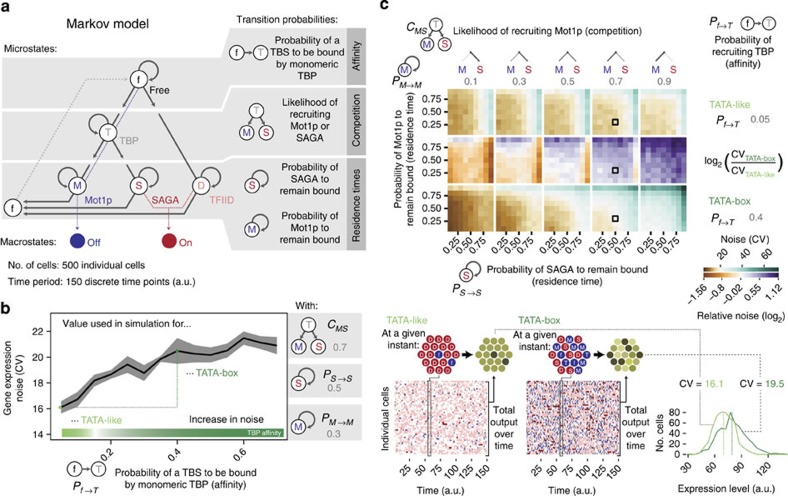
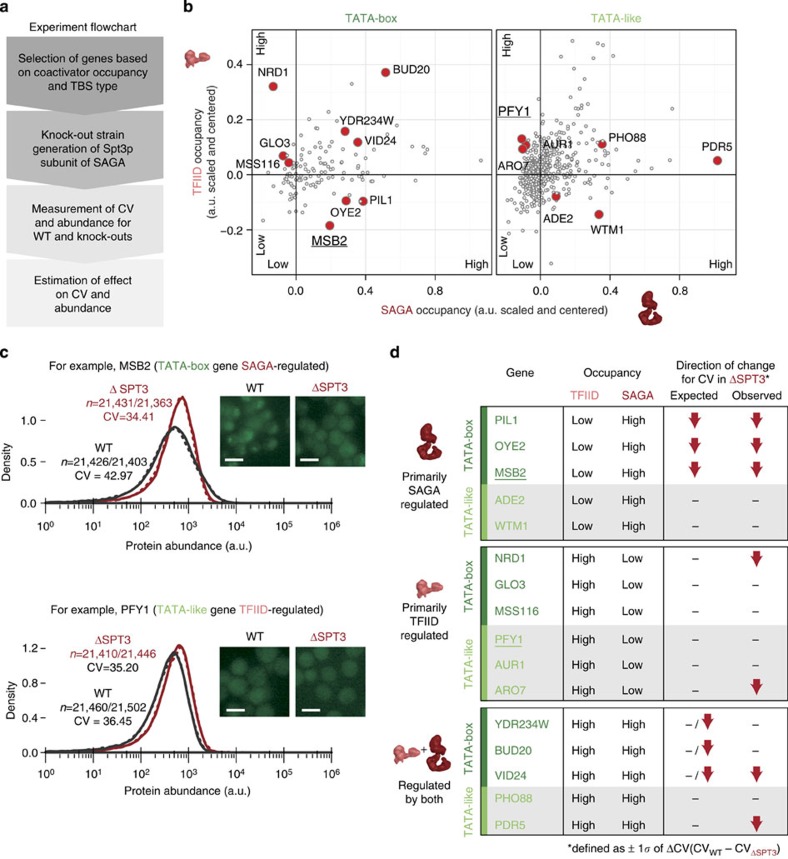
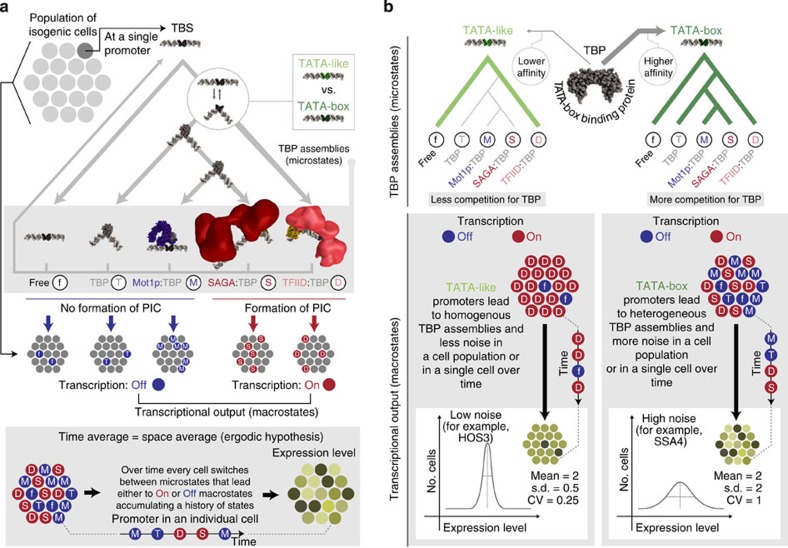
Cell-to-cell variation in gene expression levels (noise) generates phenotypic diversity and is an important phenomenon in evolution, development and disease. TATA-box binding protein (TBP) is an essential factor that is required at virtually every eukaryotic promoter to initiate transcription. While the presence of a TATA-box motif in the promoter has been strongly linked with noise, the molecular mechanism driving this relationship is less well understood. Through an integrated analysis of multiple large-scale data sets, computer simulation and experimental validation in yeast, we provide molecular insights into how noise arises as an emergent property of variable binding affinity of TBP for different promoter sequences, competition between interaction partners to bind the same surface on TBP (to either promote or disrupt transcription initiation) and variable residence times of TBP complexes at a promoter. These determinants may be fine-tuned under different conditions and during evolution to modulate eukaryotic gene expression noise.


Figures

Figure 1
Figure 1. Framework for investigating how gene expression noise arises from the mechanistic details of the interaction of TBP with its partner proteins and their influence on PIC formation.
(a) In a population of genetically identical cells (isogenic population), individual cells can show differences in their gene expression levels (shades of yellow). In order for genes to be expressed, their promoter needs to be accessible (nucleosome re-organization) and co-activating complexes need to be recruited (via transcription factors; TFs). (b) The TATA-box binding protein (TBP) is required for every transcriptional event in eukaryotic cells. TBP can exist in different functional assemblies. They are in dynamic equilibrium between a dimeric state and a monomeric state that in turn can form different TBP assemblies with (i) other general transcription factors (TFIIB and TFIIA in yellow), (ii) co-activators (TFIID in pink and SAGA in red) that promote pre-initiation complex (PIC) formation or (iii) disrupting factors (Mot1p in purple) that bind and evict the DNA bound TBP and prevent PIC formation. (c) To obtain mechanistic and molecular insights into the origins of noise, we integrated data from different levels of resolution, scales and types describing various aspects of transcription initiation in the yeast Saccharomyces cerevisiae, which were tested using stochastic simulations and were experimentally validated.
Figure 2
Figure 2. Comparison and classification of TBS sequences and the relationship between TBS type, co-activator binding preference and gene expression noise.
(a) Comparison of promoter classification using the computationally inferred TATA-box containing promoters by Basehoar et al. and nucleotide-level resolution measurement of TBP-binding sites by Rhee and Pugh. The Venn diagram on the top left indicates the number of genes analysed in the different data sets and the extent of overlap of the genes studied, respectively. The matrix on the right indicates the degree to which the more recent data set from Rhee and Pugh agrees (top) and disagrees (bottom) with the assignment of genes in Basehoar et al. to host a TATA-box (dark green) or a TATA-like (light green) sequence/TBP-binding site (TBS) in their respective promoters. Genes with no assignment in both studies are also shown. (b) The relationship between promoter TBS type and co-activator preference, and gene expression noise. The respective distributions in terms of gene expression noise (DM) are shown as box plots and were ranked according to the median noise value of each class. In the different panels, statistical significances between distributions of medians were assessed using the Wilcoxon rank-sum tests that were corrected for multiple testing (‘**' for P<0.01 and ‘NS' for not significant). The number of genes in each class is given on the left of the plot.
Figure 3
Figure 3. TBP binding affinity and intrinsic DNA flexibility of TBS sequences.
(a) The protein binding microarray (PBM) signal intensity is plotted for the different TBS type sequences (dark green for TATA-boxes and light green for TATA-like sequences) and all other 8-mer sequences (black). Every circle represents the median signal measured for all the repeats on the chip for that given sequence, and the size indicates the number of promoters in yeast that host this particular sequence in its TBS. The red dot indicates the median PBM signal per sequence class. PBM signals for TATA-box subtypes (middle), that is, T5 (yellow) and A5 (blue). The number of genes with the given sequence in the TBS in yeast is shown on the right. Box plots of distributions of PBM signal intensity for probes hosting the different TBS motifs (right). (b) Computed intrinsic minor groove width (MGW) for TATA-box (dark green) and TATA-like sequences (light green; top panel). The shaded area represents confidence intervals. MGW for T5 (yellow) and A5 (blue) subtypes are shown in the bottom. (c) Genes were classified based on the TBS type in their promoter (dark green for TATA-box with the T5 and the A5 subsets, light green for TATA-like sequences) and box plots of distributions for SAGA and TFIID occupancies are shown. In all the panels, Wilcoxon rank-sum tests (that were corrected for multiple testing; ‘**' for P<0.01) were performed to assess statistical significance between the medians of the distributions. The number of genes in each class is given on the bottom of the box plot.
Figure 4
Figure 4. Properties of the interface and interactions between TBP and its partner proteins.
(a) Characterization of the interaction interface of TBP in complex with distinct PIC-influencing factors. TBP (grey) is shown from the same orientation as it interacts with TFIID (pink), Mot1p (purple) and TFIIA (yellow). For TFIID, the electron microscopy structure is shown. One of the subunits (Taf1p) with two TAND domains that interact with TBP is also highlighted. The properties calculated to characterize the interaction interface include the number of interacting TBP residues, the number of atomic contacts, the number of non-covalent contacts, the total computed energy of interaction (kcal per mol), and the total buried surface area (Å2). (b) Comparison of the TFIID(Taf1p):TBP interface and the Mot1p:TBP interface (convex TBP surface only). The contributions of the different factors are divided into those that are unique to each (pink for TFIID and purple for Mot1p) and those that are common/overlapping (black). (c) Comparison of the TFIIA:TBP interface and the Mot1p:TBP interface (convex TBP surface only). The contributions of the different factors are divided into those that are unique to each factor (yellow for TFIIA, purple for Mot1p) and those that are common/overlapping (black). In both (b,c) the interacting regions are mapped onto the structure and viewed from different angles. The DNA is coloured white.
Figure 5
Figure 5. Box plots of the distributions highlighting the relationship between TBS, TBP interacting proteins, TBP turnover and gene expression noise.
(a) Mot1p occupancy at promoters with different TBS types and different co-activator regulation classes. (b) TBP turnover at promoters with different TBS types (dark green for TATA-box and light green for TATA-like). (c) The TBP turnover in promoters of genes was split into low and high bins ([0.008–0.026] and (0.026–0.051] a.u., respectively) based on the median TBP turnover and the distributions of gene expression noise for these two classes are displayed as box plots. Genes were classified based on the TBS type in their promoter (dark green for TATA-box with the T5 and the A5 subsets, light green for TATA-like sequences) and the distributions of Mot1p occupancy and TBP turnover are shown in (d) and noise in (e). In all the panels, Wilcoxon rank-sum tests (that were corrected for multiple testing; ‘**' for P<0.01, ‘*' for P<0.05) were performed to assess the statistical significance of the differences between the medians of the distributions. The number of genes in each class is given on the bottom or the left of the box plot.
Figure 6
Figure 6. Stochastic simulations highlighting how TBP affinity for a TBS, competition between Mot1p and SAGA and their residence times influence noise.
(a) The possible TBP assemblies at the promoter (microstates) leading to transcriptional output (On state) or no output (Off state) and the transitions between the microstates were used to build a Markov model. The simulation was performed for a cell population with 500 individual cells and for 150 time points. (b) The intrinsic binding affinity of TBP for different TBS sequences and its relationship with noise. For this simulation, the competition and residence time parameters for Mot1p and SAGA were kept constant. The grey ribbon around the trend line indicates plus and minus one s.d. from the mean from three independent simulations. (c) Phase diagram of the possible noise behaviour for different parameters for a promoter under different co-activator and Mot1p regulation. Black square boxes in the matrix highlight the parameter combination that was used to generate the simulation results shown in b. In the bottom, the history of microstates from the simulation for a TATA-box and TATA-like promoters is shown (left). At a given instant, individual cells with TATA-like promoter have a more homogenous distribution of microstates and a corresponding consistent expression output. In contrast, cells with TATA-box promoters show a more heterogeneous distribution of microstates and a corresponding variable expression output (right). The respective mean expression values are indicated with a dashed line in the distribution.
Figure 7
Figure 7. Deletion of SAGA impacts noise in the way predicted by the model.
(a) The experimental pipeline used in this study. (b) The genes were selected based on SAGA and TFIID occupancy for both TBS types (TATA-box containing, dark green and TATA-like sequence, light green). The selected genes can be classified into six groups with at least two genes in each group (total of 16 genes; red dots). (c) Fluorescence microscopy images of two genes (MSB2: TATA-box TBS and predominantly regulated by SAGA; PFY1: TATA-like TBS and predominantly regulated by TFIID), in the wild type (WT) strain and SAGA knockout strain (ΔSPT3; SPT3 of the SAGA complex interacts with TBP). Scale bars, 4.2μm. Flow cytometry measurements of thousands of single cells (∼20,000 cells; no. of cells, n are shown for both replicate experiments) were recorded with two replicates to get the distribution of expression levels in the population and to investigate the impact of the ΔSPT3 knockout on noise (CV). (d) Expected and observed effect of SPT3 knockout (SAGA subunit) for genes with different core promoter types. Genes are classified based on their TBS type (TATA-box, dark green and TATA-like, light green), and their respective TFIID and SAGA occupancy (high/low). The expected effects of the ΔSPT3 knockout based on the mechanistic model (no change; dash or a decrease in noise; red down arrow) are shown. The observed decrease in effect was defined as a deviation from WT noise levels by at least one s.d. from all measured differences.
Figure 8
Figure 8. Molecular and mechanistic model for how the TBS in a promoter can lead to different TBP assemblies in a population of cells and thereby lead to noise in gene expression levels.
(a) The TBS within a gene's promoter in a cell population can harbour different TBP assemblies following a given path through a chain of events/decision tree (top). A promoter can harbour a number of possible microstates: free (f), TFIID (D), TBP (T), SAGA (S) or Mot1p (M). Depending on the assembled TBP complex, the promoter will either be transcriptionally active or silent. The extent of switching between transcriptionally permissive or non-permissive states either (i) over time in an individual (time-average) or (ii) at an instance between individual cells in a population (space-average) determines the extent of expression noise (bottom). (b) TBS type determines the TBP complexes that can be assembled and thus can explain the emergence of noise. A TATA-box TBS can host a larger variety of microstates with different transcriptional output (top-right), which leads to more variability in gene expression levels between individual cells in a population. TATA-like TBS predominantly end up in the TFIID microstate, which leads to consistent expression output (top-left) and less variability in expression levels between individual cells in a population. In a population of cells, the different individuals might switch between the different TBP assemblies at a promoter and this will manifest as differences in the expression level of a gene (dark yellow for low abundance and light yellow for high abundance).

Similar articles

Cited by

References

    1. Raser J. M. & O'Shea E. K. Control of stochasticity in eukaryotic gene expression. Science 304, 1811–1814 (2004). - PMC - PubMed
    1. Raser J. M. & O'Shea E. K. Noise in gene expression: origins, consequences, and control. Science 309, 2010–2013 (2005). - PMC - PubMed
    1. Balazsi G., van Oudenaarden A. & Collins J. J. Cellular decision making and biological noise: from microbes to mammals. Cell 144, 910–925 (2011). - PMC - PubMed
    1. Acar M., Mettetal J. T. & van Oudenaarden A. Stochastic switching as a survival strategy in fluctuating environments. Nat. Genet. 40, 471–475 (2008). - PubMed
    1. Lehner B. Genotype to phenotype: lessons from model organisms for human genetics. Nat. Rev. Genet. 14, 168–178 (2013). - PubMed

Publication types

MeSH terms

Substances

LinkOut - more resources