

The metabolomic profile of gamma-irradiated human hepatoma and muscle cells reveals metabolic changes consistent with the Warburg effect
- PMID: 26823999
- PMCID: PMC4730869
- DOI: 10.7717/peerj.1624
The metabolomic profile of gamma-irradiated human hepatoma and muscle cells reveals metabolic changes consistent with the Warburg effect
Abstract
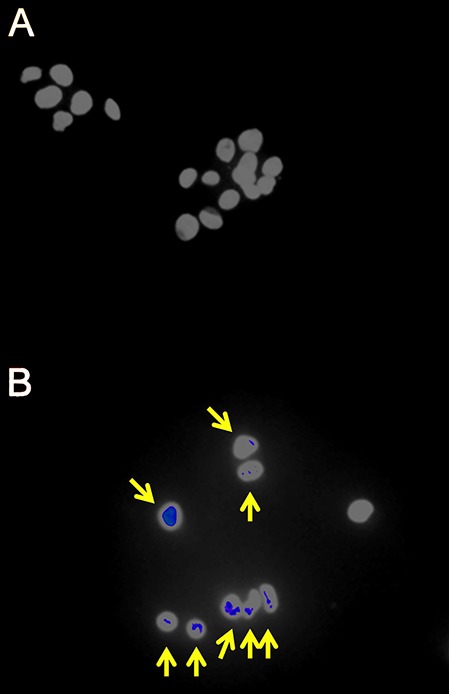
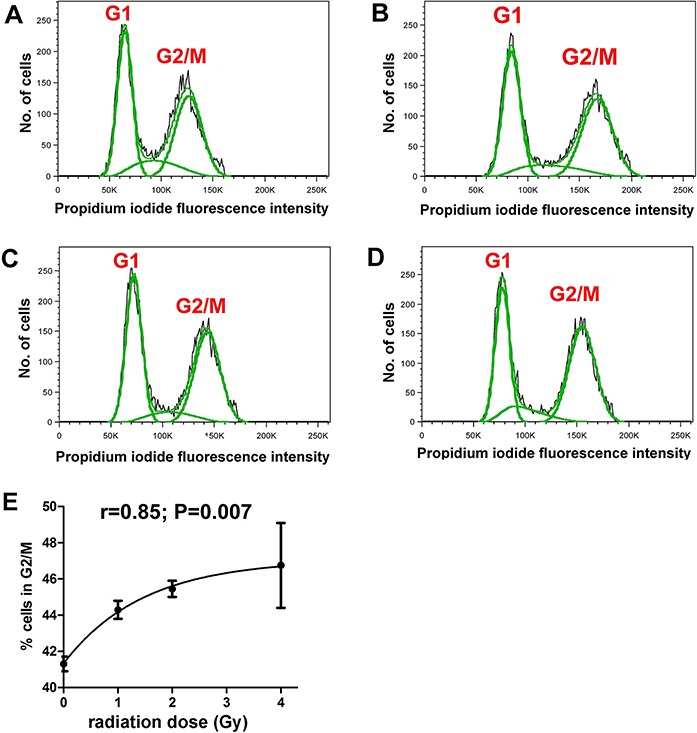
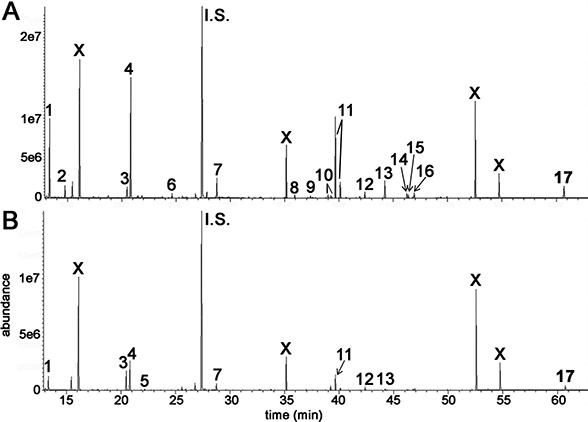
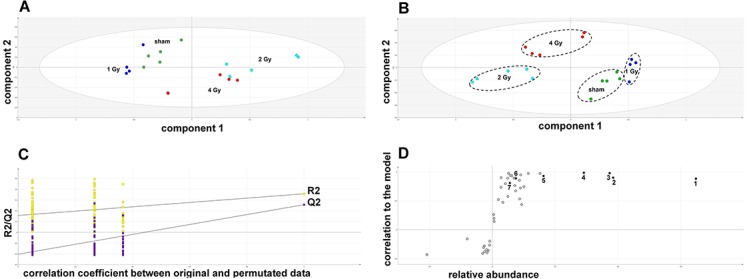
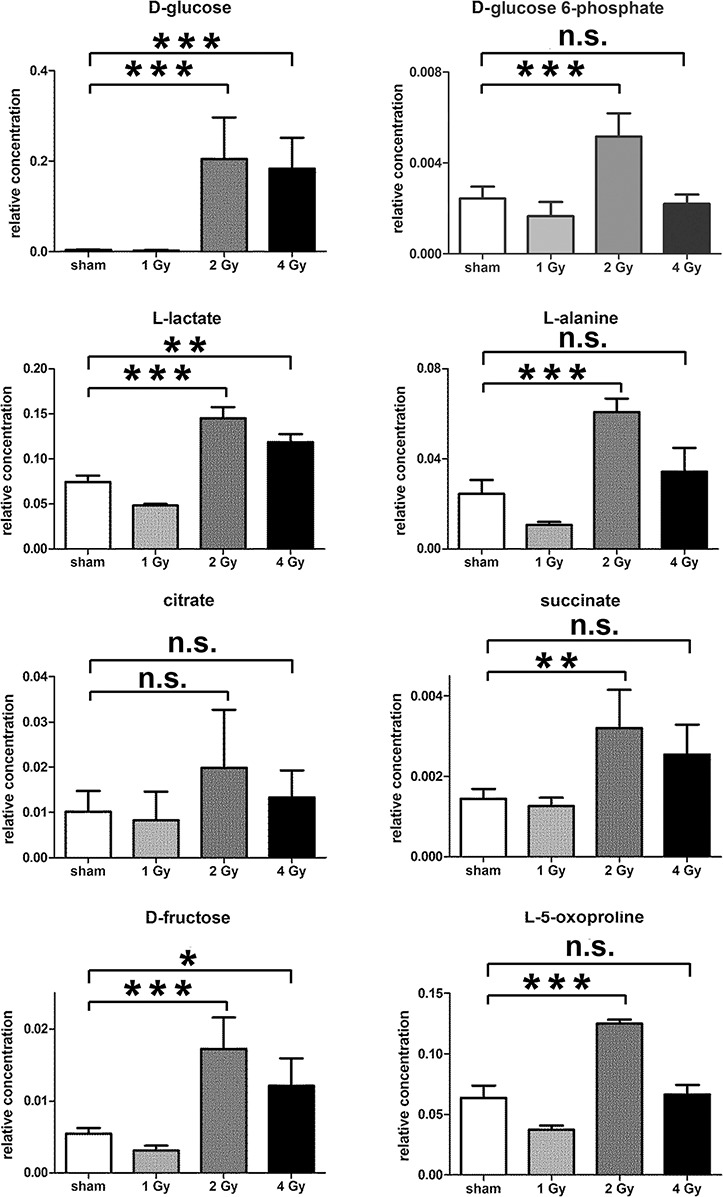
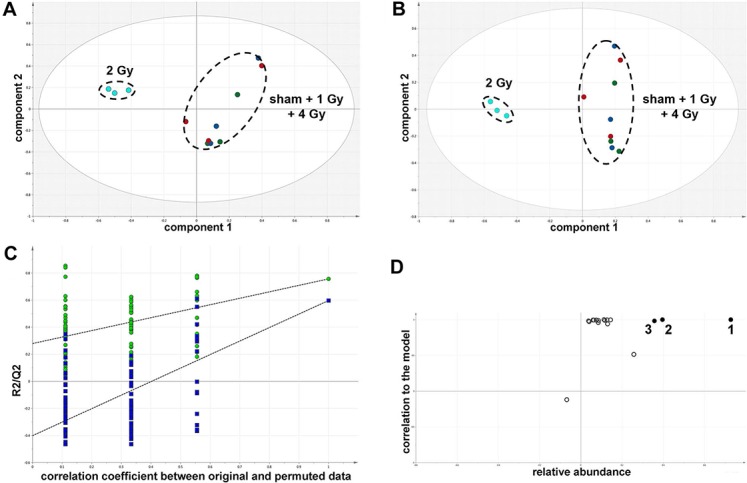
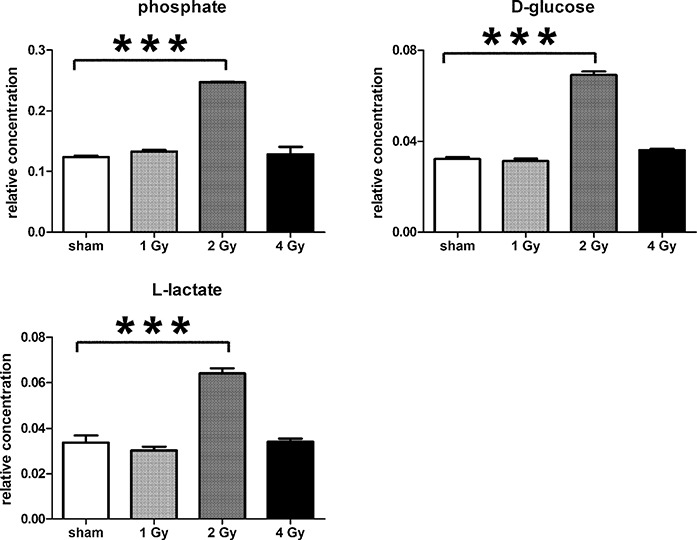
The two human cell lines HepG2 from hepatoma and HMCL-7304 from striated muscle were γ-irradiated with doses between 0 and 4 Gy. Abundant γH2AX foci were observed at 4 Gy after 4 h of culture post-irradiation. Sham-irradiated cells showed no γH2AX foci and therefore no signs of radiation-induced double-strand DNA breaks. Flow cytometry indicated that 41.5% of HepG2 cells were in G2/M and this rose statistically significantly with increasing radiation dose reaching a plateau at ∼47%. Cell lysates from both cell lines were subjected to metabolomic analysis using Gas Chromatography-Mass Spectrometry (GCMS). A total of 46 metabolites could be identified by GCMS in HepG2 cell lysates and 29 in HMCL-7304 lysates, most of which occurred in HepG2 cells. Principal Components Analysis (PCA) showed a clear separation of sham, 1, 2 and 4 Gy doses. Orthogonal Projection to Latent Structures-Discriminant Analysis (OPLS-DA) revealed elevations in intracellular lactate, alanine, glucose, glucose 6-phosphate, fructose and 5-oxoproline, which were found by univariate statistics to be highly statistically significantly elevated at both 2 and 4 Gy compared with sham irradiated cells. These findings suggested upregulation of cytosolic aerobic glycolysis (the Warburg effect), with potential shunting of glucose through aldose reductase in the polyol pathway, and consumption of reduced Glutathione (GSH) due to γ-irradiation. In HMCL-7304 myotubes, a putative Warburg effect was also observed only at 2 Gy, albeit a lesser magnitude than in HepG2 cells. It is anticipated that these novel metabolic perturbations following γ-irradiation of cultured cells will lead to a fuller understanding of the mechanisms of tissue damage following ionizing radiation exposure.
Keywords: GCMS; Gamma-irradiation; HMCL-7304 myotubes; HepG2 cells; Metabolomics; Warburg effect.
Conflict of interest statement
The authors declare that they have no competing interests.
Figures
Similar articles
-
The production and composition of rat sebum is unaffected by 3 Gy gamma radiation.Int J Radiat Biol. 2011 Apr;87(4):360-71. doi: 10.3109/09553002.2010.537432. Epub 2010 Dec 15. Int J Radiat Biol. 2011. PMID: 21158499 Free PMC article.
-
γH2AX formation kinetics in PBMCs of rabbits exposed to acute and fractionated radiation and attenuation of focus frequency through preadministration of a combination of podophyllotoxin and rutin hydrate.Environ Mol Mutagen. 2016 Jul;57(6):455-68. doi: 10.1002/em.22027. Epub 2016 Jun 24. Environ Mol Mutagen. 2016. PMID: 27338557
-
Selection of candidate radiation biomarkers in the serum of rats exposed to gamma-rays by GC/TOFMS-based metabolomics.Radiat Prot Dosimetry. 2013 Apr;154(1):9-17. doi: 10.1093/rpd/ncs138. Epub 2012 Sep 5. Radiat Prot Dosimetry. 2013. PMID: 22951997
-
Translational Metabolomics of Head Injury: Exploring Dysfunctional Cerebral Metabolism with Ex Vivo NMR Spectroscopy-Based Metabolite Quantification.In: Kobeissy FH, editor. Brain Neurotrauma: Molecular, Neuropsychological, and Rehabilitation Aspects. Boca Raton (FL): CRC Press/Taylor & Francis; 2015. Chapter 25. In: Kobeissy FH, editor. Brain Neurotrauma: Molecular, Neuropsychological, and Rehabilitation Aspects. Boca Raton (FL): CRC Press/Taylor & Francis; 2015. Chapter 25. PMID: 26269925 Free Books & Documents. Review.
-
Differential Superiority of Heavy Charged-Particle Irradiation to X-Rays: Studies on Biological Effectiveness and Side Effect Mechanisms in Multicellular Tumor and Normal Tissue Models.Front Oncol. 2016 Feb 25;6:30. doi: 10.3389/fonc.2016.00030. eCollection 2016. Front Oncol. 2016. PMID: 26942125 Free PMC article. Review.
Cited by
-
Metabolomic Analysis of Mice Exposed to Gamma Radiation Reveals a Systemic Understanding of Total-Body Exposure.Radiat Res. 2017 May;187(5):612-629. doi: 10.1667/RR14592.1. Epub 2017 Mar 9. Radiat Res. 2017. PMID: 28467754 Free PMC article.
-
Metabolic rewiring is associated with HPV-specific profiles in cervical cancer cell lines.Sci Rep. 2021 Sep 6;11(1):17718. doi: 10.1038/s41598-021-96038-8. Sci Rep. 2021. PMID: 34489482 Free PMC article.
-
Hepatitis C Virus Infection Upregulates Plasma Phosphosphingolipids and Endocannabinoids and Downregulates Lysophosphoinositols.Int J Mol Sci. 2023 Jan 11;24(2):1407. doi: 10.3390/ijms24021407. Int J Mol Sci. 2023. PMID: 36674922 Free PMC article.
-
Metabolic Hijacking of Hexose Metabolism to Ascorbate Synthesis Is the Unifying Biochemical Basis of Murine Liver Fibrosis.Cells. 2023 Feb 2;12(3):485. doi: 10.3390/cells12030485. Cells. 2023. PMID: 36766828 Free PMC article.
-
Influence of grape consumption on the human microbiome.Sci Rep. 2023 May 12;13(1):7706. doi: 10.1038/s41598-023-34813-5. Sci Rep. 2023. PMID: 37173385 Free PMC article.
References
-
- Aebi H, Bernays L, Fluckiger H, Schmidli B, Zuppinger A. Taurine excretion in roentgen and betatron-irradiated rats. Helvetica Physiol Pharmacol Acta. 1955;13:C49–C51. - PubMed
-
- Awapara J. The taurine concentration of organs from fed and fasted rats. Journal of Biological Chemistry. 1956;218:571–576. - PubMed
Grants and funding
LinkOut - more resources
Full Text Sources
Other Literature Sources
