. 2016 Jan 29:7:10478.
doi: 10.1038/ncomms10478.

DNA methylation outliers in normal breast tissue identify field defects that are enriched in cancer

Affiliations

DNA methylation outliers in normal breast tissue identify field defects that are enriched in cancer

Andrew E Teschendorff et al. Nat Commun. .

Abstract

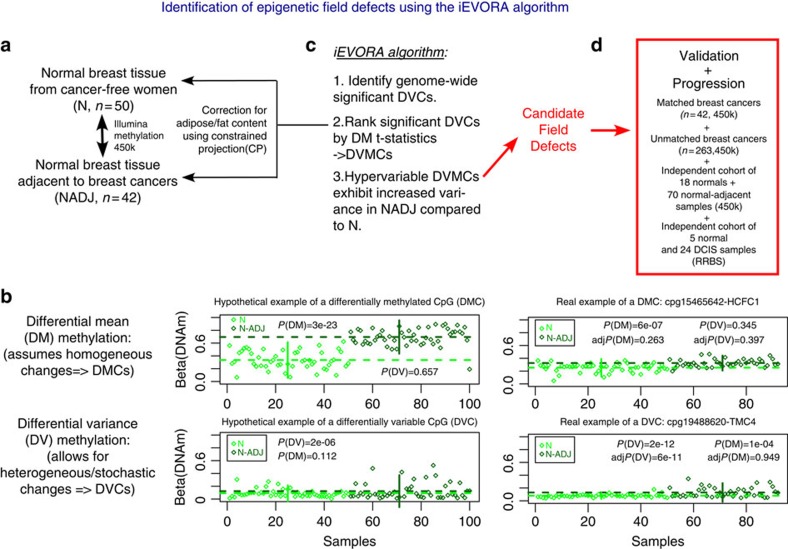
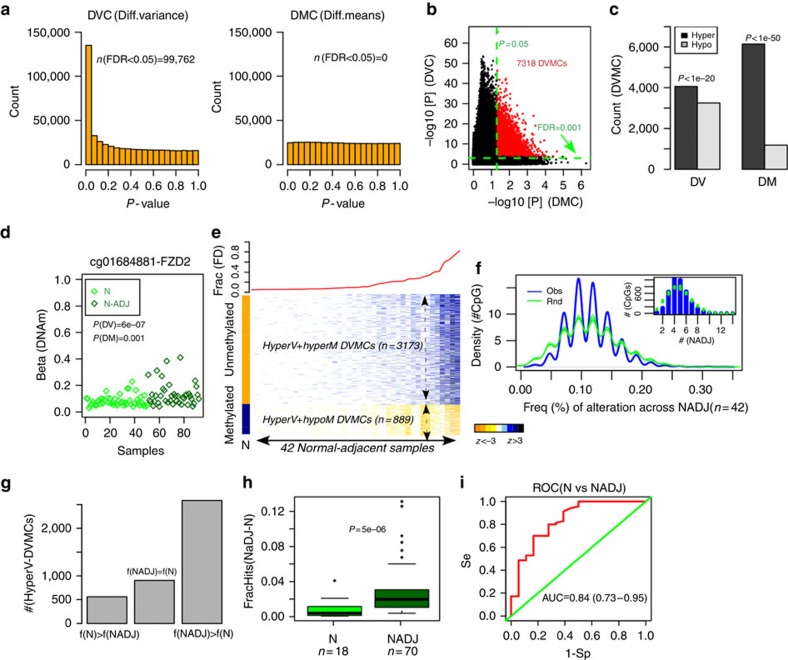
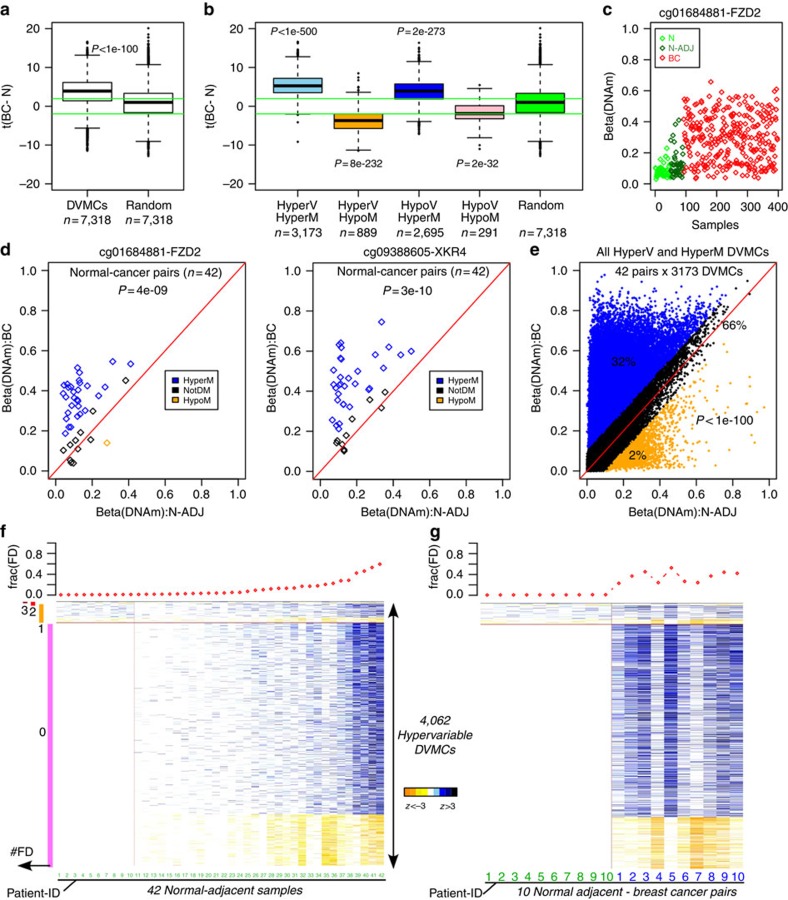
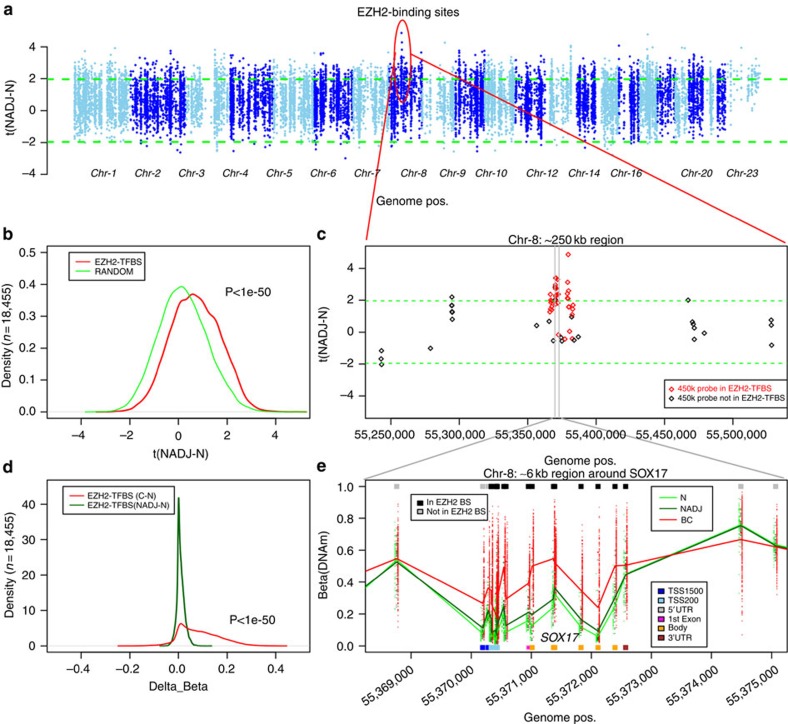
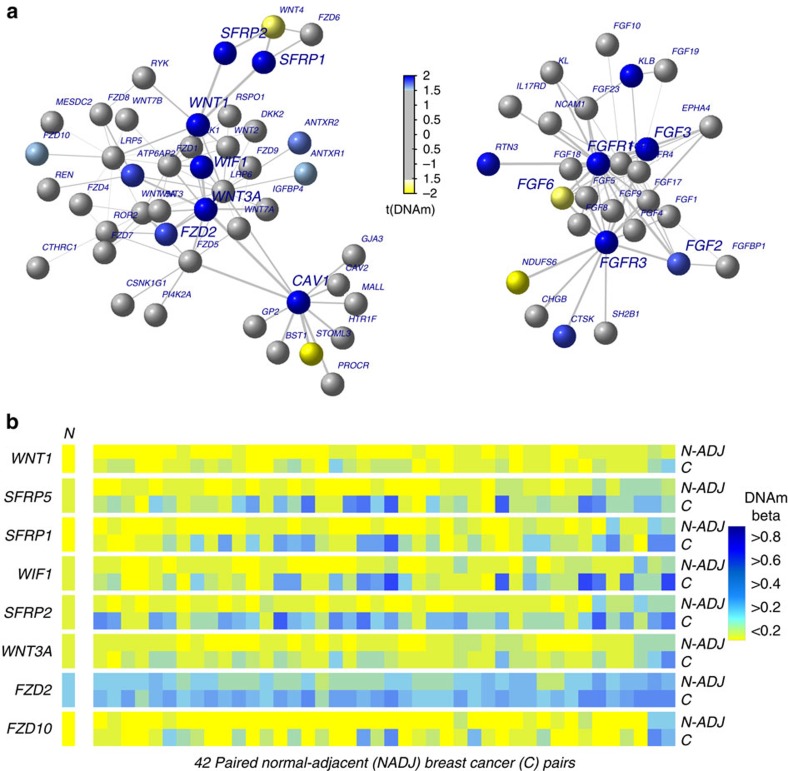
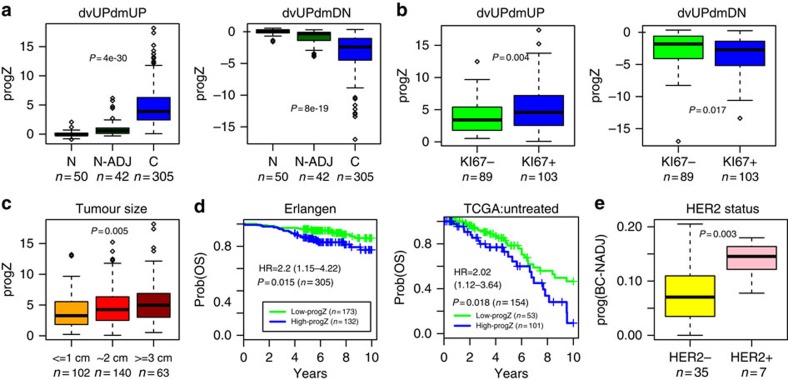
Identifying molecular alterations in normal tissue adjacent to cancer is important for understanding cancer aetiology and designing preventive measures. Here we analyse the DNA methylome of 569 breast tissue samples, including 50 from cancer-free women and 84 from matched normal cancer pairs. We use statistical algorithms for dissecting intra- and inter-sample cellular heterogeneity and demonstrate that normal tissue adjacent to breast cancer is characterized by tens to thousands of epigenetic alterations. We show that their genomic distribution is non-random, being strongly enriched for binding sites of transcription factors specifying chromatin architecture. We validate the field defects in an independent cohort and demonstrate that over 30% of the alterations exhibit increased enrichment within matched cancer samples. Breast cancers highly enriched for epigenetic field defects, exhibit adverse clinical outcome. Our data support a model where clonal epigenetic reprogramming towards reduced differentiation in normal tissue is an important step in breast carcinogenesis.


Figures

Figure 1
Figure 1. Overall analytic strategy for identifying and validating field defects in breast cancer.
(a) Aim is to identify DNA methylation changes between normal tissue from cancer-free women (N) and age-matched normal samples adjacent to breast cancers (NADJ). This is done correcting for variable adipose/fat content across breast tissue samples and then performing a supervised analysis. (b) Two feature selection paradigms are possible: (i) a standard paradigm by which we select differentially methylated CpGs (DMCs) and which assumes homogeneity within the phenotypes being compared, (ii) a novel paradigm, based on the notion of differential variability (DV), which allows for heterogeneous/stochastic changes, and which identifies differentially variable CpGs (DVCs). Profiles to the left depict theoretical examples of a DMC and DVC. P-values are from a t-test for the case of assessing differential methylation (DM), and from a Bartlett's test for the case of assessing DV. Horizontal dashed lines indicate the mean DNA methylation value, vertical lines indicate the variance (±1.96 standard deviation). To the right, we depict real examples of a top ranked DMC and DVC derived from comparing N to NADJ samples. We give the P-values (P) and adjusted P-values (adjP: adjusted for multiple testing) for the case of t-tests (DM) and Bartlett's test (DV). Horizontal dashed lines indicate the mean DNA methylation value, vertical lines indicate the variance (±1.96 s.d.). Note that for the DVC, the main distinguishing feature is the variance, not the mean. (c) The iEVORA algorithm posits that relevant field defects are identified by first using a test for DV to select significant DVCs, and then ranking significant DVCs by a DM t-statistic. This results in differentially variable and differentially methylated CpGs (DVMCs). Those exhibiting increased variance in the NADJ samples represent candidate field defects. (d) Validation of field defects using matched and unmatched breast cancer samples, to assess if field defects progress or become enriched in the invasive cancer state, as well as validation of field defects in independent cohorts.
Figure 2
Figure 2. Identification of stochastic DNA methylation field defects in breast cancer and validation.
(a) Histograms of P-values from Bartlett's test (DVC-differentially variable CpGs) and t-tests (DMC-differentially methylated CpGs) comparing 50 normal breast tissue samples from healthy women to 42 normal-adjacent samples from breast cancer patients. The number of probes passing an FDR-corrected threshold of 0.05 are shown. (b) Definition of the 7,318 differentially variable and differentially methylated CpGs (DVMCs), as those probes passing an FDR threshold for DV of 0.001 and an uncorrected P-value threshold for DM of 0.05. (c) Relative numbers of DVMCs that are hyper-or-hypovariable (DV), and hyper-or-hypomethyled (DM). Binomial P-values are given. (d) The DNAm profile of a hypervariable+hypermethylated DVMC. Y axis labels the DNA methylation beta-value, x -axis labels the samples. P-values shown are for a Bartlett's test, which tests for DV, and for a t-test, which tests for differential average methylation (DM). (e) Upper panel: fraction of hypervariable DVMCs significantly altered in each normal-adjacent sample, with samples ordered in increasing order. Left colour bar depicts the average DNAm beta-value of the hypervariable DVMCs across the 50 normal samples from cancer-free women. Orange: beta-value<0.2, blue: beta-value>0.6. Heat map depicts the z-scores of differential DNAm change for each DVMC and normal-adjacent sample relative to the normal state, with samples ordered according to the overall fraction of alteration. (f) Density-histogram plot of the number of hypervariable DVMCs exhibiting a given fraction of DNAm alterations across the 42 normal-adjacent samples (blue curve). In green, we show the density obtained from Monte-Carlo randomization. Inlet figure depicts the same data, but using absolute numbers of CpGs (y axis) and actual numbers of normal-adjacent samples. (g) Relative numbers of hypervariable DVMCs shown in heat map of e, which show a lower [f(N)>f(NADJ)], equal [f(NADJ)=f(N)] or higher frequency of alteration [f(NADJ)>f(N)] in an independent set of normal adjacent (NADJ) samples compared with normals (N). (h) Box plot comparing the frequency of alteration of hyper-DVMCs (y-axis: FracHits) in the independent set of normal-adjacent (NADJ) and normal (N) samples. P-value is from a Wilcoxon rank sum test. (i) Receiver operating curve (ROC)-curve and AUC value plus 95% confidence interval corresponding to h.
Figure 3
Figure 3. Progression of field defects in breast cancer.
(a) Box plot of t-statistics of differential DNA methylation between the 305 breast cancer (BC) patients and the 50 normals (N) from healthy women (y axis: t(BC-N)) for the 7,318 DVMCs, compared with a random selection of CpGs. Positive t-statistics indicate larger DNAm values in BC compared with N. Wilcoxon-rank sum test P-value is given. Horizontal green lines indicate the lines of P=0.05. (b) As a, but with the DVMCs broken up into four categories, according to whether CpG is hypervariable or hypovariable and whether the difference in mean DNA methylation is increased (hypermethylated) or decreased (hypomethylated) in the 42 normal adjacent samples compared with the 50 true normals. (c) Example of a DNAm profile of a hypervariable and hypermethylated DVMC, showing the progressive change in DNA methylation. (d) Scatter plots of DNA methylation for two DVMCs, restricting to the 42 matched normal–tumour pairs, with x axis labelling the beta-value in the normal adjacent sample, and y axis labelling the corresponding beta-value in the matched breast tumour. Paired Wilcoxon test P-values are given. Blue and orange points represent breast cancer patients for which the change in mean DNA methylation between normal-adjacent and cancer was larger than 0.1 in absolute terms, with blue indicating hypermethylation and orange hypomethylation. (e) As d, but now for all 3,173 hypervariable and hypermethylated DVMCs superimposed on same plot. We provide the proportion of data points that exhibit hypermethylation (blue), no significant changes (black), and hypomethylation (orange). (f) Top plot shows the fraction of hypervariable DVMCs (aka field defects, frac(FD)) significantly altered in each normal-adjacent sample, with samples ordered in increasing order. Left colour bars mark the DVMCs with the number of significant DNAm alterations that they exhibit across the ten samples exhibiting the lowest fractions of alterations. Heat map depicts the z-scores of differential DNAm change for each DVMC and normal-adjacent sample relative to the normal-state, with samples ordered according to the overall fraction of alteration. (g) As f, but now restricting to the ten normal-adjacent breast cancer pairs corresponding to the ten patients with the lowest fractions of DNAm alterations in normal-adjacent tissue.
Figure 4
Figure 4. Enrichment of EZH2 TF-binding sites among DNA methylation field defects.
(a) Manhattan type plot of the t-statistics of differential DNA methylation between normal adjacent (NADJ) and normal breast tissue (N; y axis: t(NADJ-N)) of 450k probes mapping to EZH2-binding sites (18,455 sites). Green dashed lines represent the lines corresponding to P=0.05. Positive values indicate larger DNAm in NADJ tissue compared with normals. (b) Density distribution of the t-statistics of differential methylation between normal adjacent (NADJ) and normal breast tissue (N) of 450k probes mapping to EZH2-binding sites (red) compared with a randomly chosen set (green). P-value is from a Wilcoxon rank sum test. (c) Zoomed in version of a focusing on a 250-kb region on chromosome-8, but now showing all 450k probes in the region, with those mapping to EZH2-binding sites indicated in red. (d) Comparison of the density distribution of average differences in DNA methylation (x axis: delta_Beta) for the 18,455 probes mapping to EZH2-binding sites (EZH2 TFBS) between cancer and normal adjacent tissue (C-N), to the corresponding differences between normal adjacent and normal tissue (NADJ-N). Thus, positive delta_Beta values correspond to higher DNAm values in cancer compared with normal (C-N), or to higher DNAm values in NADJ tissue compared with normal (NADJ-N). (e) DNA methylation beta values for all samples and probes in an ∼6-kb region, centred around the PRC2 target, SOX17. The lines represent the mean DNAm values in each group: normal (N), normal-adjacent (NADJ) and breast cancer (BC). Probes/CpGs have been annotated according to whether they fall in a EZH2-binding site, and which gene region they map to.
Figure 5
Figure 5. Field defects are enriched for WNT and FGF signalling pathways.
(a) Examples of two interactome hotspots of epigenetic deregulation comparing normal-adjacent to normal-healthy samples, inferred using the EpiMod/FEM algorithm. In colour, we indicate the nodes exhibiting significant DNA methylation changes. (b) Heat maps of DNA methylation of WNT-signalling pathway members for the 42 matched normal-adjacent (N-ADJ) breast cancer (BC) pairs. In the case of the normal samples from healthy subjects (N), we show the average DNA methylation values across all 50 samples.
Figure 6
Figure 6. Progression of field defects correlate with proliferation and overall survival.
(a) Box plots of progression Z-scores against sample status (N=normal-healthy, NADJ=normal adjacent, C=breast cancer) for each class of DVMC. P-values are from a linear regression. (b) Box plots of the same progression Z-scores against the proliferation index (KI67) for each class of DVMC. P-values are from a Wilcoxon-rank sum test. (c) Box plot of the progression Z-score of the DVMCs hypervariable and hypermethylated in normal-adjacent compared with normal-healthy, against tumour size. P-value is from a linear regression. (d) Kaplan–Meier survival curves for breast tumours stratified into groups of low and high progression Z-scores. Hazard ratio, 95% confidence interval and Cox-regression χ2 test P-value are given. Groups were obtained by clustering the progression Z-scores of all samples into two groups using the pam-algorithm from the cluster R package. (e) Box plot of the individualized progression deviation score for each of the 42 breast cancer patients with a matched normal-adjacent sample, against HER2 status. P-value is from a Wilcoxon rank sum test.

Similar articles

Cited by

References

    1. Maley C. C. et al.. Genetic clonal diversity predicts progression to esophageal adenocarcinoma. Nature Genet. 38, 468–473 (2006). - PubMed
    1. Gerlinger M. et al.. Intratumor heterogeneity and branched evolution revealed by multiregion sequencing. N. Engl. J. Med. 366, 883–892 (2012). - PMC - PubMed
    1. Alizadeh A. A. et al.. Toward understanding and exploiting tumor heterogeneity. Nature Med. 21, 846–853 (2015). - PMC - PubMed
    1. Shah S. P. et al.. Mutational evolution in a lobular breast tumour profiled at single nucleotide resolution. Nature 461, 809–813 (2009). - PubMed
    1. Merlo L. M., Pepper J. W., Reid B. J. & Maley C. C. Cancer as an evolutionary and ecological process. Nat. Rev. Cancer 6, 924–935 (2006). - PubMed

Publication types