

Characterization of Heterogeneous Prostate Tumors in Targeted Pten Knockout Mice
- PMID: 26807730
- PMCID: PMC4726760
- DOI: 10.1371/journal.pone.0147500
Characterization of Heterogeneous Prostate Tumors in Targeted Pten Knockout Mice
Abstract
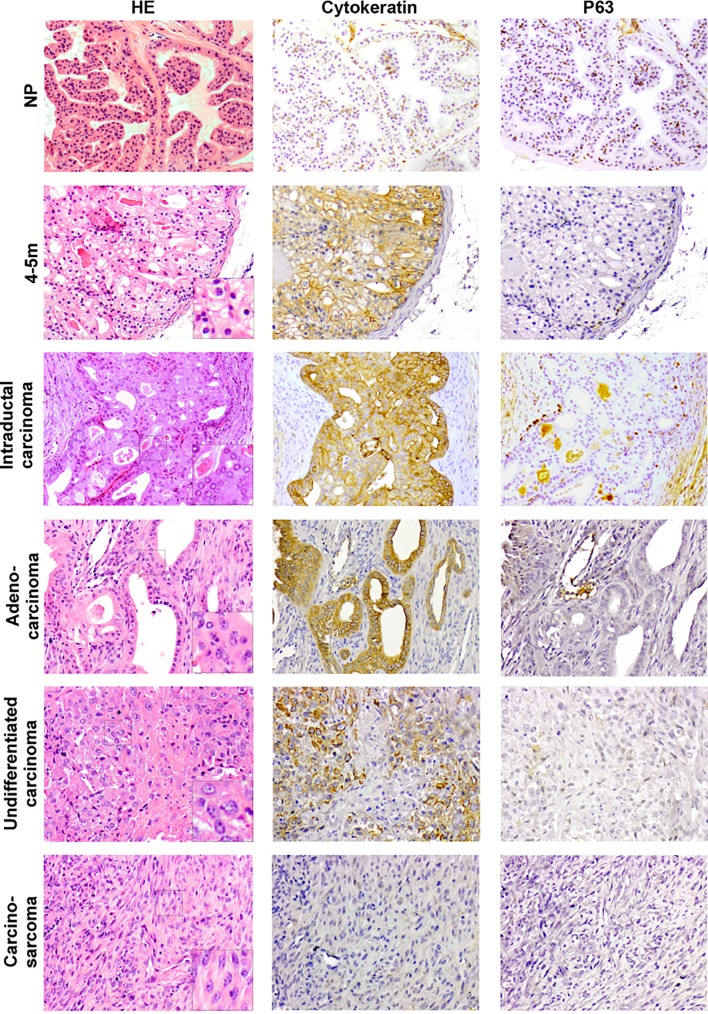
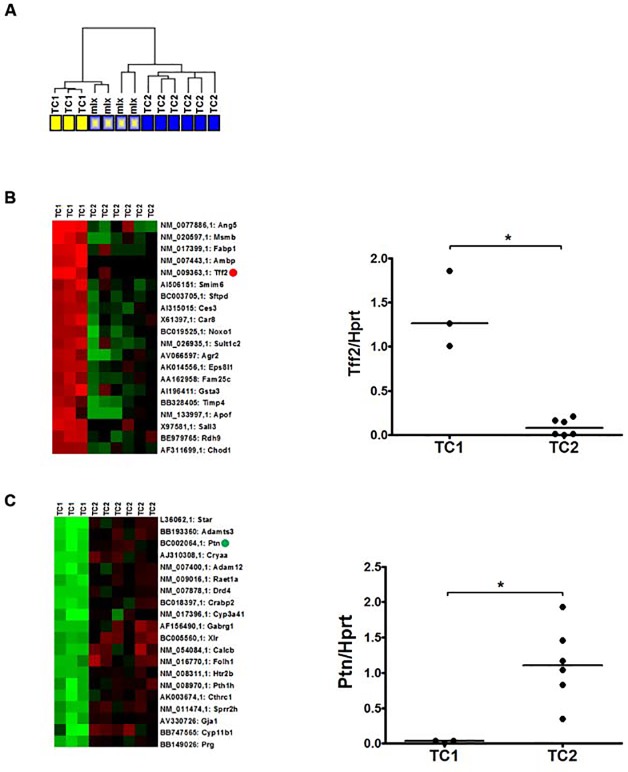
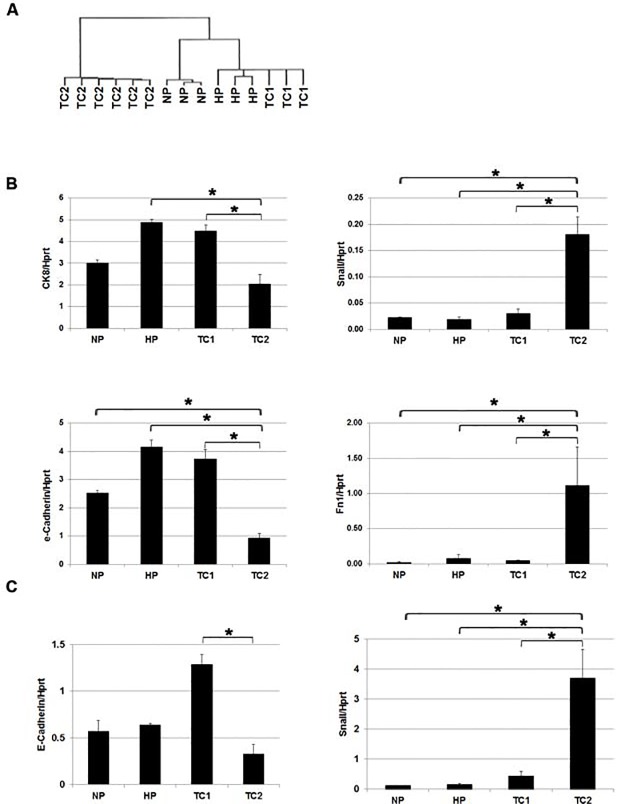
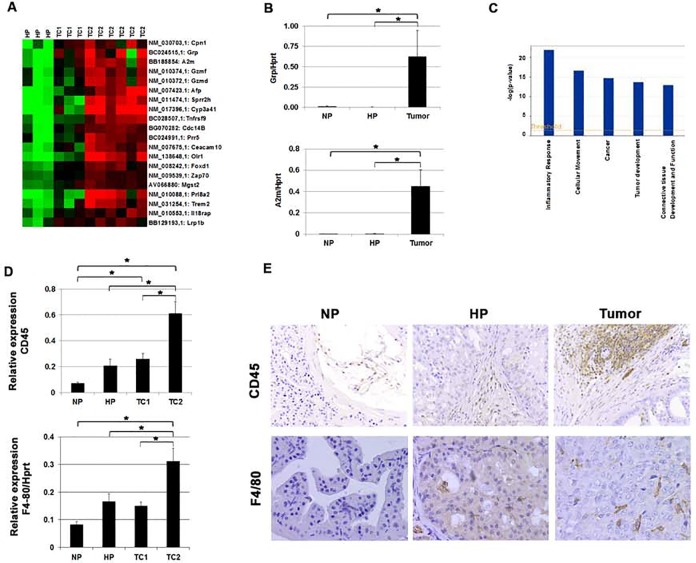
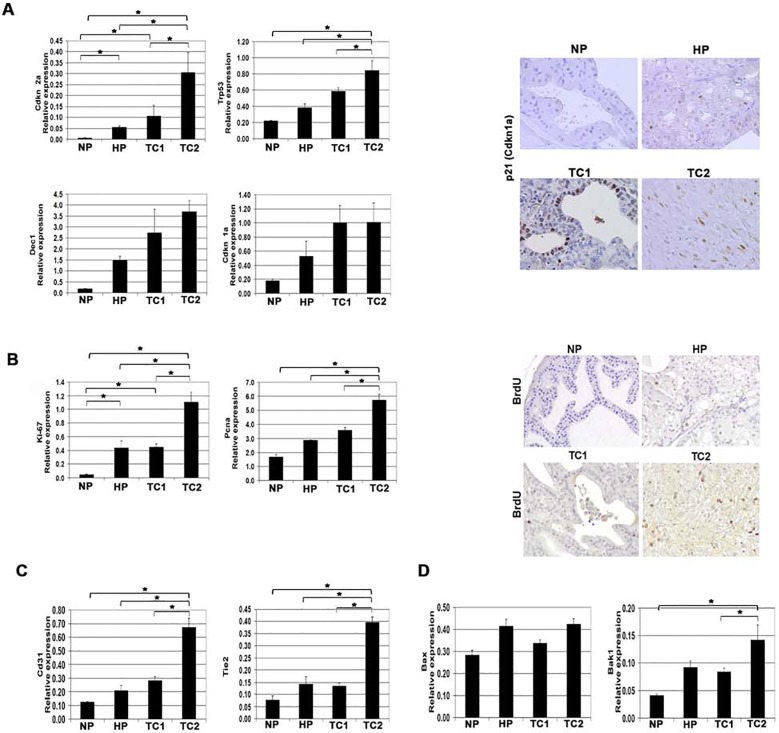
Previously, we generated a preclinical mouse prostate tumor model based on PSA-Cre driven inactivation of Pten. In this model homogeneous hyperplastic prostates (4-5m) developed at older age (>10m) into tumors. Here, we describe the molecular and histological characterization of the tumors in order to better understand the processes that are associated with prostate tumorigenesis in this targeted mouse Pten knockout model. The morphologies of the tumors that developed were very heterogeneous. Different histopathological growth patterns could be identified, including intraductal carcinoma (IDC), adenocarcinoma and undifferentiated carcinoma, all strongly positive for the epithelial cell marker Cytokeratin (CK), and carcinosarcomas, which were negative for CK. IDC pattern was already detected in prostates of 7-8 month old mice, indicating that it could be a precursor stage. At more than 10 months IDC and carcinosarcoma were most frequently observed. Gene expression profiling discriminated essentially two molecular subtypes, denoted tumor class 1 (TC1) and tumor class 2 (TC2). TC1 tumors were characterized by high expression of epithelial markers like Cytokeratin 8 and E-Cadherin whereas TC2 tumors showed high expression of mesenchyme/stroma markers such as Snail and Fibronectin. These molecular subtypes corresponded with histological growth patterns: where TC1 tumors mainly represented adenocarcinoma/intraductal carcinoma, in TC2 tumors carcinosarcoma was the dominant growth pattern. Further molecular characterization of the prostate tumors revealed an increased expression of genes associated with the inflammatory response. Moreover, functional markers for senescence, proliferation, angiogenesis and apoptosis were higher expressed in tumors compared to hyperplasia. The highest expression of proliferation and angiogenesis markers was detected in TC2 tumors. Our data clearly showed that in the genetically well-defined PSA-Cre;Pten-loxP/loxP prostate tumor model, histopathological, molecular and biological heterogeneity occurred during later stages of tumor development.
Conflict of interest statement
Figures
Similar articles
-
Targeted biallelic inactivation of Pten in the mouse prostate leads to prostate cancer accompanied by increased epithelial cell proliferation but not by reduced apoptosis.Cancer Res. 2005 Jul 1;65(13):5730-9. doi: 10.1158/0008-5472.CAN-04-4519. Cancer Res. 2005. PMID: 15994948
-
Accumulating progenitor cells in the luminal epithelial cell layer are candidate tumor initiating cells in a Pten knockout mouse prostate cancer model.PLoS One. 2009 May 22;4(5):e5662. doi: 10.1371/journal.pone.0005662. PLoS One. 2009. PMID: 19461893 Free PMC article.
-
Tumor heterogeneity, aggressiveness, and immune cell composition in a novel syngeneic PSA-targeted Pten knockout mouse prostate cancer (MuCaP) model.Prostate. 2018 Sep;78(13):1013-1023. doi: 10.1002/pros.23659. Epub 2018 May 29. Prostate. 2018. PMID: 30133757
-
Prostate-Specific G-Protein Coupled Receptor, an Emerging Biomarker Regulating Inflammation and Prostate Cancer Invasion.Curr Mol Med. 2016;16(6):526-32. doi: 10.2174/1566524016666160607091333. Curr Mol Med. 2016. PMID: 27280498 Review.
-
Molecular markers to identify patients at risk for recurrence after primary treatment for prostate cancer.Urology. 2003 Dec 29;62 Suppl 1:19-35. doi: 10.1016/j.urology.2003.10.007. Urology. 2003. PMID: 14747039 Review.
Cited by
-
Spatial aspects of oncogenic signalling determine the response to combination therapy in slice explants from Kras-driven lung tumours.J Pathol. 2018 May;245(1):101-113. doi: 10.1002/path.5059. Epub 2018 Apr 2. J Pathol. 2018. PMID: 29443392 Free PMC article.
-
Stromal AR inhibits prostate tumor progression by restraining secretory luminal epithelial cells.Cell Rep. 2022 May 24;39(8):110848. doi: 10.1016/j.celrep.2022.110848. Cell Rep. 2022. PMID: 35613593 Free PMC article.
-
Withaferin A Inhibits Prostate Carcinogenesis in a PTEN-deficient Mouse Model of Prostate Cancer.Neoplasia. 2017 Jun;19(6):451-459. doi: 10.1016/j.neo.2017.04.005. Epub 2017 May 7. Neoplasia. 2017. PMID: 28494348 Free PMC article.
-
Loss of Ceacam1 promotes prostate cancer progression in Pten haploinsufficient male mice.Metabolism. 2020 Jun;107:154215. doi: 10.1016/j.metabol.2020.154215. Epub 2020 Mar 21. Metabolism. 2020. PMID: 32209360 Free PMC article.
-
Correlation of Prostate Cancer CHD1 Status with Response to Androgen Deprivation Therapy: a Pilot Study.J Genitourin Disord. 2018;2(1):1006. Epub 2018 Jul 31. J Genitourin Disord. 2018. PMID: 30714046 Free PMC article.
References
Publication types
MeSH terms
Substances
Grants and funding
LinkOut - more resources
Full Text Sources
Other Literature Sources
Medical
Molecular Biology Databases
Research Materials
Miscellaneous
