. 2016 Jan 20;11(1):e0147344.
doi: 10.1371/journal.pone.0147344. eCollection 2016.

ZEB1 Mediates Acquired Resistance to the Epidermal Growth Factor Receptor-Tyrosine Kinase Inhibitors in Non-Small Cell Lung Cancer

Affiliations

ZEB1 Mediates Acquired Resistance to the Epidermal Growth Factor Receptor-Tyrosine Kinase Inhibitors in Non-Small Cell Lung Cancer

Takeshi Yoshida et al. PLoS One. .

Abstract

Epithelial-mesenchymal transition (EMT) is one mechanism of acquired resistance to inhibitors of the epidermal growth factor receptor-tyrosine kinases (EGFR-TKIs) in non-small cell lung cancer (NSCLC). The precise mechanisms of EMT-related acquired resistance to EGFR-TKIs in NSCLC remain unclear. We generated erlotinib-resistant HCC4006 cells (HCC4006ER) by chronic exposure of EGFR-mutant HCC4006 cells to increasing concentrations of erlotinib. HCC4006ER cells acquired an EMT phenotype and activation of the TGF-β/SMAD pathway, while lacking both T790M secondary EGFR mutation and MET gene amplification. We employed gene expression microarrays in HCC4006 and HCC4006ER cells to better understand the mechanism of acquired EGFR-TKI resistance with EMT. At the mRNA level, ZEB1 (TCF8), a known regulator of EMT, was >20-fold higher in HCC4006ER cells than in HCC4006 cells, and increased ZEB1 protein level was also detected. Furthermore, numerous ZEB1 responsive genes, such as CDH1 (E-cadherin), ST14, and vimentin, were coordinately regulated along with increased ZEB1 in HCC4006ER cells. We also identified ZEB1 overexpression and an EMT phenotype in several NSCLC cells and human NSCLC samples with acquired EGFR-TKI resistance. Short-interfering RNA against ZEB1 reversed the EMT phenotype and, importantly, restored erlotinib sensitivity in HCC4006ER cells. The level of micro-RNA-200c, which can negatively regulate ZEB1, was significantly reduced in HCC4006ER cells. Our results suggest that increased ZEB1 can drive EMT-related acquired resistance to EGFR-TKIs in NSCLC. Attempts should be made to explore targeting ZEB1 to resensitize TKI-resistant tumors.


Conflict of interest statement

Competing Interests: The authors have declared that no competing interests exist.

Figures

Fig 1
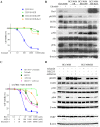
Fig 1. Characterization of HCC4006ER cells, which are highly resistant to erlotinib or the irreversible EGFR-TKI CL387,785.
A, HCC4006 and HCC4006ER cells were treated for 72 hours with increasing concentrations of erlotinib or CL387,785. Data generated by cell viability assay (CellTiter-Glo) are expressed as a percentage of the value for untreated cells. The error bars represent SEM of 3 independent experiments. B, HCC4006 and HCC4006ER cells were incubated for 24 hours at ~80–90% of cell confluence. Whole cell lysate of each cell line was collected and subjected to Proteome Profiler Human Phospho-RTK Array Kit to examine the phosphorylation levels of multiple RTKs. Detected phospho-RTKs on the array are circled. The spots in the four corners of the RTK array are positive controls. C, HCC4006 and HCC4006ER cells were incubated for 6 hours ± erlotinib (1 μM). Cell lysates were subjected to protein expression analysis with antibodies to pEGFR, EGFR, pMET, MET, pHer3, Her3, PTEN, pAkt, Akt, pErk, Erk, and β-actin.
Fig 2
Fig 2. Neither Her3 loss nor persistent activation of pAkt and pErk is essential for the resistance in HCC4006ER cells.
A, HCC4006ER cells with stable GFP or Her3 overexpression (HCC4006ER-GFP and HCC4006ER-Her3 cells) as well as HCC4006 and the original HCC4006ER cells were treated for 72 hours with increasing concentrations of erlotinib. Data generated by cell viability assay (CellTiter-Glo) are expressed as a percentage of the value for untreated cells. The error bars represent SEM of 3 independent experiments. B, HCC4006, HCC4006ER, HCC4006ER-GFP, and HCC4006ER-Her3 cells were incubated for 6 hours ± erlotinib (1 μM). Cell lysates were subjected to protein expression analysis with antibodies to Her3, pEGFR, EGFR, PTEN, pAkt, Akt, pErk, Erk, and β-actin. C, HCC4006ER cells were treated for 72 h with increasing concentrations of erlotinib alone, BEZ235 alone, AZD6244 alone, or BEZ235 and AZD6244 in combination. HCC4006 cells were treated for 72 hours with increasing concentrations of erlotinib for 72 hours to plot a reference curve. Data generated by cell viability assay (CellTiter-Glo) are expressed as a percentage of the value for untreated cells. The error bars represent SEM of 3 independent experiments. Combination index (CI) at IC50 dose of BEZ235 combined with AZD6244 was calculated by CompuSyn software. CI>1, CI = 1, and CI<1 indicate antagonistic, additive, and synergistic effects, respectively. D, Both HCC4006 and HCC4006ER cells were incubated for 6 or 24 hours ± erlotinib (1 μM), BEZ235 (500 nM), or AZD6244 (1 μM) as indicated. Cell lysates were subjected to protein expression analysis with antibodies to pEGFR, EGFR, pAkt, Akt, pErk, and Erk (samples of 6 hours) or to PARP along with antibodies to β-actin as a loading control (samples of 24 hours).
Fig 3
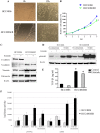
Fig 3. HCC4006ER cells have EMT-phenotype with activation of TGF-β/SMAD signaling.
A, Monolayers of HCC4006 and HCC4006ER cells were scraped in a straight line with a 1000-μL pipette tip. Monolayer photos with scratches were taken after 12-hour incubation. B, HCC4006 and HCC4006ER cells were plated at 1x10³ cells/well in black wall 96-well plates, incubated in RPMI with 10% FBS, and allowed to grow for indicated days. Data generated by cell viability assay (CellTiter-Glo) are expressed as a percentage of the value for untreated cells. Determinations were done in triplicate. Bars, SEM. *P < 0.0001 for HCC4006 versus HCC4006ER (Student t test). C, HCC4006 and HCC4006ER cells were incubated for 6 hours ± erlotinib (1 μM). Cell lysates were subjected to protein expression analysis with antibodies to E-cadherin, N-cadherin, vimentin, fibronectin, and β-actin. D, HCC4006 and HCC4006ER cells were incubated for 6 hours ± TGF-β1 (10 ng/ml) or erlotinib (1 μM), as indicated. Cell lysates were subjected to protein expression analysis with antibodies to pSMAD2 and to β-actin. E, HCC4006 or HCC4006ER cells were incubated overnight. Medium was replaced with serum-free RPMI with or without erlotinib (1 μM) and incubated for an additional 24 hours. Supernatants were collected and subjected to TGF-β1 ELISA. Determinations were done in triplicate. Bars, SEM. *P < 0.0001 versus HCC4006 cells with or without erlotinib treatment (Student t test). F, TGF-β-induced transcription is increased by co-treatment with TGF-β and erlotonib in transient and transfections with TGF-β-responsive luciferase constructs. HCC4006 and HCC4006ER cells were transiently transfected with p3TP-Lux reporter or pSBE4 and treated with DMSO, 5 ng/mL TGF-β1, 1 μM erlotinib, or a combination of 5 ng/mL TGF-β1 and 1 μM erlotinib for 48 hours. After 48 hours, luciferase activity was determined as described in Materials and Methods.
Fig 4
Fig 4. Effects of reagents against EMT-related pathways on cell growth in HCC4006ER cells.
A, HCC4006ER cells were treated for 72 hours with increasing concentrations of indicated reagents ± erlotinib. HCC4006 cells were treated for 72 hours with increasing concentrations of erlotinib for 72 hours to plot a reference curve. Data generated by cell viability assay (CellTiter-Glo) are expressed as a percentage of the value for untreated cells. The error bars represent SEM of 3 independent experiments. Combination index (CI) at IC50 dose of each combination treatment was calculated by CompuSyn software. CI>1, CI = 1, and CI<1 indicate antagonistic, additive and synergistic effects, respectively. B, HCC4006ER cells were treated for 72 hours with increasing concentrations of erlotinib, following treatment of PD173074 (1 μM), LY364947 (1 μM), LBH589 (10 nM), salinomycin (100 nM), or IWP2 (1 μM) for 14 days. Data generated by cell viability assay (CellTiter-Glo) are expressed as a percentage of the value for untreated cells. The error bars represent SEM of 3 independent experiments.
Fig 5
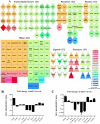
Fig 5. Gene expression microarray revealed that ZEB1 is a critical gene in HCC4006ER cells.
A, An enrichment and classification analyses using our microarray results were performed by MetaCore and Cytoscape. On the heatmap, 167 genes were selected as important genes in HCC4006ER cells by setting the cutoff at ≥7 connections in the whole network. The color represents the fold-change (HCC4006ER/HCC4006) by comparing the intensity of gene probes from our microarray. B, Representative ZEB1-responsive genes or EMT-related genes were selected from our microarray to show the fold-change (HCC4006ER/HCC4006) in the bar graph. C, mRNA levels of indicated ZEB1 responsive genes in HCC4006 and HCC4006ER cells were measured by quantitative real-time RT-PCR. Values are expressed as fold-change between HCC4006 and HCC4006ER cells (HCC4006ER/HCC4006). Determinations were done in triplicate. Bars, SD.
Fig 6
Fig 6. Effects of knockdown of ZEB1 or overexpression of miR-200c on EMT markers and erlotinib sensitivity in HCC4006ER cells.
A, HCC4006ER cells were plated at 3x10⁵ per well in 6-well plate and transfected with ZEB1 or control siRNA at 5 nM as a final concentration. Cells were harvested for analysis at 96 hours post-transfection. Cell lysates were subjected to protein expression analysis with antibodies to ZEB1, E-cadherin, vimentin, and β-actin. B, HCC4006ER cells were plated at 3x10³ cells/ well in black wall 96-well plate, transfected with ZEB1 or control siRNA at 5 nM as a final concentration, and treated for 72 hours at 48 hours after siRNA transfection with increasing concentrations of erlotinib. HCC4006 cells were treated for 72 hours with increasing concentrations of erlotinib for 72 hours to plot a reference curve. Data generated by cell viability assay (CellTiter-Glo) are expressed as a percentage of the value for erlotinib-untreated cells with control siRNA. Control siRNA or transfection reagent did not affect cell viability in HCC4006ER cells at this concentration. The error bars represent SEM of 3 independent experiments. C, HCC4006 and HCC4006ER cells were plated at 3x10⁵ per well in 6-well plate. HCC4006ER cells were transfected with ZEB1 or control siRNA at 0.5 or 5 nM as indicated. HCC4006 cells and siRNA-transfected HCC4006ER cells were incubated for 6 hours ± erlotinib (1 μM) at 48 hours after siRNA transfection. Cell lysates were subjected to protein expression analysis with antibodies to pEGFR, pAkt, pErk, and β-actin. D, Cell lysates of H1975, H1975 BIBW-R, and H1975 WZ-R cells were subjected to protein expression analysis with antibodies to ZEB1, E-cadherin, and β-actin. H358 cells, with and without 5 ng/mL TGF-β treatment for 48 hours or with ZEB1 overexpression, served as positive controls (see Materials and Methods for cell line details). TGF-β stimulation or ZEB1 overexpression reduced E-cadherin expression in H358 cells, as expected. E, Tumor samples from NSCLC patients who were treated with EGFR-TKI and developed resistance accompanied by an EMT phenotype (cases 2, 4, and 10 in our previous report (10); case 2 had T790M and PTEN loss in addition to EMT, whereas cases 4 and 10 did not have other known resistant mechanism after EGFR-TKI treatment). ZEB1 immunostaining analysis was done before and after EGFR-TKI treatment. Representative ZEB1 immunostaining images from cases 4 and 10 (before and after EGFR-TKI treatment) are shown in the upper panel. Percentage of ZEB1-positive nuclei per field was demonstrated for each case (before and after EGFR-TKI treatment) in the bottom panel. Determinations were done in triplicate. Bars, SEM. *P < 0.00001 for before versus after EGFR-TKI treatment (Student t test). F, Expression levels of miR-200c and RNU6B in HCC4006 and in HCC4006ER cells were measured by the quantitative real-time PCR with the corresponding TaqMan MicroRNA assay. Values are expressed as % of RNU6B. Determinations were done in triplicate with two machine replicates. *P < 0.005 for HCC4006 versus HCC4006ER (Student t test).

Similar articles

Cited by

References

    1. Mok TS, Wu YL, Thongprasert S, Yang CH, Chu DT, Saijo N, et al. Gefitinib or carboplatin-paclitaxel in pulmonary adenocarcinoma. N Engl J Med. 2009;361(10):947–57. 10.1056/NEJMoa0810699 - DOI - PubMed
    1. Kobayashi S, Boggon TJ, Dayaram T, Janne PA, Kocher O, Meyerson M, et al. EGFR mutation and resistance of non-small-cell lung cancer to gefitinib. N Engl J Med. 2005;352(8):786–92. - PubMed
    1. Engelman JA, Zejnullahu K, Mitsudomi T, Song Y, Hyland C, Park JO, et al. MET amplification leads to gefitinib resistance in lung cancer by activating ERBB3 signaling. Science. 2007;316(5827):1039–43. - PubMed
    1. Yauch RL, Januario T, Eberhard DA, Cavet G, Zhu W, Fu L, et al. Epithelial versus mesenchymal phenotype determines in vitro sensitivity and predicts clinical activity of erlotinib in lung cancer patients. Clin Cancer Res. 2005;11(24 Pt 1):8686–98. - PubMed
    1. Thomson S, Buck E, Petti F, Griffin G, Brown E, Ramnarine N, et al. Epithelial to mesenchymal transition is a determinant of sensitivity of non-small-cell lung carcinoma cell lines and xenografts to epidermal growth factor receptor inhibition. Cancer Res. 2005;65(20):9455–62. - PubMed

Publication types

MeSH terms