. 2016 Feb 2;113(5):1238-43.
doi: 10.1073/pnas.1518280113. Epub 2016 Jan 19.

Hierarchical looping of zigzag nucleosome chains in metaphase chromosomes

Affiliations

Hierarchical looping of zigzag nucleosome chains in metaphase chromosomes

Sergei A Grigoryev et al. Proc Natl Acad Sci U S A. .

Abstract

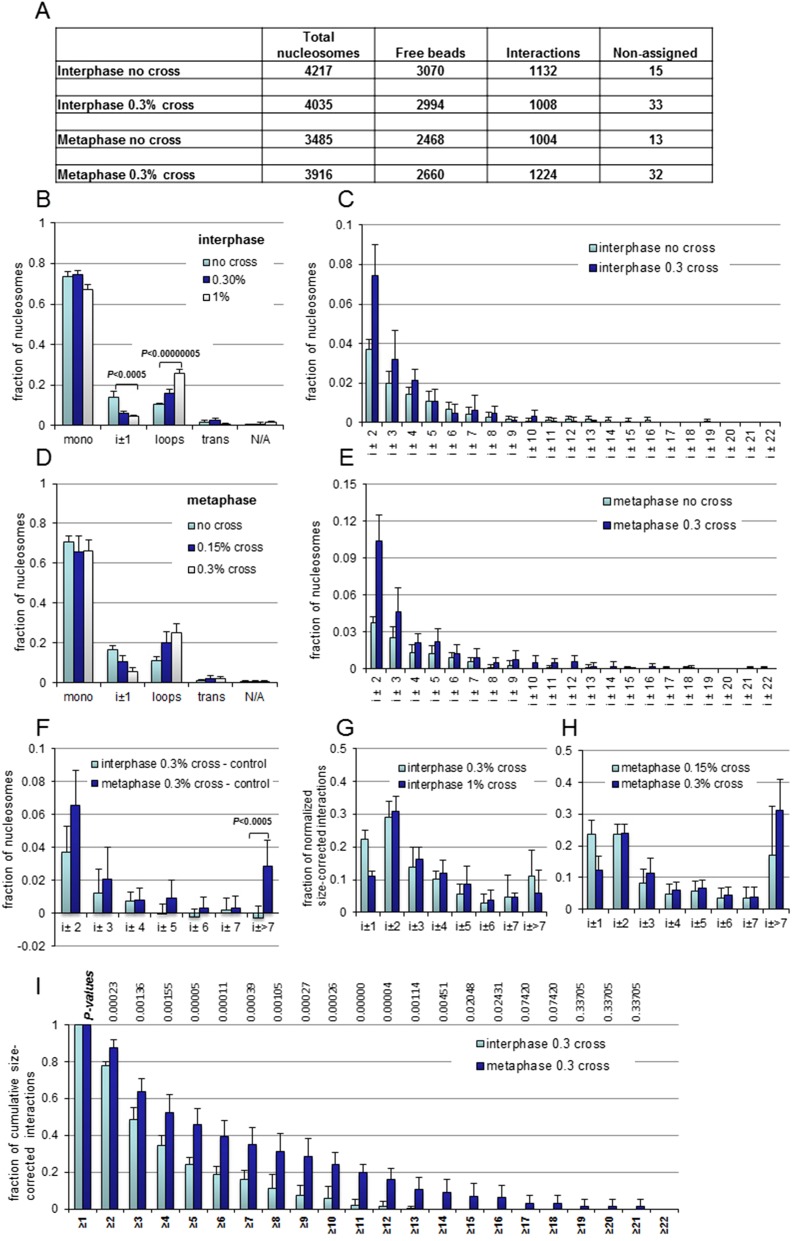
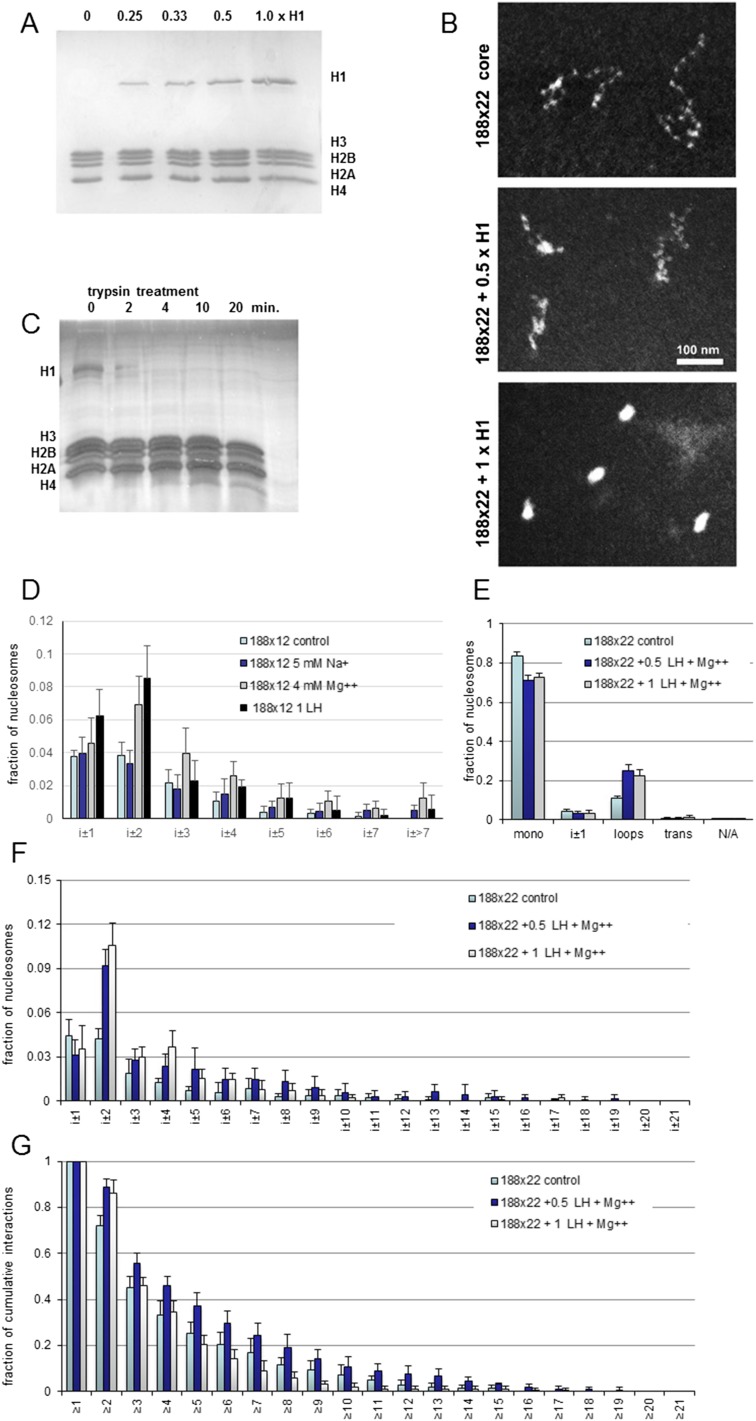
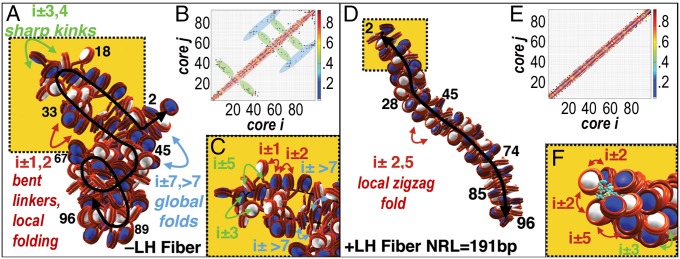
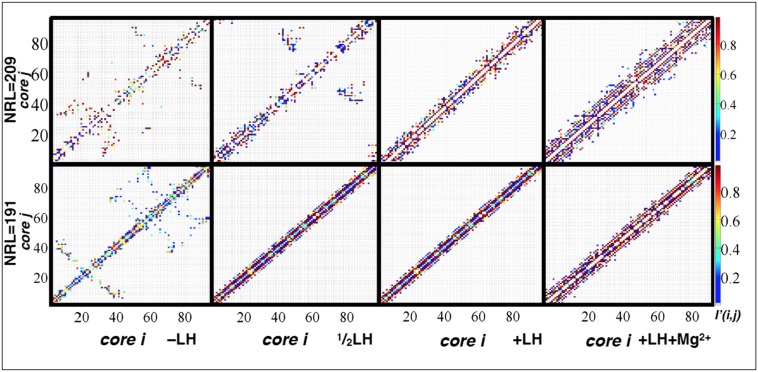
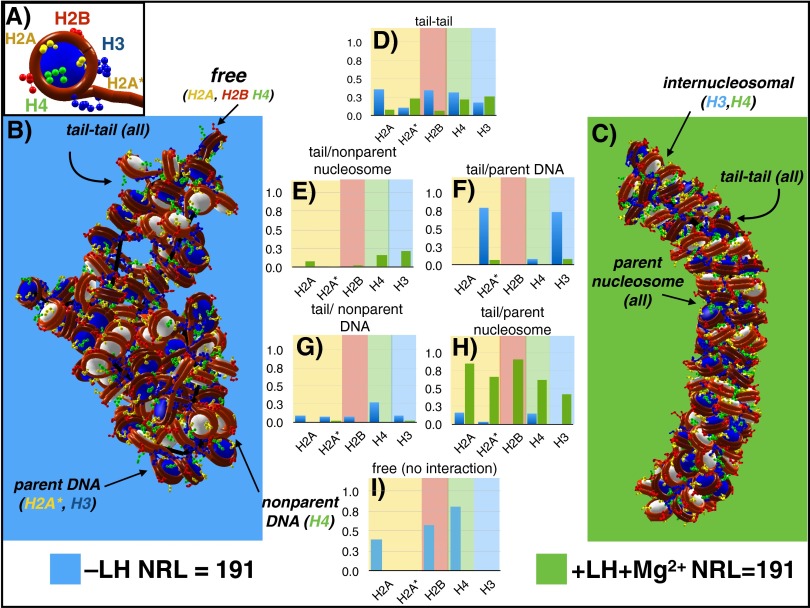
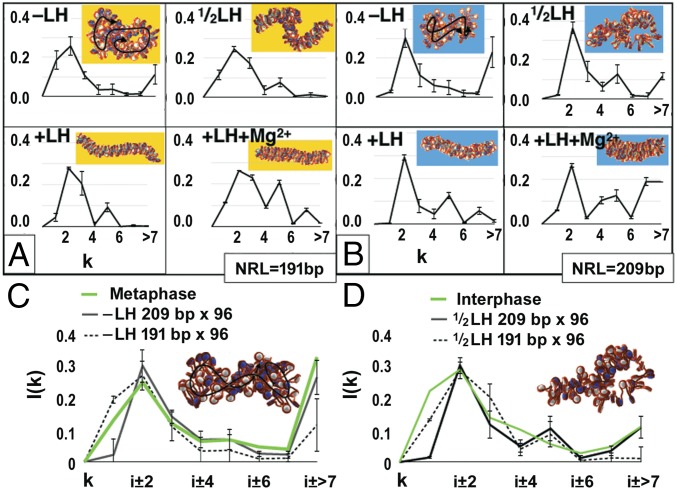
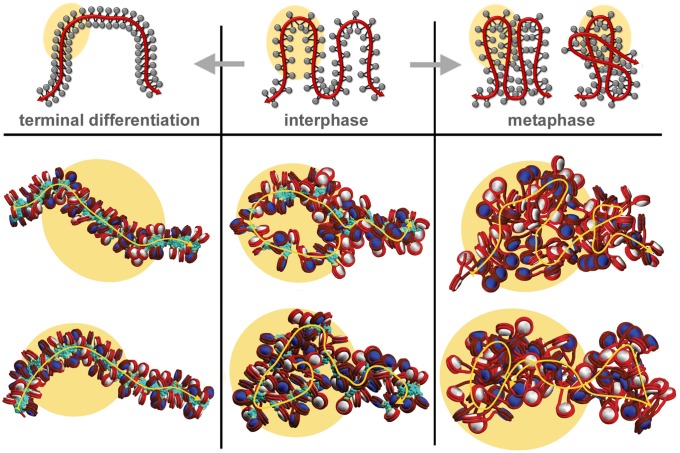
The architecture of higher-order chromatin in eukaryotic cell nuclei is largely unknown. Here, we use electron microscopy-assisted nucleosome interaction capture (EMANIC) cross-linking experiments in combination with mesoscale chromatin modeling of 96-nucleosome arrays to investigate the internal organization of condensed chromatin in interphase cell nuclei and metaphase chromosomes at nucleosomal resolution. The combined data suggest a novel hierarchical looping model for chromatin higher-order folding, similar to rope flaking used in mountain climbing and rappelling. Not only does such packing help to avoid tangling and self-crossing, it also facilitates rope unraveling. Hierarchical looping is characterized by an increased frequency of higher-order internucleosome contacts for metaphase chromosomes compared with chromatin fibers in vitro and interphase chromatin, with preservation of a dominant two-start zigzag organization associated with the 30-nm fiber. Moreover, the strong dependence of looping on linker histone concentration suggests a hierarchical self-association mechanism of relaxed nucleosome zigzag chains rather than longitudinal compaction as seen in 30-nm fibers. Specifically, concentrations lower than one linker histone per nucleosome promote self-associations and formation of these looped networks of zigzag fibers. The combined experimental and modeling evidence for condensed metaphase chromatin as hierarchical loops and bundles of relaxed zigzag nucleosomal chains rather than randomly coiled threads or straight and stiff helical fibers reconciles aspects of other models for higher-order chromatin structure; it constitutes not only an efficient storage form for the genomic material, consistent with other genome-wide chromosome conformation studies that emphasize looping, but also a convenient organization for local DNA unraveling and genome access.

Keywords: chromatin higher-order structure; electron microscopy; linker histone; mesoscale modeling; nucleosome.


Conflict of interest statement

The authors declare no conflict of interest.

Figures

Fig. 1.
Fig. 1.
Cross-linking and unfolding of native nucleosome chains for EM analysis. (A) Scheme of the experimental procedure steps. Interactions ±1, ±2, etc. result from intrafiber internucleosomal interactions; t (trans) results from interfiber internucleosomal interactions. (B) SDS/PAGE of histones from HeLa oligonucleosomes cross-linked with formaldehyde in situ, then isolated and treated with 0.5 μg/mL trypsin at +37 °C for the indicated periods of time. (C) Agarose gel electrophoresis of DNA from sucrose gradient fractionation of the intact and trypsin-treated chromatin isolated from formaldehyde-cross-linked metaphase HeLa chromosomes. Fraction numbers are indicated on top. P, pellet fraction; M, molecular weight markers. (D and E) Electron micrographs show partially cross-linked intact (D) and unfolded (E) HeLa metaphase oligonucleosomes.
Fig. S1.
Fig. S1.
Preparing interphase and metaphase HeLa cells for EMANIC analysis. (AC) Interphase nuclei (A) and metaphase chromosome spreads obtained after the colcemid block (B) and nocodazole block (C) were cytospinned on glass slides and stained by Hoechst 33258. (D–H) Fluorescence microscopy imaging (Hoechst 33258 staining) of nuclei isolated from HeLa cells cross-linked with increasing concentrations of formaldehyde as indicated. After isolation, the nuclei were placed in a low-salt buffer to induce nuclear chromatin unfolding. (I) Bar chart showing average diameters of the unfolded nuclei isolated from HeLa cells cross-linked with the indicated concentrations of formaldehyde.
Fig. S2.
Fig. S2.
Chromatin solubility and nucleosome interactions in HeLa cells after formaldehyde fixation with or without metaphase blocks with colcemid and nocodazole. (A) Chromatin solubility after MNase digestion (10 min) of nuclei isolated from interphase HeLa cells cross-linked with the indicated concentrations of formaldehyde. (B) Chromatin solubility after MNase digestion for indicated times of nuclei isolated from interphase HeLa cells cross-linked with 0% or 0.3% of formaldehyde. (C) Chromatin solubility after MNase digestion (10 min) of nuclei isolated from metaphase HeLa chromosomes prepared by either colcemid or nocodazole block and cross-linked with the indicated concentrations of formaldehyde. (D and E) EMANIC analysis showing fractions of total (free and interacting) nucleosomes within metaphase HeLa cells blocked in the presence of colcemid or nocodazole and cross-linked in situ with 0.3% or 0.5% formaldehyde, respectively. (D) Fractions of free mononucleosomes (mono) and interactions between the nearest neighbors (i ± 1), combined loops (i ± 2 through i ± 22), in-trans interactions between distinct fibers, and nonassigned interactions (N/A). (E) Fractions of interactions between the unique loop types (i ± 1 to i ± 7), combined loops (i ± >7), and in-trans interactions. (F) Fractions of control internucleosome interactions (without formaldehyde cross-linking) in native (HeLa) and reconstituted (clone 601 188 × 22 repeats) nucleosome arrays. Error bars show SDs.
Fig. 2.
Fig. 2.
Transmission EM of nucleosome chains isolated from HeLa chromatin cross-linked in situ. Dark-field EM images of uranyl acetate stained nucleosome arrays derived from control noncross-linked interphase (1–6) and metaphase (13–18) HeLa cells and nucleosome arrays isolated after limited formaldehyde cross-linking in living interphase (7–12) and metaphase (19–23) HeLa cells. Arrows show internucleosomal interactions.
Fig. 3.
Fig. 3.
Nucleosome interactions in interphase and metaphase chromatin in situ. (A and B) Internucleosomal interactions within interphase (A) and metaphase (B) HeLa cells scored without cross-linking (no cross) and after cross-linking with different formaldehyde concentrations in situ as indicated. A and B show fractions of the total nucleosomes including the nearest neighbors (i ± 1), unique loop types (i ± 2 to i ± 7), combined loops (i ± 8 through i ± 22), and in trans between distinct fibers. (C) Fractions of cumulative interactions (i ± ≥1 to i ± ≥22) from interphase and metaphase HeLa cells cross-linked with 0.3% formaldehyde and normalized to all interactions i ± ≥1 = 1. (D) Internucleosomal interactions within CE chromatin scored without cross-linking (no cross) and after cross-linking in vitro with 0.15 M NaCl, or in situ as indicated. Shown are fractions of total nucleosomes including the nearest neighbors (i ± 1), unique loop types (i ± 2 to i ± 7), combined loops (i ± 8 through i ± 22), and in trans between distinct fibers. (E) EMANIC of 188 × 22 reconstituted nucleosome arrays scored without cross-linking (no cross) and cross-linked at 0.15 M NaCl and 1 mM MgCl2 in vitro, and metaphase HeLa cross-linked in situ (0.3% formaldehyde). Shown are fractions of nucleosome interactions, including the nearest neighbors (i ± 1), unique loop types (i ± 2 to i ± 6), and combined loop interactions (i ± >7). Error bars show SDs. P values represent probabilities associated with two-tailed Student’s t test.
Fig. S3.
Fig. S3.
Nucleosome interactions in control and cross-linked interphase and metaphase HeLa chromatin in situ. (A) Table showing the total number of nucleosomes, free and interacting nucleosomes within interphase and metaphase (colcemid block) HeLa cells scored without cross-linking (no cross) and after cross-linking with 0.3% formaldehyde. (B–E) Internucleosomal interactions within interphase (B and C) and metaphase (D and E) HeLa cells. (B and D) Fractions of the total nucleosomes, including individual mononucleosomes (mono), interactions between consecutive neighbors (i ± 1), combined loops (i ± 2 through i ± 22), in-trans interactions between distinct fibers, and nonassigned (obscured) interactions. (C and E) Fractions of total nucleosomes involved in interactions between the nearest neighbors (i ± 1), individual loop types (i ± 2 to i ± 22), in trans between distinct fibers (trans), and nonassigned (N/A) interactions. (F) Fractions of internucleosomal interactions within interphase and metaphase HeLa cells after subtraction of respective nucleosome control internucleosome interactions (without formaldehyde cross-linking). (G and H) Fractions of internucleosomal interactions multiplied by loop size correction coefficient Cicum calculated for each type of interactions (i ± 1 to i ± 22) as described in SI Materials and Methods and normalized to total number of interactions = 1. (I) Fractions of cumulative interactions (i ± ≥1 to i ± ≥22) from the interphase and metaphase HeLa cells multiplied by loop size correction coefficient Cicum as in F and G and normalized to all cumulative interactions i ± ≥1 = 1. Error bars show SDs. P values represent probabilities associated with Student’s t test.
Fig. S4.
Fig. S4.
Formaldehyde fixation of CE cell nuclei gradually inhibits nuclear unfolding. (A–D) Fluorescence microscopy imaging (Hoechst 33258 staining) of CE nuclei cross-linked with increasing concentrations of formaldehyde as indicated. After cross-linking, the nuclei were placed in a low-salt buffer to induce nuclear chromatin unfolding. (E) Bar chart shows average diameters of the unfolded nuclei isolated cross-linked with the indicated concentrations of formaldehyde. (F) Bart chart shows percentage of soluble chromatin released after MNase digestion (10 min) of CE nuclei cross-linked with the indicated concentrations of formaldehyde.
Fig. S5.
Fig. S5.
Nucleosome interactions in CE chromatin in vitro and in situ. (A) EM images of nucleosome arrays derived from isolated CE chromatin cross-linked in the presence of 0.15 M NaCl (1–10) and in CE nuclei in situ (11–21). (B) Internucleosomal interactions within CE chromatin scored without cross-linking (no cross) and after cross-linking in vitro with 0.15 M NaCl, or in situ as indicated. Shown are fractions of total nucleosomes, including individual mononucleosomes (mono) and interactions between the nearest neighbors (i ± 1), unique loop types (i ± 2 to i ± 7), combined loops (i ± >7), in trans between distinct fibers, and nonassigned interactions (N/A). (C) EMANIC of 207 × 24 reconstituted nucleosome arrays cross-linked at 0.15 M NaCl and 1 mM MgCl2 in vitro (data from ref. 16) and CE chromatin cross-linked in situ. Shown are fractions of nucleosome interactions, including the nearest neighbors (i ± 1), unique loop types (i ± 2 to i ± 6), and combined loop interactions (i ± >7). Error bars show SDs.
Fig. S6.
Fig. S6.
Folding and nucleosome interactions in reconstituted 188 × 22 arrays. (A) SDS/PAGE of histones from 188 × 22 nucleosome arrays reconstituted with different molar ratios of linker histone H1 per nucleosome. Coomassie R250 staining. (B) Dark-field EM images of uranyl acetate-stained nucleosome arrays from 188 × 12 nucleosome core arrays in HNE (Top), and 188 × 12 nucleosome arrays reconstituted with 0.5 (Middle) and one (Bottom) molecule of histone H1 per nucleosome in 0.15 M NaCl buffer. (C) SDS/PAGE of histones from 188 × 22 nucleosome arrays reconstituted with linker histone H1, crosslinked with formaldehyde, and then treated with 0.5 mg/mL trypsin at +37 °C for the indicated periods of time. Histones were heated for 30 min at +95 °C before electrophoresis to reverse formaldehyde cross-linking. SYPRO Ruby fluorescence staining. (D) EMANIC of the 188 × 12 nucleosome arrays without cross-linking (control) and cross-linked in presence of 5 mM Na+, 4 mM Mg2+, and one molecule per nucleosome linker histone H1 as indicated. (E–G) EMANIC of the 188 × 22 nucleosome arrays with increasing ratio of linker histone per nucleosome. (E) Fractions of the total nucleosomes, including individual mononucleosomes (mono), interactions between consecutive neighbors (i ± 1), combined loops (i ± 2 through i ± 21), in-trans interactions between distinct fibers (trans), and nonassigned interactions (N/A). (F) All interactions (i ± 1 through i ± 21). (G) Fractions of cumulative interactions (i ± ≥1 to i ± ≥21) normalized to all cumulative interactions i ± ≥1 = 1. Error bars show SDs.
Fig. 4.
Fig. 4.
Modeled folding motifs and analysis of interactions for nucleosome arrays folded with and without linker histone. For the 191 NRL repeat fiber, representative conformations are shown without linker histone (–LH) and one linker histone/nucleosome (+LH) in A and D, respectively, with corresponding normalized interaction frequency maps in B and E and illustrations of these contacts in C and F, respectively. The local interactions are highlighted in red, near the diagonal in the matrices. Interactions along straight lines perpendicular to the diagonal indicate hairpins and sharp kinks, resulting in midrange contacts and are highlighted in green. Off-diagonal parallel lines correspond to hierarchical loops, or loops of loops, resulting in i ± >7 contacts, highlighted in blue.
Fig. S7.
Fig. S7.
Select conformational contact maps of normalized nucleosome interaction frequencies. Maps are provided for four systems (without linker histone, –LH; with one linker histone per two nucleosomes, 1/2LH; with one linker histone per nucleosome, +LH; and one linker histone per one nucleosome plus divalent ions, +LH+Mg2+, all at monovalent salt concentration of [NaCl] = 150 mM, for two distinct linker length values: NRLs = 191 and 209 bp. Off-diagonal terms indicate higher-order folding, whereas diagonal terms indicate near-neighbor contacts evident in local folding (solenoid, two-start zigzag, etc.). Straight lines perpendicular to the diagonal indicate hairpins, whereas off-diagonal parallel lines show loops of loops or hierarchical loops. The fibers –LH 191 NRL, 1/2LH 209 NRL, and –LH 209 NRL reveal higher-order folds (i + >7), whereas the rest do not.
Fig. S8.
Fig. S8.
Histone tail interaction analysis for two fibers with NRL = 191 bp: without LH and with LH and divalent ions. (A) Single core with four classes of histone tails and coloring schemes used in plots. H2A (C-terminal) and H2A* (N-terminal) in yellow, H2B in red, H3 in blue, and H4 in green. (B and C) Typical fiber configuration of the NRL = 191 fiber without linker histone (–LH) and typical fiber configuration with linker histone and divalent ions (+LH+Mg2+), respectively. (D–I) Tail interaction plots determined by calculating the number of times a tail was found within a distance cutoff of 18 Å (the van der Waals radius of tail beads) of either another tail bead (D); a nonparental nucleosome bead (E) and parental nucleosome bead (F); a nonparental linker DNA bead (G) and parental linker DNA bead (H); or no beads (labeled “free”) (I). –LH fibers show significant increase in free tails and parent–DNA interaction, supporting experimental evidence that linker histones repress gene expression, which often relies heavily on H3–parental DNA interaction (16). The +LH+Mg2+ fiber tail patterns reveal significant tail–parent nucleosome interaction, whereas the –LH fiber shows significant tail–parent DNA interactions and free tails.
Fig. 5.
Fig. 5.
Internucleosome interaction patterns for two NRLs folded with various linker histone levels and ionic conditions. Interaction patterns are shown for (A) NRL = 191 bp and (B) NRL = 209 bp, each for four modeled fiber types: without linker histone, –LH; with one linker histone per two nucleosomes, 1/2LH; with one linker histone per nucleosome, +LH; and one linker histone per one nucleosome plus divalent ions, +LH+Mg2+, all at monovalent salt concentration of [NaCl] = 150 mM. Typical fiber folding motifs are shown in the upper right of each plot with a projection of fiber axis shown in black for –LH structures. All plots are normalized by total number of interactions counted per system and scaled with an additional factor between 0.3 and 0.5 to match peaks to EMANIC data. (C and D) Nucleosome interaction plots comparing simulated NRL = 191 bp and NRL = 209 bp –LH (C) and 1/2LH (D) fibers to fractions of size-corrected interactions for human HeLa interphase and metaphase, in green (0.3% cross-linking from Fig. S3 G and H).
Fig. 6.
Fig. 6.
A three-state model of chromatin higher-order folding in proliferating and differentiated cells. Schematic drawing of nucleosome chain folding in living cells (Upper) and mesoscale chromatin models (Lower) suggest that increased linker histone association in the terminally differentiated state would stabilize compact and distinct 30-nm zigzag fibers (Left). In the proliferating (cycling) interphase state, the nucleosome chains are folded in loose zigzag-chain loops (Center). In the metaphase state, a reduction of linker histone binding would promote lateral associations between the nucleosome-chain loops to produce proximal loops that stack over each other, folding hierarchically at various angular orientations (Right). Linker histones are shown in turquoise.

Similar articles

Cited by

References

    1. Eagen KP, Hartl TA, Kornberg RD. Stable chromosome condensation revealed by chromosome conformation capture. Cell. 2015;163(4):934–946. - PMC - PubMed
    1. Ozer G, Luque A, Schlick T. The chromatin fiber: Multiscale problems and approaches. Curr Opin Struct Biol. 2015;31:124–139. - PMC - PubMed
    1. Richmond TJ, Davey CA. The structure of DNA in the nucleosome core. Nature. 2003;423(6936):145–150. - PubMed
    1. Schalch T, Duda S, Sargent DF, Richmond TJ. X-ray structure of a tetranucleosome and its implications for the chromatin fibre. Nature. 2005;436(7047):138–141. - PubMed
    1. Thoma F, Koller T, Klug A. Involvement of histone H1 in the organization of the nucleosome and of the salt-dependent superstructures of chromatin. J Cell Biol. 1979;83(2 Pt 1):403–427. - PMC - PubMed

Publication types