Performance of 2-Dimensional Ultrasound Shear Wave Elastography in Liver Fibrosis Detection Using Magnetic Resonance Elastography as the Reference Standard: A Pilot Study
- PMID: 26782164
- PMCID: PMC4724277
- DOI: 10.7863/ultra.15.03036
Performance of 2-Dimensional Ultrasound Shear Wave Elastography in Liver Fibrosis Detection Using Magnetic Resonance Elastography as the Reference Standard: A Pilot Study
Abstract
Objectives: To investigate the correlation between 2-dimensional (2D) ultrasound shear wave elastography (SWE) and magnetic resonance elastography (MRE) in liver stiffness measurement and the diagnostic performance of 2D SWE for liver fibrosis when imaging from different intercostal spaces and using MRE as the reference standard.
Methods: Two-dimensional SWE was performed on 47 patients. One patient was excluded from the study. Each of the remaining 46 patients underwent same-day MRE for clinical purposes. The study was compliant with the Health Insurance Portability and Accountability Act and approved by the Institutional Review Board. Informed consent was obtained from each patient. Two-dimensional SWE measurements were acquired from the ninth, eighth, and seventh intercostal spaces. The correlation with MRE was calculated at each intercostal space and multiple intercostal spaces combined. The performance of 2D SWE in diagnosing liver fibrosis was evaluated by receiver operating characteristic curve analysis using MRE as the standard.
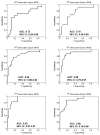
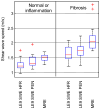
Results: The 47 patients who initially underwent 2D SWE included 22 female and 25 male patients (age range, 19-77 years). The highest correlation between 2D SWE and MRE was from the eighth and seventh intercostal spaces (r = 0.68-0.76). The ranges of the areas under the receiver operating characteristic curves for separating normal or inflamed livers from fibrotic livers using MRE as the clinical reference were 0.84 to 0.92 when using the eighth and seventh intercostal spaces individually and 0.89 to 0.90 when combined.
Conclusions: The results suggest that 2D SWE and MRE are well correlated when SWE is performed at the eighth and seventh intercostal spaces. The ninth intercostal space is less reliable for diagnosing fibrosis with 2D SWE. Combining measurements from multiple intercostal spaces does not significantly improve the performance of 2D SWE for detection of fibrosis.
Keywords: liver fibrosis; magnetic resonance elastography; shear wave elastography.
© 2016 by the American Institute of Ultrasound in Medicine.
Figures


Similar articles
-
Assessing significant fibrosis using imaging-based elastography in chronic hepatitis B patients: Pilot study.World J Gastroenterol. 2019 Jul 7;25(25):3256-3267. doi: 10.3748/wjg.v25.i25.3256. World J Gastroenterol. 2019. PMID: 31333316 Free PMC article.
-
Hepatic fibrosis: prospective comparison of MR elastography and US shear-wave elastography for evaluation.Radiology. 2014 Dec;273(3):772-82. doi: 10.1148/radiol.14132000. Epub 2014 Jul 7. Radiology. 2014. PMID: 25007047
-
Comparison of 2D Shear Wave Elastography, Transient Elastography, and MR Elastography for the Diagnosis of Fibrosis in Patients With Nonalcoholic Fatty Liver Disease.AJR Am J Roentgenol. 2020 Jan;214(1):W20-W26. doi: 10.2214/AJR.19.21267. Epub 2019 Nov 12. AJR Am J Roentgenol. 2020. PMID: 31714842
-
Assessment of biopsy-proven liver fibrosis by two-dimensional shear wave elastography: An individual patient data-based meta-analysis.Hepatology. 2018 Jan;67(1):260-272. doi: 10.1002/hep.29179. Epub 2017 Nov 15. Hepatology. 2018. PMID: 28370257 Free PMC article. Review.
-
Quantitative and noninvasive assessment of chronic liver diseases using two-dimensional shear wave elastography.World J Gastroenterol. 2018 Mar 7;24(9):957-970. doi: 10.3748/wjg.v24.i9.957. World J Gastroenterol. 2018. PMID: 29531460 Free PMC article. Review.
Cited by
-
2D shear wave elastography (SWE) performance versus vibration-controlled transient elastography (VCTE/fibroscan) in the assessment of liver stiffness in chronic hepatitis.Insights Imaging. 2020 Mar 10;11(1):38. doi: 10.1186/s13244-020-0839-y. Insights Imaging. 2020. PMID: 32152802 Free PMC article.
-
Shear-wave elastography of the ulnar collateral ligament of the elbow in healthy volunteers: a pilot study.Skeletal Radiol. 2019 Aug;48(8):1241-1249. doi: 10.1007/s00256-019-3162-2. Epub 2019 Jan 31. Skeletal Radiol. 2019. PMID: 30706109
-
Prediction of nonalcoholic fatty liver disease (NAFLD) activity score (NAS) with multiparametric hepatic magnetic resonance imaging and elastography.Eur Radiol. 2019 Nov;29(11):5823-5831. doi: 10.1007/s00330-019-06076-0. Epub 2019 Mar 18. Eur Radiol. 2019. PMID: 30887196 Free PMC article.
-
Multiparametric in vivo ultrasound shear wave viscoelastography on farm-raised fatty duck livers: human radiology imaging applied to food sciences.Poult Sci. 2021 Apr;100(4):100968. doi: 10.1016/j.psj.2020.12.065. Epub 2020 Dec 31. Poult Sci. 2021. PMID: 33607316 Free PMC article.
-
Liver fibrosis staging with a new 2D-shear wave elastography using comb-push technique: Applicability, reproducibility, and diagnostic performance.PLoS One. 2017 May 16;12(5):e0177264. doi: 10.1371/journal.pone.0177264. eCollection 2017. PLoS One. 2017. PMID: 28510583 Free PMC article.
References
-
- Friedman SL. Liver fibrosis -- from bench to bedside. Journal of Hepatology. 2003;38 (Suppl 1):S38–53. - PubMed
-
- Bravo AA, Sheth SG, Chopra S. Liver biopsy. The New England journal of medicine. 2001;344(7):495–500. - PubMed
-
- Afdhal NH, Nunes D. Evaluation of liver fibrosis: a concise review. Am J Gastroenterol. 2004;99(6):1160–74. - PubMed
-
- Sandrin L, Fourquet B, Hasquenoph JM, Yon S, Fournier C, Mal F, et al. Transient elastography: a new noninvasive method for assessment of hepatic fibrosis. Ultrasound in Medicine & Biology. 2003;29(12):1705–13. - PubMed
Publication types
MeSH terms
Grants and funding
LinkOut - more resources
Full Text Sources
Other Literature Sources
Medical

