New observations on maternal age effect on germline de novo mutations
- PMID: 26781218
- PMCID: PMC4735694
- DOI: 10.1038/ncomms10486
New observations on maternal age effect on germline de novo mutations
Abstract
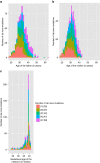
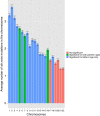
Germline mutations are the source of evolution and contribute substantially to many health-related processes. Here we use whole-genome deep sequencing data from 693 parents-offspring trios to examine the de novo point mutations (DNMs) in the offspring. Our estimate for the mutation rate per base pair per generation is 1.05 × 10(-8), well within the range of previous studies. We show that maternal age has a small but significant correlation with the total number of DNMs in the offspring after controlling for paternal age (0.51 additional mutations per year, 95% CI: 0.29, 0.73), which was not detectable in the smaller and younger parental cohorts of earlier studies. Furthermore, while the total number of DNMs increases at a constant rate for paternal age, the contribution from the mother increases at an accelerated rate with age.These observations have implications related to the incidence of de novo mutations relating to maternal age.
Conflict of interest statement
The sequencing data has been deposited at dbGap under the accession codes phs001055.v1.p1.
Figures


Similar articles
-
Parental influence on human germline de novo mutations in 1,548 trios from Iceland.Nature. 2017 Sep 28;549(7673):519-522. doi: 10.1038/nature24018. Epub 2017 Sep 20. Nature. 2017. PMID: 28959963
-
Parent-of-origin-specific signatures of de novo mutations.Nat Genet. 2016 Aug;48(8):935-9. doi: 10.1038/ng.3597. Epub 2016 Jun 20. Nat Genet. 2016. PMID: 27322544
-
Mutation risk associated with paternal and maternal age in a cohort of retinoblastoma survivors.Hum Genet. 2012 Jul;131(7):1115-22. doi: 10.1007/s00439-011-1126-2. Epub 2011 Dec 28. Hum Genet. 2012. PMID: 22203219 Free PMC article.
-
De Novo Mutations Reflect Development and Aging of the Human Germline.Trends Genet. 2019 Nov;35(11):828-839. doi: 10.1016/j.tig.2019.08.005. Epub 2019 Oct 11. Trends Genet. 2019. PMID: 31610893 Review.
-
Determinants of mutation rate variation in the human germline.Annu Rev Genomics Hum Genet. 2014;15:47-70. doi: 10.1146/annurev-genom-031714-125740. Epub 2014 Jun 5. Annu Rev Genomics Hum Genet. 2014. PMID: 25000986 Review.
Cited by
-
Estimating the genome-wide mutation rate from thousands of unrelated individuals.Am J Hum Genet. 2022 Dec 1;109(12):2178-2184. doi: 10.1016/j.ajhg.2022.10.015. Epub 2022 Nov 11. Am J Hum Genet. 2022. PMID: 36370709 Free PMC article.
-
De novo mutations, genetic mosaicism and human disease.Front Genet. 2022 Sep 26;13:983668. doi: 10.3389/fgene.2022.983668. eCollection 2022. Front Genet. 2022. PMID: 36226191 Free PMC article. Review.
-
Appropriate Assignment of Fossil Calibration Information Minimizes the Difference between Phylogenetic and Pedigree Mutation Rates in Humans.Life (Basel). 2018 Oct 22;8(4):49. doi: 10.3390/life8040049. Life (Basel). 2018. PMID: 30360410 Free PMC article.
-
Parental Age and Childhood Lymphoma and Solid Tumor Risk: A Literature Review and Meta-Analysis.JNCI Cancer Spectr. 2022 May 2;6(3):pkac040. doi: 10.1093/jncics/pkac040. JNCI Cancer Spectr. 2022. PMID: 35639955 Free PMC article. Review.
-
The Estimated Pacemaker for Great Apes Supports the Hominoid Slowdown Hypothesis.Evol Bioinform Online. 2019 Jun 13;15:1176934319855988. doi: 10.1177/1176934319855988. eCollection 2019. Evol Bioinform Online. 2019. PMID: 31223232 Free PMC article.
References
-
- Crow J. F. & Weinberg W. The origins , patterns and implications of human spontaneous mutation. Nat. Rev. Genet. 1, 40–47 (2000). - PubMed
-
- Francioli L. C. et al. Whole-genome sequence variation, population structure and demographic history of the Dutch population. Nat. Genet. 46, 818–825 (2014). - PubMed
-
- Williams D. A. Generalized linear model diagnostics using the deviance and single case deletions. Appl. Stat. 36, 181–191 (1987).
-
- Ségurel L., Wyman M. J. & Przeworski M. Determinants of mutation rate variation in the human germline. Annu. Rev. Genomics Hum. Genet. 15, 47–70 (2014). - PubMed
Publication types
MeSH terms
LinkOut - more resources
Full Text Sources
Other Literature Sources

