. 2016 Jun 15;524(9):1920-56.
doi: 10.1002/cne.23966. Epub 2016 Mar 9.

Synaptic circuitry of identified neurons in the antennal lobe of Drosophila melanogaster

Affiliations

Synaptic circuitry of identified neurons in the antennal lobe of Drosophila melanogaster

Jürgen Rybak et al. J Comp Neurol. .

Abstract

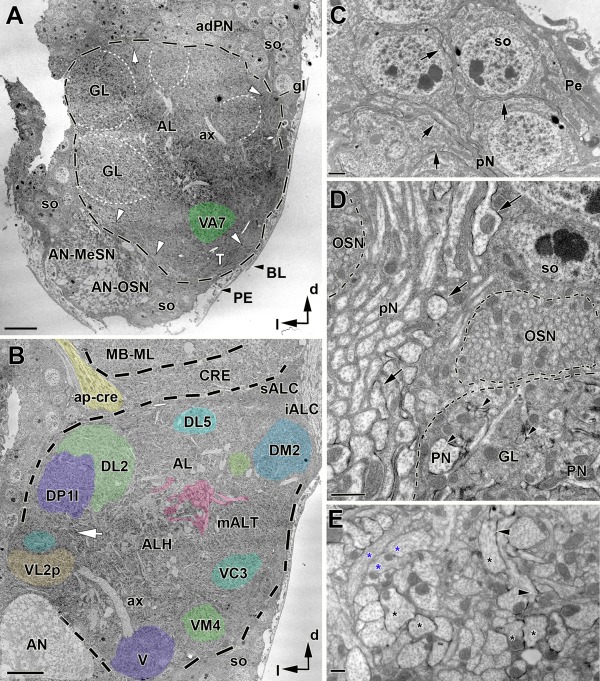
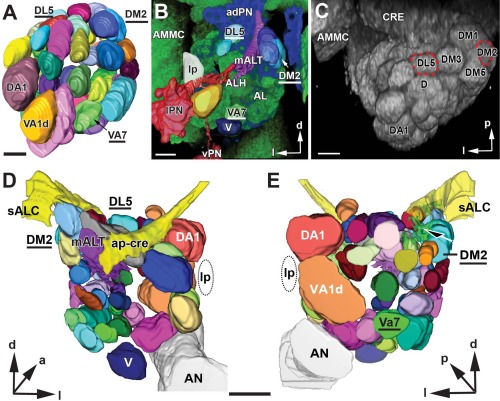
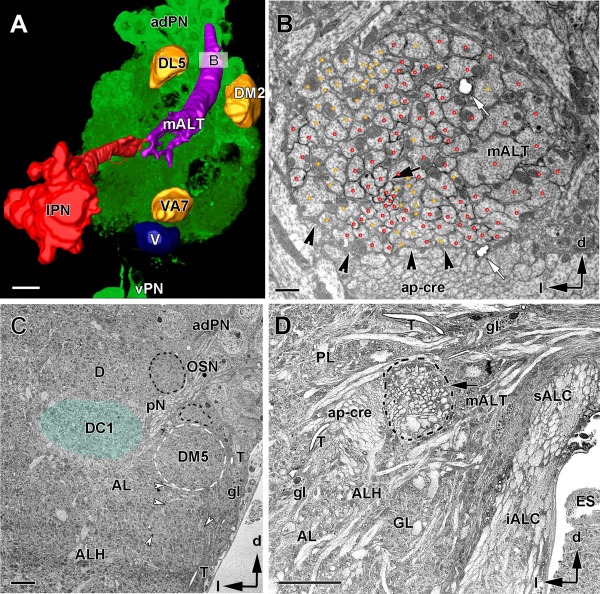
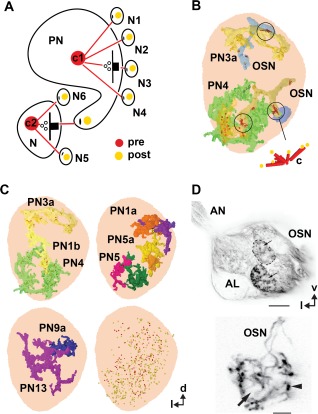
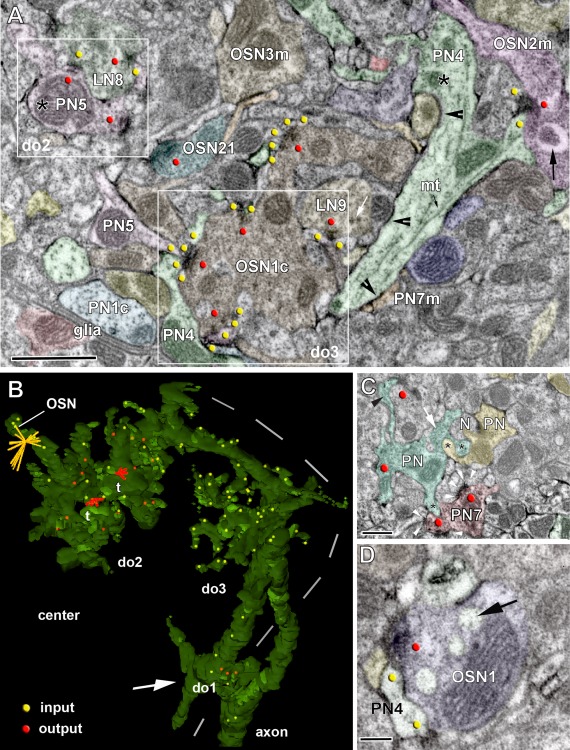
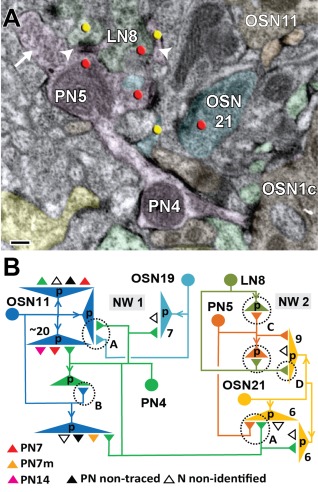
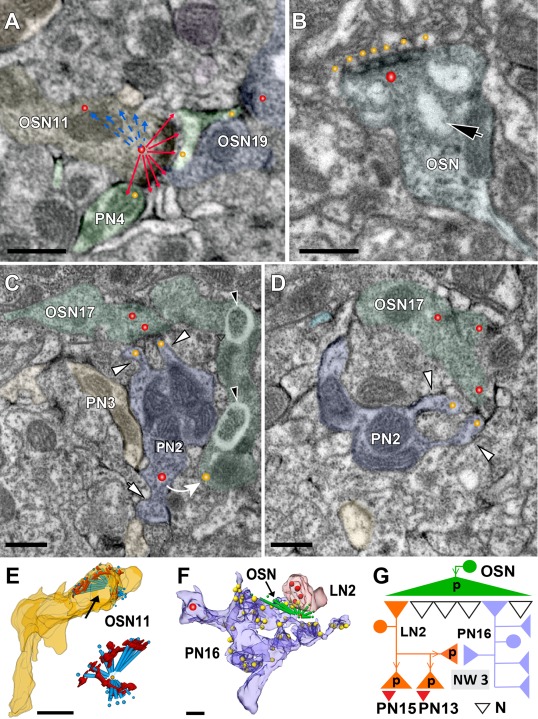
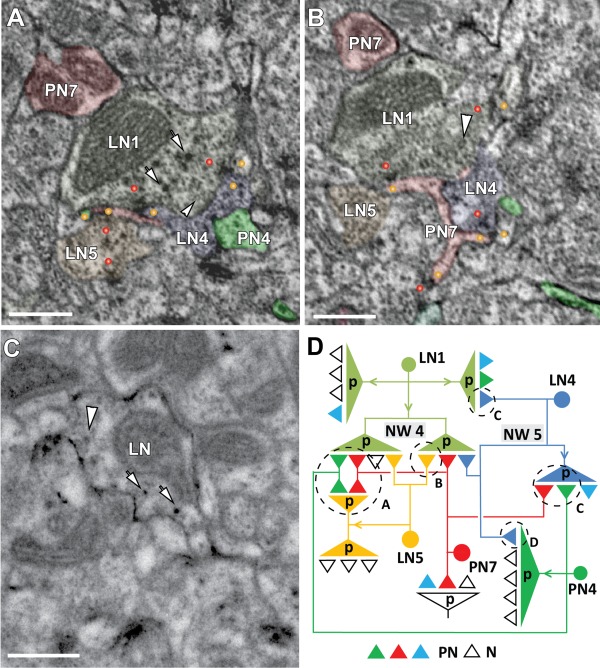
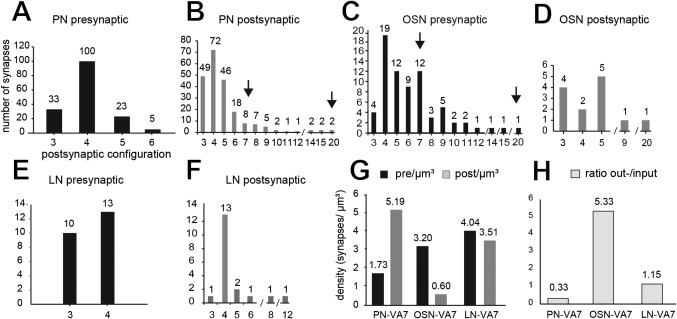
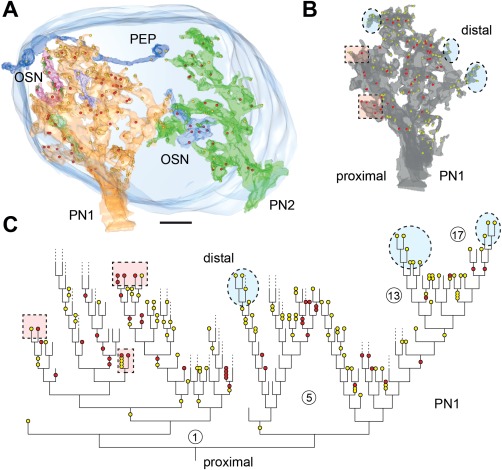
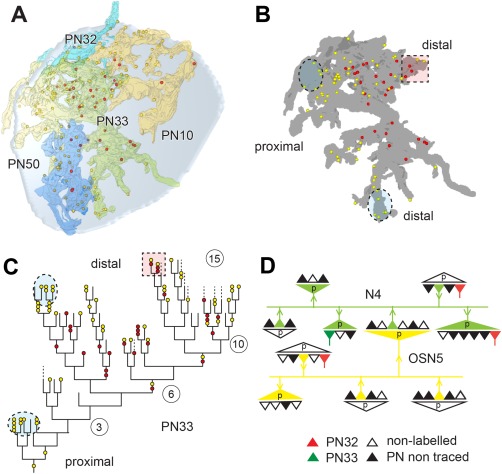
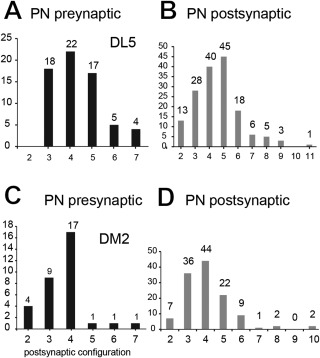
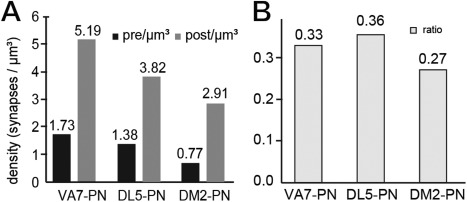
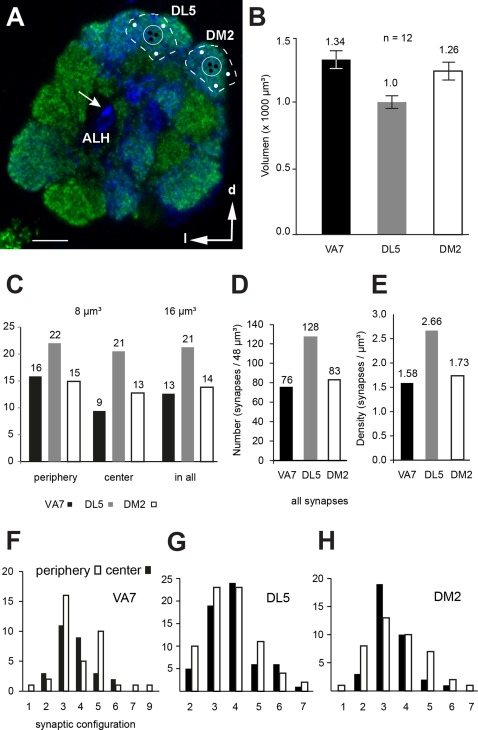
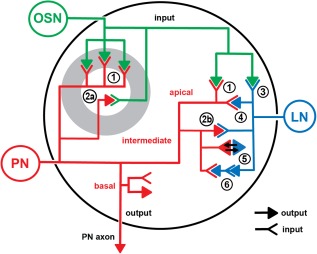
In Drosophila melanogaster olfactory sensory neurons (OSNs) establish synapses with projection neurons (PNs) and local interneurons within antennal lobe (AL) glomeruli. Substantial knowledge regarding this circuitry has been obtained by functional studies, whereas ultrastructural evidence of synaptic contacts is scarce. To fill this gap, we studied serial sections of three glomeruli using electron microscopy. Ectopic expression of a membrane-bound peroxidase allowed us to map synaptic sites along PN dendrites. Our data prove for the first time that each of the three major types of AL neurons is both pre- and postsynaptic to the other two types, as previously indicated by functional studies. PN dendrites carry a large proportion of output synapses, with approximately one output per every three input synapses. Detailed reconstructions of PN dendrites showed that these synapses are distributed unevenly, with input and output sites partially segregated along a proximal-distal gradient and the thinnest branches carrying solely input synapses. Moreover, our data indicate synapse clustering, as we found evidence of dendritic tiling of PN dendrites. PN output synapses exhibited T-shaped presynaptic densities, mostly arranged as tetrads. In contrast, output synapses from putative OSNs showed elongated presynaptic densities in which the T-bar platform was supported by several pedestals and contacted as many as 20 postsynaptic profiles. We also discovered synaptic contacts between the putative OSNs. The average synaptic density in the glomerular neuropil was about two synapses/µm(3) . These results are discussed with regard to current models of olfactory glomerular microcircuits across species.

Keywords: Drosophila melanogaster; glomerulus; olfactory system; projection neuron; synaptic microcircuits; ultrastructure.


Conflict of interest statement

No authors have any known or potential conflict of interest including any financial, personal, or other relationships with other people or organizations within the years of beginning the submitted work that could inappropriately influence or be perceived to influence the work.

Figures

Figure 1
Figure 1
Panoramic view of antennal lobe (AL) organization in the adult brain of Drosophila melanogaster. A: Transverse TEM section (perpendicular to the body axis) of the right AL at low magnification for general orientation. Layers of neuronal somata (so) surround the central neuropil. The outer border is confined by the perineurium (PE) and an extracellular matrix termed the basal lamina (BL; black arrowheads). The AL neuropil is surrounded by a thin glial layer (black dashed line), and bundles of olfactory sensory fibers emanating from the antennal nerve (white arrowheads in A and OSN in D). Tracheoles (T; respiratory tubes) are found in this zone but not inside the glomeruli (GL). The antennal nerve with sensory fibers originating on the antenna enters the AL ventrolaterally and is composed of mechanosensory (AN–MeSN) and chemosensory (AN–OSN) axonal bundles. Glomerular boundaries are faintly visible, but partly recognized by the arrangement of fiber bundles at their periphery (GL; indicated by white dashed lines). This section is approximately 15 µm from the anterior surface of the AL and one in a series of 50 sections that was used to construct a 3D model of glomeruli and landmark structures (see also Fig. 2D,E). The VA7 glomerulus is colored in green. adPN, anterior–dorsal soma layer; ax, axon; so, soma; gl, glia; GL, glomerulus; d, dorsal; l, lateral. B: TEM section of the same AL at a more posterior level, approximately 25 µm from the anterior surface of the AL. The glomeruli are indicated with the color code of the 3D reconstruction presented in Figure 2. Glomeruli VA7 (indicated in 1A), DL5, and DM2 were subjected to a high‐resolution analysis of synaptic connectivity. ALH, central, nonglomerular AL neuropil; AN, antennal nerve; CRE, crepine; ap‐cre, anterior–posterior tract of the crepine; iALC, inferior antennal lobe commissure; MB–ML, medial lobe of the mushroom body; mALT, median antennal lobe tract; sALC, superior antennal lobe commissure. C–E: Examples of the black labeling of neuronal membranes of projection neurons used in this study (ectopic expression of a membrane‐bound form of horseradish peroxidase [HRP]; see Materials and Methods). Note the patchy appearance of the labeling. C: The arrows indicate HRP labeling of the membrane of PN somata (so) and primary neurites (pN) of the anterior–dorsal somata cluster (ad‐PN in A). D: HRP membrane labeling of primary neurites (pN) of the adPN cluster (arrows). Proximal to the border of the AL neuropil (dashed line), an interrupted zone of olfactory sensory neuron (OSN) fibers is followed by the proper synaptic neuropil of the glomerulus (GL) with labeled PN profiles (arrowhead). E: In the central AL (ALH in B), labeled axonal processes of PNs (arrowhead and black stars) adjacent to nonlabeled profiles (blue stars) are shown. Scale bar = 10 µm in A; 5 µm in B; 1 µm in C; 2 µm in D; = 0.5 µm in E.
Figure 2
Figure 2
A: 3D digital model of the adult antennal lobe (AL) glomeruli in Drosophila melanogaster based on confocal microscopy and two fluorescent markers. Glomeruli are colored and named after Grabe et al. (2015). The glomeruli studied here are the VA7, the DL5, and the DM2 (underlined). The VA1d, DA1, and V are landmark glomeruli. The model is available online (Supplementary Fig. S1). B: Confocal image showing the AL neuropil stained with a synaptic marker (nc82, green channel) and PN neurons labeled with GFP (blue channel). Superimposed are some segmented and 3D surface‐rendered structures, to illustrate how the 3D model was used during our study. The glomeruli (DM2, DL5, and VA7) and landmark structures are indicated: a lateral somata cluster of projection neurons (lPN), the lateral passage (lp), a bundle of primary neurites emanating from the lPN (black arrow) and a local interneuron somata cluster, and the V glomerulus (V). C: Volume rendering of an AL confocal scan in a horizontal view. Identified glomeruli DL5 and DM2 are encircled. D,E: A 3D TEM model of the antennal lobe in the adult Drosophila male. A posterior (D) and anterior (E) view of anatomical features generated by the 3D reconstructions of TEM serial sections shown in surface‐rendered mode. The three glomeruli studied here (DL5, DM2, and VA7) are depicted along with landmark structures. Major tracts are the median antennal lobe tract (mALT), the antennal nerve (AN), the primary neurite bundle stemming from the anterior–dorsal somata cluster (black arrow), the lateral passage (lp), the superior antennal lobe commissure (sALC), and the anterior–posterior tract of the crepine (ap‐cre). ALH, antennal hub (a nonglomerular neuropil of the antennal lobe); AMMC, antennal mechanosensory and motor center; adPN, ipsilateral anterior–dorsal somata cluster; CRE, crepine; vPN, ventral PN somata cluster; d, dorsal; p, posterior, l, lateral. The complete 3D TEM model is available online (Supplementary Fig. S2). Scale bar = 20 µm in A–C and D,E.
Figure 3
Figure 3
Mapping and ultrastructure of the median antennal lobe tract (mALT). A: Confocal image of the right antennal lobe (AL) in a fly expressing GFP driven by GAL4‐GH146 in projection neurons and superimposed onto a 3D image of segmented and surface‐rendered neuronal structures labeled with the same driver. The three studied glomeruli (DM2, DL5, and VA7) and other relevant landmarks are depicted, such as the lateral projection neuron (PN) soma cluster (lPN), the ventral PN soma cluster (vPN), and the median AL tract (mALT). B: Ultrathin section across the AL approximately 50 µm parallel to the anterior AL surface (see inset B in A). The axons from a subpopulation of projection neurons running in the mALT are genetically labeled with HRP (black arrow) and are marked with red dots. Non‐HRP–labeled axons are marked in yellow. The mALT contained 146 axons, of which 86 were HRP‐labeled PNs (black arrow). The boundary of the mALT is wrapped by glia processes (darker cytoplasm is indicated by black arrowheads). White arrows indicate tracheoles. C,D: TEM images of cross sections at about 25 µm (C) and and 45 µm (D) below the anterior surface of the antennal lobe. C: The structure and borders of glomeruli are visible (e.g., dashed white line for the DM5 and shaded blueish area for the DC1 glomerulus). Adjacent structures, such as bundles of thin olfactory sensory cells (OSNs; black dashed line), glial cells (gl), and trachea (T) serving as landmark structures helped to define the glomerular borders. Note also the whirling bundles of neurites and single axons (white arrowheads) marking glomerular boundaries. D: TEM image of a cross section of the mALT at the exit of the tract from the AL to the protocerebral lobe (PL) in the posterior AL, and approximately 1 µm posterior to the level depicted in B. At this level, uni‐ and multiglomerular PNs run together in one bundle (arrow, mALT). Note the strong HRP labeling of the mALT axons. AL, antennal lobe; ALH, antennal lobe hub; adPN, anterior–dorsal cluster of GAL4‐GH146 labeled PNs; ap‐cre, anterior‐posterior tract of the crepine; ES, esophagus; g, glia; GL, glomerulus; iALC, inner antennal lobe commissure; mALT, median antennal lobe tract; l, lateral; lPN, lateral PN cluster; PL, protocerebral lobe; T, tracheole; vPN, ventral PN cluster; pN, primary neurite; V, VA7, DL5, DM2, identified glomeruli; sALC, superior antennal lobe commissure; d, dorsal; l, lateral. Scale bar in A and D =10 µm, in B = 1 µm, in C 0.5 µm,.
Figure 4
Figure 4
Synaptic structure and distribution of projection neurons (PNs) and olfactory sensory neurons (OSNs) of the antennal lobe. A: Definition of synaptic structures that were used in this study to depict synaptic number, synaptic configuration, and connectivity of PNs to unlabeled profiles (N, and N1–N6). PNs are either presynaptic (pre) to their postsynaptic partners (here: PN forms a tetrad to N1–N4) or postsynaptic (here: members of a triad, with N as the presynaptic input to N5, N6, and PN). The red and yellow dots symbolize pre‐ and postsynaptic densities (pre and post, respectively). The connector (c) defines the synaptic configuration (c1: tetrad and c2: triad). B: Examples of the distribution of PN (PN3a, PN4) and OSN profiles in the VA7 glomerulus, and their synaptic connectivity. OSN cells form elongated synapses (encircled); also see the inset (c), which symbolizes the OSN connector to PN and other postsynaptic cells (yellow dots). In some areas, OSNs form a high‐density accumulation of output synapses (red dots).C: The location of projection neurons (PN3A, PN4, and so on) and the distribution of their synaptic sites within the VA7 glomerulus (frontal view). Depicted are all profiles of PNs segmented in the study that in sum cover the entire diameter of the glomerulus. In the lower right part of the figure the distribution of all pre‐and postsynaptic sites of VA7‐ PNs of this study are shown. D: Pattern of glomerular innervation by OSN terminals in the AL. Upper part: high‐resolution confocal scan of OSN fibers forming subdomains within the glomeruli. Lower part: OSN axonal terminals bearing large synaptic boutons (arrowhead). The arrows indicate glomerular zones devoid of OSN innervation. AL, antennal lobe; AN, antennal nerve; v, ventral; l, lateral. Scale bar = 20 µm in D, upper part; 5 µm, lower part.
Figure 5
Figure 5
Cell types and synaptic configurations in the VA7 glomerulus. A: TEM micrograph of HRP‐labeled projection neurons (PNs) and nonlabeled cell types (putative olfactory sensory neuron [OSN] and local interneuron [LN] profiles). Segmented profiles are colored and were followed throughout a series of about 100 sections. The presence of presynaptic densities or T‐bars and postsynaptic sites is marked by red and yellow dots, respectively. PN profiles are recognized by their stained (black) membrane (arrowheads in profiles PN4) and their cytoplasmic features. They form boutons (swellings, asterisk in PN5, PN4) along their dendrites, bearing presynaptic sites ( = output synapses; red dots) and postsynaptic sites (yellow dots) in their spiny processes. Note the abundance of large mitochondria in PN boutons (e.g., PN5). Large neurites of the PNs are filled with microtubules (mt). Nonlabeled OSN‐type cells (e.g., OSN1c) are characterized by dense, dark cytoplasm filled with small vesicles. They mostly form output synapses onto the spiny processes of PN and on other cell types (indicated by red dots in the OSN1c profile). Presynaptic T‐bars and two types of vesicles, small clear vesicles and larger, dark vesicles (white arrows in LN9), characterize the LN‐type profiles. They form reciprocal synaptic connections to the PN neurons (here: PN5 and LN8). The synaptic connections of the OSN‐ and LN‐type are shown in more detail in Figures 6, 7, 8. B: digital reconstruction of a projection neuron profile (PN4) traced from the periphery (dashed line) to the center of glomerulus VA7. The distribution of PN4 input sites and output sites are shown by yellow and red dots, respectively. The output synapses of the PN4 are configured mainly as tetrads (t = red output connector). From proximal (upon their entrance to the glomerulus, white arrow) to distal toward the center, PN4 domains of mixed input/output synapses (do2) and zones with solely input sites (do3) were found. OSN: connector of an OSN‐type cell indicates many postsynaptic targets, including PN4 postsynaptic sites. C: A PN7 bouton forms output synapses onto nonlabeled profiles with postsynaptic densities (white arrowheads) and forms mutual invaginations (black stars) onto other projection neurons (PN) and unlabeled profiles (N). D: The PN4 is postsynaptic to, and forms invaginations (black arrow) onto a presynaptic putative OSN profile (OSN1). Scale bar = 1 µm in A; 0.5 µm in C; 0.2 µm in D.
Figure 6
Figure 6
A putative synaptic network among projection neurons (PNs), local interneuron (LN)‐type, and olfactory sensory neuron [OSN]‐type cells. A: Synaptic connections between PN profiles and profiles from the other two cell types. In the example, PN5–LN8, input and output PN synapses are in close proximity. The PN5 bouton is presynaptic to the LN8 profile, and receives input from the same LN8 onto a PN5 spiny process (white arrowheads). The PN profile also formed also hair‐like processes around the OSN21 profile. The white arrow in the left upper corner shows a “pocket” in the PN profile filled with vesicles. OSN21 forms an elongated presynaptic density (red dot), as well as a spine, which is postsynaptic to the PN5 (yellow dot). B: Microcircuits of neuronal elements in the VA7. The arrows indicate the information flow suggested by the synaptic contacts mapped in our TEM reconstructions. Presynaptic elements are marked with p, and postsynaptic elements are represented by small triangles. In network 1 (NW1) the profiles from OSN‐type cells contain polyadic elongated synapses, contacting between 7 and up to 20 postsynaptic profiles, as indicated by number. OSN‐type profiles thus formed mostly input synapses onto PN profiles (feedforward motif A). PNs were also presynaptic to OSN‐type profiles (feedback motif B: PN4 to OSN11). The right part of the circuit (NW2) shows that OSN‐type and LN‐type profiles are reciprocally interconnected to PN cells (PN5) (reciprocal motif C).Another output synapse from OSN21 targets LN‐type cells (motif D). In summary, the PN profiles receive input from OSN and LN cells, and form feedback (output) synapses onto both cell types. Scale bar = 0.2 µm in A.
Figure 7
Figure 7
Putative olfactory sensory neuron (OSN) profiles and their synapses. A characteristic feature of OSN‐type profiles is the formation of polyadic synapses with elongated T‐bars consisting of a single platform supported by several pedestals and contacting many postsynaptic profiles. A: Example of an elongated, polyadic synapse made by OSN11 in glomerulus VA7. Note the prolonged presynaptic density curving along a distance of approximately 1.5 µm. The connector (red and blue colored lines pointing to postsynaptic elements) indicates the total number of postsynaptic profiles, which in this case is about 20. A labeled projection neuron (PN) profile (PN4) is postsynaptic to OSN11 at two separate sites (yellow dots) The PN4 also formed a spine opposed to another OSN‐type presynaptic site (OSN19) (see also network 1 in Fig. 6B). B: Example of a polyadic synapse made by an OSN‐type cell (OSN) in the DM2 glomerulus. This OSN profile contained invaginations (black arrow). The enlarged presynaptic site is equipped with an elongated presynaptic density (red dot) with several pedestals and a large platform opposed to multiple postsynaptic profiles (yellow dots). C,D: Typically, OSN‐type profiles were contacted by multiple spines (white arrowheads), which in this example emanated from a PN bouton (PN2), thus contacting and receiving input from polyadic synapses (red dots in OSN17) several times. The PN2 cell formed a feedback synapse to OSN17 (the curved white arrow), which is here outside the plane of the section. Note the gray zones in OSN17 surrounded by a halo (black arrowheads). E: 3D reconstruction of the polyadic synapse shown in A. The black arrow indicates the large presynaptic density. Inset: The connectors (blue) indicate the number of postsynaptic sites, and the presynaptic density is shown in red. F: OSN‐type profiles forming microcircuits with two distinct cell types at the periphery of the VA7. Polyadic synapses of the OSN‐type cells were most frequently encountered at sites with dendritiform PN terminals, which received multiple synaptic inputs (yellow dots in PN16). Here, the elongated polyadic synapse (OSN, green connector, and arrow) is presynaptic to a profile of an LN‐type cell (LN2 bouton, which also contains several output synapses (red dots), and to PN16. G: Microcircuitry scheme of synaptic connections of the three cell types shown in F. The OSN‐type cell is directly connected to PN16 (feedforward synapse) and indirectly connected via the LN2 profile forming a serial synapse (network 3 [NW3]). N, nonidentified profiles; PN 13, PN15, PN profiles postsynaptic to LN2. Scale bar = 0.5 µm in A–F.
Figure 8
Figure 8
Profiles of putative local interneurons (LNs) and their synapses. A: LN‐type profiles were defined by their relatively light cytoplasm and two types of vesicles, small clear vesicles and larger, dark vesicles (arrowhead and arrows, respectively, in LN1). The synaptic configuration of two labeled projection neurons: PN7 (in pink) and PN4 (in green) and three LN‐type profiles (LN1, LN4, and LN5) are shown in A and B. The LN‐type profiles formed presynaptic T‐shaped densities (red dots). LN1, LN4, and LN5 were presynaptic to fine, hairpin‐shaped and spiny processes formed by PN4 and PN7 (yellow dots; LN1 was also presynaptic to LN‐type profiles LN4 and LN5. C: A bouton from a LN neuron labeled with membrane‐bound HRP with a driver specific for local interneurons, Np1227‐GAL4 (Okada et al., 2009), exhibited the two main ultrastructural features used to define LN‐type profiles as those shown in A and C. D: Microcircuit diagrams based on the reconstruction from a continuous series of approximately 10 sections showing the full complement of synaptic contacts between PN and LN‐type profiles in a microvolume of about 4 µm3. Several network motifs were found: Network 4 (NW4) depicts the convergence of two presynaptic outputs (from LN4 and LN5) onto one postsynaptic site (here: the dendritic spines of PN7 and PN4, motif A [encircled]). Indirect LN synaptic input to the PNs is mediated via a feedforward synapse from LN1 onto LN5 (motif B). Network 5 (NW5): LN1 and LN4 forming a serial synapse onto the PN4 (motif C). Additionally, a local feedback circuit, or reciprocal synapse, was formed between the PN4 and the LN4 (motif D). (The PN4 presynaptic density is not shown in A and B.) LN4 was also presynaptic to PN4 and two other labeled PN profiles. N, nonidentified profiles. Scale bar = 0.5 µm in A–C.
Figure 9
Figure 9
The synaptic configurations of neurons in the VA7 glomerulus. A,B: The synaptic configuration of all VA7–PN output synapses (projection neuron [PN] presynaptic) and the configuration of (partly) nonidentified profiles, for which at least one PN profile is the postsynaptic element (PN postsynaptic). Most PNs are tetradic, but additionally are contacted by cells with more than six postsynaptic elements. The arrows indicate the range for polyadic synaptic input from putative presynaptic olfactory sensory neurons (see also corresponding arrows in C). CF: Synaptic inventory of OSN‐type cells (C,D) and local interneuron (LN)‐type cells (putative local interneurons) (E,F). The configuration of synapses formed by OSN‐type and LN‐type cells is different (see OSN and LN presynaptic, respectively). Both cell types most often made synaptic contacts with postsynaptic cells in a tetrad configuration, but OSN‐type profiles had synapses with up to 20 postsynaptic targets (elongated polyadic synapses). The OSN‐type and LN‐type cells (OSN and LN postsynaptic, respectively) received mostly input in a tetrad postsynaptic assembly, but were also postsynaptic to polyadic, elongated presynaptic elements (arrows), indicating that they are postsynaptic to other OSN cells. For full statistics on these cell types, see Supplementary Figs. S3–S5. G,H: Synaptic contacts made by all cell types in the VA7 glomerulus. The graph summarizes the quantitative data on synaptic contacts for all cell types (PN–VA7, OSN–VA7, and LN–VA7) in the VA7 glomerulus. G: Pre‐ and postsynaptic sites were counted along profiles from each cell type, and their volumetric density was calculated per neurite volume (pre/µm3 and post/µm3). Each cell type has a characteristic distribution of output and input sites. H: Ratio of out‐to‐input synapses for all three cell types. Approximately 30% of PN synapses were output synapses, whereas synapses of the OSN‐type cells formed predominantly output synapses, and LN‐type cells had an almost equal amount of input, and output synapses.
Figure 10
Figure 10
Synapse mapping in glomerulus DL5. A: In this reconstruction the glomerulus DL5 is shaded in blue. Two projection neuron (PN) profiles (PN1 and PN2) occupied separate regions of the glomerulus and probably belong to different PN cells because their proximal shafts enter the glomerulus at different sites. The neurite volume of PN profiles in which presynaptic (red dots) and postsynaptic (yellow dots) sites were identified is 35 µm3 for PN1 (in yellow) and 15 µm3 for PN2 (in green). OSN, olfactory sensory neuron (OSN)‐type profiles; PEP, a putative peptidergic neuron. See also the interactive 3D pdf in Supplementary Fig. S7). B: A reconstruction of the PN1 dendritic tree. Shaded and encircled areas refer to the location of synapses as shown in C. C: Dendrogram depicting the distribution of input (yellow) and output (red) synapses along different branching levels of the PN dendritic tree from level 1 (the entry neurite, proximal) to level 17 (the PN terminal branches, distal). Dashed lines indicate that the respective arbor could not be followed. Note that individual branches might terminate at any arborizations level starting at level 2. The number of synapses increases with the degree of arborization. At levels 0–4 and 15–17, solely input synapses were found. Levels 5–15 are a mixed zone of input and output synapses. Output synapses were found most frequently at levels 6–12. At terminal branches solely input synapses (blue, encircled), or terminals with input/output synapses (pink, encircled) were found. The number of terminals without synapses is 16 ( = approximately 20%). Scale bar = 3 µm in A.
Figure 11
Figure 11
Synapse mapping in the DM2 glomerulus. A,B: Reconstructions of projection neurons (PNs) with their presynaptic sites indicated by red dots and their postsynaptic sites by yellow dots. See also the interactive 3D pdf in Supplementary Fig. S8. A: Here the PN profiles, situated at the periphery of the DM2 glomerulus are postsynaptic. B: Synaptic composition of the PN33 profile. Note that the PN33 profile receives mostly input at the periphery (yellow dots), whereas mixed input–output zones are more toward the center (blue and pink shaded areas. respectively). C: Dendrogram depicting the distribution of input (yellow) and output (red) synapses along different levels of the PN dendritic tree from level 0 (the entry neurite, proximal) to 15 (distal). Upon branching, level 6 input synapses are only at terminal positions. Note that at higher branching levels, terminal branches had either solely input (blue shaded, encircled) or mixed input–output (pink shaded, encircled) synapses. D: Connectivity scheme of labeled PNs, olfactory sensory neuron (OSN)‐type cell (OSN5), and nonidentified cells (N4): The nonidentified N cells and the OSN‐type cell formed synapses mostly onto PNs, but received feedback synapses from PNs.
Figure 12
Figure 12
Quantitative data of the synaptic configuration of projection neurons (PNs) in glomeruli DL5 and DM2. A,B: For the DL5–PN profiles, the synaptic configuration of 66 presynaptic sites (PN presynaptic) were evaluated. Presynaptic sites were configured mostly as triads, tetrads, and pentads. Polyadic synapses with more than seven postsynaptic sites for a given presynaptic site were exceptions: only four cases were found with seven partners. C,D: Quantitative measurements for PN profiles in the DM2 glomerulus. Comparison of synaptic configurations of DM2–PN output sites (PN presynaptic) and DM2–PN input sites (PN postsynaptic). The most frequent configuration of presynaptic sites of DM2–PNs was triads and tetrads. Between 18% and 9% of DL5–PNs and DM2–PNs, respectively, are postsynaptic to profiles with elongated synapses (contacting more than seven postsynaptic sites). Numbers indicate the amount of synapses of each synaptic configuration.
Figure 13
Figure 13
Summary of synapse numbers and synaptic configurations among projection neuron (PN) profiles in glomeruli VA7, DL5, and DM2. A: In all glomeruli, the neuron volumetric density of PN presynaptic sites was lower relative to that of postsynaptic sites. The overall synaptic density in the PN profiles reconstructed in glomerulus DM2 is considerably lower than that measured among PN profiles in glomeruli DL5 and VA7. B: Although different synaptic densities were found in the three glomeruli, the ratio of pre‐to postsynaptic sites was the same in the VA7 and DL5 glomeruli (about 0.35) and was slightly lower in the DM2 (0.27). On average, about 30% of PN synapses are feedback (or output) synapses.
Figure 14
Figure 14
Quantitative analysis of synapse number within glomerular microvolumes. A: Synaptic counts of presynaptic sites (output synapses) in microvolumes (MV) located in either the center or the periphery of the three studied glomeruli (here shown for the DL5 and DM2 glomerulus, encircled). In each glomerulus six MV were chosen for the center (black dots) and the periphery (white dots). The total counting volume is 48 µm3 for each glomerulus, which is approximately 4–5% of the total volume of the given glomerulus. All neuronal profiles, labeled and nonlabeled, were analyzed. Arrow indicates the origin of the median antennal lobe tract, ALH, antennal hub; d, dorsal; l, lateral. Image courtesy of Y.Seki. B: Volume measurements of glomeruli VA7, DL5, and DM2 in males from Drosophila melanogaster of the left and right antennal lobe derived from confocal scans (n = 12 glomeruli from the left and right hemisphere in six animals). CE: Synaptic number of presynaptic sites, for the VA7, DL5, and DM2 glomerulus, averaged from three MV counts in the periphery (each 8 µm3) and in the center of each glomerulus (each 8 µm3), respectively; “in all” indicates the average counts summed from periphery and center (volume of 16 µm3). D: Synaptic configuration for all presynapses found in all 12 microvolumes, i.e., the absolute number of synapses for all three glomeruli (each volume is 48 µm3). E: Density of synapses per cubic micrometer. FH: Synaptic configuration of synapses in the periphery and in the center the VA7, DL5, and DM2 glomerulus; most are triad and tetrad constellations. Scale bar = 10 µm in A.
Figure 15
Figure 15
Schematic synaptic circuit of a Drosophila glomerulus with emphasis on the projection neuron (PN) circuit. Along the PN dendritic arborizations (PN, in red), synapses are segregated along proximal (basal), intermediate, and distal (apical) zones, according to the olfactory input and synaptic connections with other cell types: olfactory sensory neurons (OSNs) and local interneurons (LNs) within a glomerulus. The OSN bundles form several zones throughout the glomerulus, leaving OSN free zones as a core, surrounded by OSN axonal terminals (gray‐shaded area). Two of these subdomains are depicted, here, to summarize the synaptic network motifs of PN circuitry we found in our study. Predominant is the large feedforward OSN synapse onto PN with multiple spines at the PN most distal terminal endings (motif 1). PNs also form output (feedback) synapses onto OSN terminals and to LN (motif 2a and motif 2b, respectively). Further synaptic constellations are the OSN–LN synapse (motif 3), a triad configuration of OSN–LN–PN (motif 4), reciprocal PN–LN connections (motif 5), and the serial synapse LN–LN–PN (motif 6). In the most proximal (basal) portions of the PN dendritic tree, both input and output PN synapses were found.

Similar articles

Cited by

References

    1. Abel R, Rybak J, Menzel R. 2001. Structure and response patterns of olfactory interneurons in the honeybee, Apis mellifera. J Comp Neurol 437:363–383. - PubMed
    1. Acebes A, Martin‐Pena A, Chevalier V, Ferrus A. 2011. Synapse loss in olfactory local interneurons modifies perception. J Neurosci 31:2734–2745. - PMC - PubMed
    1. Ache BW, Young JM. 2005. Olfaction: diverse species, conserved principles. Neuron 48:417–430. - PubMed
    1. Agarwal G, Isacoff E. 2011. Specializations of a pheromonal glomerulus in the Drosophila olfactory system. J Neurophysiol 105:1711–1721. - PMC - PubMed
    1. Ahrens MB, Li JM, Orger MB, Robson DN, Schier AF, Engert F, Portugues R. 2012. Brain‐wide neuronal dynamics during motor adaptation in zebrafish. Nature 485:473–477. - PMC - PubMed

Publication types

MeSH terms

Substances

LinkOut - more resources