

Morphological Changes of Amygdala in Turner Syndrome Patients
- PMID: 26778543
- PMCID: PMC6492903
- DOI: 10.1111/cns.12482
Morphological Changes of Amygdala in Turner Syndrome Patients
Abstract
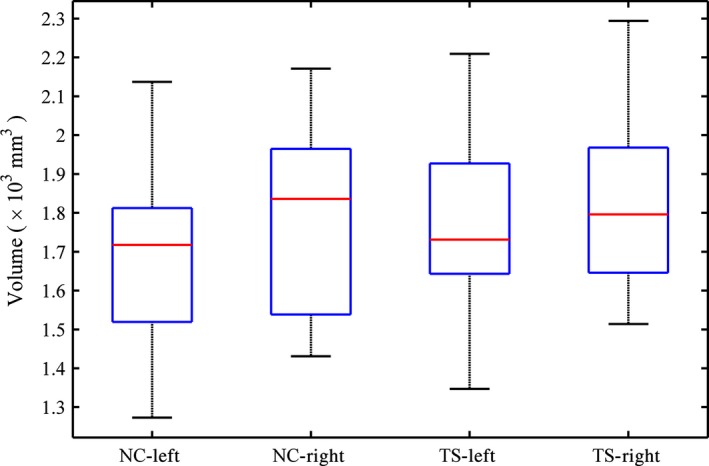
Aims: Turner's syndrome (TS) losts one of the X chromosomes and exhibits social cognition deficits. Previous studies have reported that women with TS demonstrated structural and functional abnormalities in brain, including increased volume in amygdala. However, most studies regarded the amygdala as a whole, and the abnormalities in the specific subregions of amygdala in TS have not been studied. Here, we aimed to investigate the local morphological changes of amygdala in TS using the surface morphology analysis method.
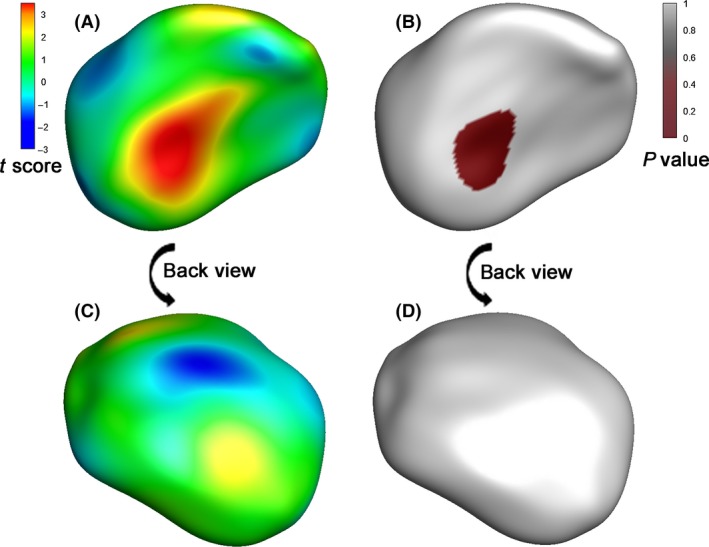
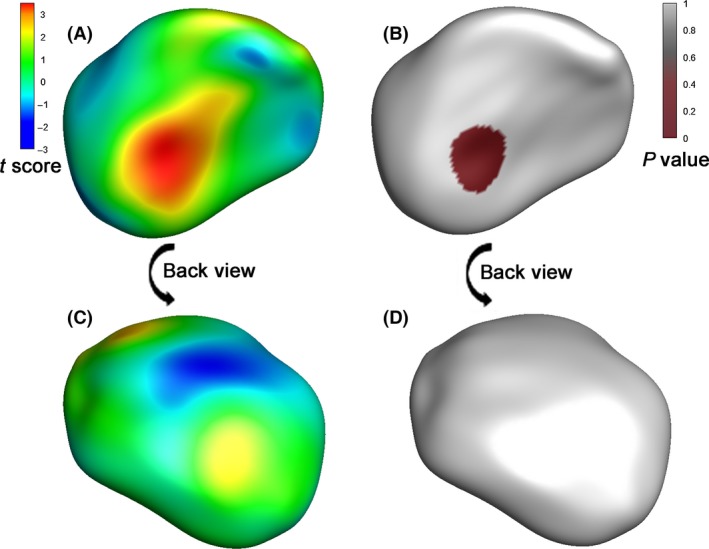
Methods: A total of 19 adolescents with 45XO TS and 20 matched adolescents with typical development were evaluated using magnetic resonance imaging. The amygdalae of all participants were manually delineated. 3D surface remodeling and parameterization were performed based on the outlined boundaries of amygdalae. We extracted two surface metrics, namely direct Euclidean displacement and normal projection that were used to represent the morphology of amygdala.
Results: Statistical analysis showed significant outward deformation in the laterobasal subregion of left amygdala in patients with TS, compared with the controls using either direct Euclidean displacement or normal displacement.
Conclusions: Our findings provide novel insight into the pathological changes in the amygdala of patients with TS.
Keywords: Amygdala; MRI; Shape analysis; Turner syndrome.
© 2016 John Wiley & Sons Ltd.
Conflict of interest statement
The authors declare no conflict of interest.
Figures

Similar articles
-
Amygdala and hippocampal volumes in Turner syndrome: a high-resolution MRI study of X-monosomy.Neuropsychologia. 2004;42(14):1971-8. doi: 10.1016/j.neuropsychologia.2004.04.021. Neuropsychologia. 2004. PMID: 15381027 Free PMC article.
-
The Effects of X Chromosome Loss on Neuroanatomical and Cognitive Phenotypes During Adolescence: a Multi-modal Structural MRI and Diffusion Tensor Imaging Study.Cereb Cortex. 2015 Sep;25(9):2842-53. doi: 10.1093/cercor/bhu079. Epub 2014 Apr 25. Cereb Cortex. 2015. PMID: 24770708
-
Social cognition in Turner's Syndrome.J Clin Neurosci. 2010 Mar;17(3):283-6. doi: 10.1016/j.jocn.2009.09.006. Epub 2010 Jan 20. J Clin Neurosci. 2010. PMID: 20089410 Review.
-
Sex differences in amygdala shape: Insights from Turner syndrome.Hum Brain Mapp. 2016 Apr;37(4):1593-601. doi: 10.1002/hbm.23122. Epub 2016 Jan 28. Hum Brain Mapp. 2016. PMID: 26819071 Free PMC article.
-
Agenesis of the corpus callosum in Turner's syndrome: report of a case and review of the literature.Acta Neurol Taiwan. 2008 Sep;17(3):194-8. Acta Neurol Taiwan. 2008. PMID: 18975527 Review.
Cited by
-
Effects of hypogonadism on brain development during adolescence in girls with Turner syndrome.Hum Brain Mapp. 2019 Dec 1;40(17):4901-4911. doi: 10.1002/hbm.24745. Epub 2019 Aug 7. Hum Brain Mapp. 2019. PMID: 31389646 Free PMC article.
References
-
- Agrawal N, Gupta M, Wangnoo S. Turner's syndrome. Apollo Med 2009;6:335–339.
-
- Skuse DH. X‐linked genes and mental functioning. Hum Mol Genet 2005;14:R27–R32. - PubMed
-
- Molko N, Cachia A, Riviere D, et al. Brain anatomy in Turner syndrome: Evidence for impaired social and spatial–numerical networks. Cereb Cortex 2004;14:840–850. - PubMed
-
- Lawrence K, Kuntsi J, Coleman M, Campbell R, Skuse D. Face and emotion recognition deficits in Turner syndrome: A possible role for X‐linked genes in amygdala development. Neuropsychology 2003;17:39. - PubMed
-
- Phelps EA, O'Connor KJ, Gatenby JC, Gore JC, Grillon C, Davis M. Activation of the left amygdala to a cognitive representation of fear. Nat Neurosci 2001;4:437–441. - PubMed
Publication types
MeSH terms
LinkOut - more resources
Full Text Sources
Other Literature Sources
Medical
