Decreased N-TAF1 expression in X-linked dystonia-parkinsonism patient-specific neural stem cells
- PMID: 26769797
- PMCID: PMC4852502
- DOI: 10.1242/dmm.022590
Decreased N-TAF1 expression in X-linked dystonia-parkinsonism patient-specific neural stem cells
Abstract
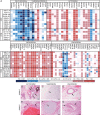
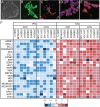
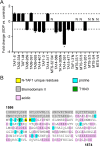
X-linked dystonia-parkinsonism (XDP) is a hereditary neurodegenerative disorder involving a progressive loss of striatal medium spiny neurons. The mechanisms underlying neurodegeneration are not known, in part because there have been few cellular models available for studying the disease. The XDP haplotype consists of multiple sequence variations in a region of the X chromosome containingTAF1, a large gene with at least 38 exons, and a multiple transcript system (MTS) composed of five unconventional exons. A previous study identified an XDP-specific insertion of a SINE-VNTR-Alu (SVA)-type retrotransposon in intron 32 ofTAF1, as well as a neural-specific TAF1 isoform, N-TAF1, which showed decreased expression in post-mortem XDP brain compared with control tissue. Here, we generated XDP patient and control fibroblasts and induced pluripotent stem cells (iPSCs) in order to further probe cellular defects associated with this disease. As initial validation of the model, we compared expression ofTAF1and MTS transcripts in XDP versus control fibroblasts and iPSC-derived neural stem cells (NSCs). Compared with control cells, XDP fibroblasts exhibited decreased expression ofTAF1transcript fragments derived from exons 32-36, a region spanning the SVA insertion site. N-TAF1, which incorporates an alternative exon (exon 34'), was not expressed in fibroblasts, but was detectable in iPSC-differentiated NSCs at levels that were ∼threefold lower in XDP cells than in controls. These results support the previous findings that N-TAF1 expression is impaired in XDP, but additionally indicate that this aberrant transcription might occur in neural cells at relatively early stages of development that precede neurodegeneration.
Keywords: Induced pluripotent stem cells; TAF1; X-linked dystonia-parkinsonism.
© 2016. Published by The Company of Biologists Ltd.
Conflict of interest statement
The authors declare no competing or financial interests.
Figures


Similar articles
-
Dissecting the Causal Mechanism of X-Linked Dystonia-Parkinsonism by Integrating Genome and Transcriptome Assembly.Cell. 2018 Feb 22;172(5):897-909.e21. doi: 10.1016/j.cell.2018.02.011. Cell. 2018. PMID: 29474918 Free PMC article.
-
G-quadruplexes in an SVA retrotransposon cause aberrant TAF1 gene expression in X-linked dystonia parkinsonism.Nucleic Acids Res. 2024 Oct 28;52(19):11571-11586. doi: 10.1093/nar/gkae797. Nucleic Acids Res. 2024. PMID: 39287133
-
Genome editing in induced pluripotent stem cells rescues TAF1 levels in X-linked dystonia-parkinsonism.Mov Disord. 2018 Jul;33(7):1108-1118. doi: 10.1002/mds.27441. Mov Disord. 2018. PMID: 30153385
-
X-Linked Dystonia-Parkinsonism: recent advances.Curr Opin Neurol. 2019 Aug;32(4):604-609. doi: 10.1097/WCO.0000000000000708. Curr Opin Neurol. 2019. PMID: 31116117 Free PMC article. Review.
-
Understanding XDP through imaging, pathology, and genetics.Int J Neurosci. 2011;121 Suppl 1:12-7. doi: 10.3109/00207454.2010.526729. Epub 2010 Nov 1. Int J Neurosci. 2011. PMID: 21034368 Review.
Cited by
-
Combined dystonias: clinical and genetic updates.J Neural Transm (Vienna). 2021 Apr;128(4):417-429. doi: 10.1007/s00702-020-02269-w. Epub 2020 Oct 24. J Neural Transm (Vienna). 2021. PMID: 33099685 Review.
-
Neuronal-specific microexon splicing of TAF1 mRNA is directly regulated by SRRM4/nSR100.RNA Biol. 2020 Jan;17(1):62-74. doi: 10.1080/15476286.2019.1667214. Epub 2019 Sep 27. RNA Biol. 2020. PMID: 31559909 Free PMC article.
-
Variation in TAF1 expression in female carrier induced pluripotent stem cells and human brain ontogeny has implications for adult neostriatum vulnerability in X-linked Dystonia Parkinsonism.eNeuro. 2022 Jul 21;9(4):ENEURO.0129-22.2022. doi: 10.1523/ENEURO.0129-22.2022. Online ahead of print. eNeuro. 2022. PMID: 35868859 Free PMC article.
-
The roles of TAF1 in neuroscience and beyond.R Soc Open Sci. 2024 Sep 25;11(9):240790. doi: 10.1098/rsos.240790. eCollection 2024 Sep. R Soc Open Sci. 2024. PMID: 39323550 Free PMC article. Review.
-
Taf1 knockout is lethal in embryonic male mice and heterozygous females show weight and movement disorders.Dis Model Mech. 2024 Jul 1;17(7):dmm050741. doi: 10.1242/dmm.050741. Epub 2024 Jul 10. Dis Model Mech. 2024. PMID: 38804708 Free PMC article.
References
-
- Anandapadamanaban M., Andresen C., Helander S., Ohyama Y., Siponen M. I., Lundström P., Kokubo T., Ikura M., Moche M. and Sunnerhagen M. (2013). High-resolution structure of TBP with TAF1 reveals anchoring patterns in transcriptional regulation. Nat. Struct. Mol. Biol. 20, 1008-1014. 10.1038/nsmb.2611 - DOI - PMC - PubMed
Publication types
MeSH terms
Substances
Supplementary concepts
Grants and funding
LinkOut - more resources
Full Text Sources
Other Literature Sources
Molecular Biology Databases
Research Materials

