

HIV-1 Env Glycoprotein Phenotype along with Immune Activation Determines CD4 T Cell Loss in HIV Patients
- PMID: 26764036
- PMCID: PMC4744550
- DOI: 10.4049/jimmunol.1501588
HIV-1 Env Glycoprotein Phenotype along with Immune Activation Determines CD4 T Cell Loss in HIV Patients
Abstract
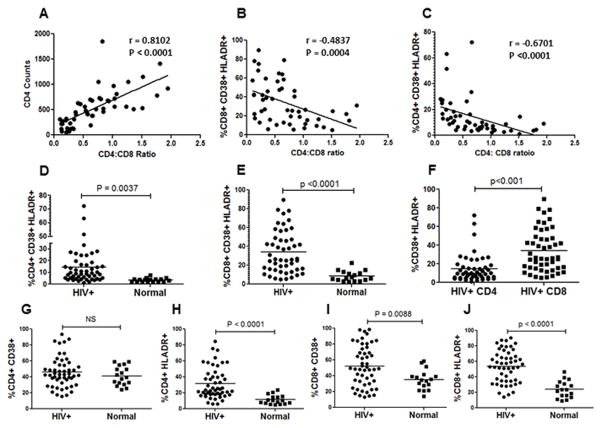
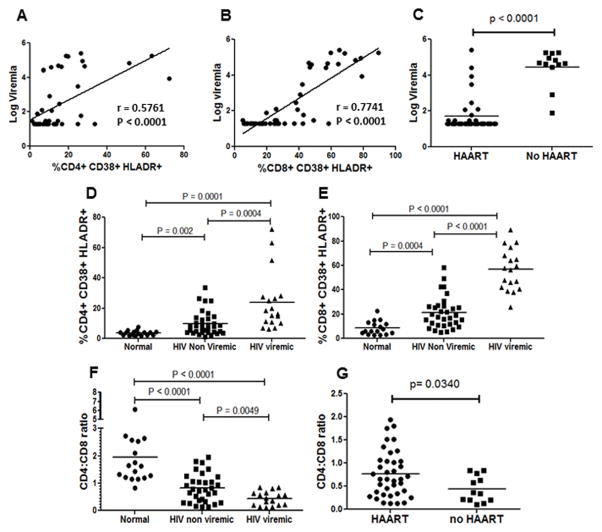
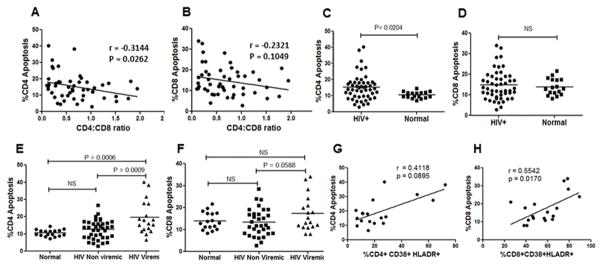
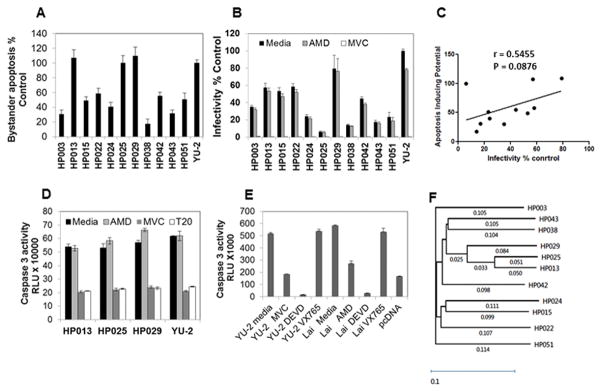
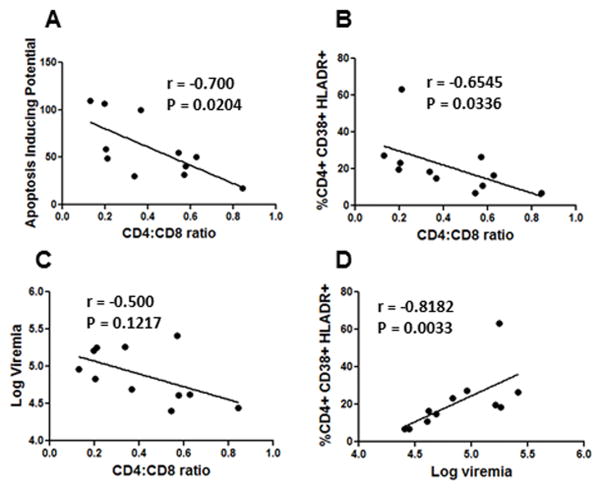
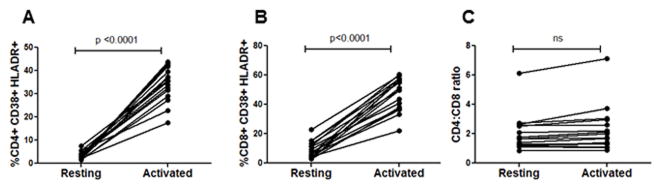
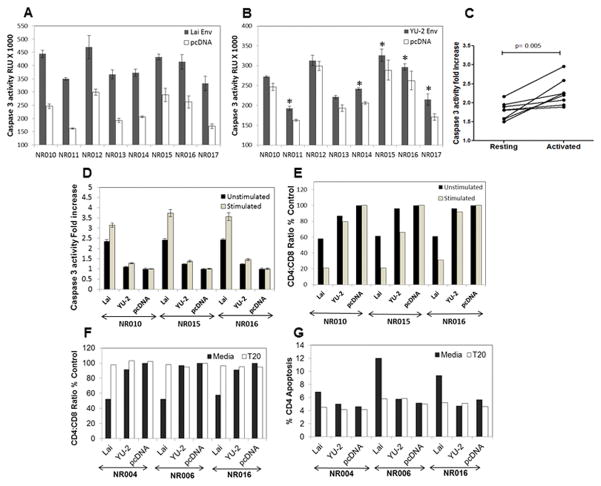
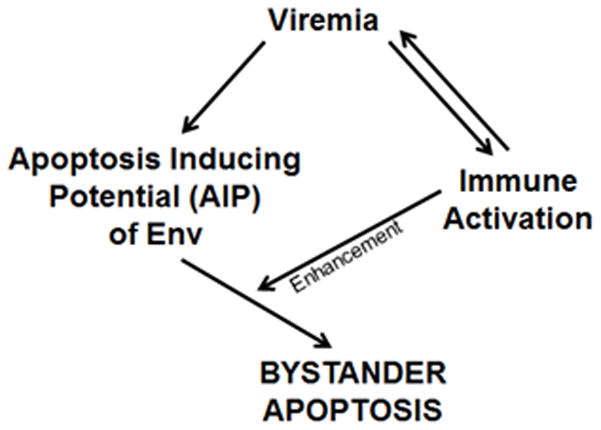
The mechanism behind the selective depletion of CD4(+) cells in HIV infections remains undetermined. Although HIV selectively infects CD4(+) cells, the relatively few infected cells in vivo cannot account for the extent of CD4(+) T cell depletion, suggesting indirect or bystander mechanisms. The role of virus replication, Env glycoprotein phenotype, and immune activation (IA) in this bystander phenomenon remains controversial. Using samples derived from HIV-infected patients, we demonstrate that, although IA in both CD4(+) and CD8(+) subsets correlates with CD4 decline, apoptosis in CD4(+) and not CD8(+) cells is associated with disease progression. Because HIV-1 Env glycoprotein has been implicated in bystander apoptosis, we cloned full-length Envs from plasma of viremic patients and tested their apoptosis-inducing potential (AIP). Interestingly, AIP of HIV-1 Env glycoproteins were found to correlate inversely with CD4:CD8 ratios, suggesting a role of Env phenotype in disease progression. In vitro mitogenic stimulation of PBMCs resulted in upregulation of IA markers but failed to alter the CD4:CD8 ratio. However, coculture of normal PBMCs with Env-expressing cells resulted in selective CD4 loss that was significantly enhanced by IA. Our study demonstrates that AIP of HIV-1 Env and IA collectively determine CD4 loss in HIV infection.
Copyright © 2016 by The American Association of Immunologists, Inc.
Figures
Similar articles
-
Host and Viral Factors in HIV-Mediated Bystander Apoptosis.Viruses. 2017 Aug 22;9(8):237. doi: 10.3390/v9080237. Viruses. 2017. PMID: 28829402 Free PMC article. Review.
-
Distinct mechanisms of CD4+ and CD8+ T-cell activation and bystander apoptosis induced by human immunodeficiency virus type 1 virions.J Virol. 2005 May;79(10):6299-311. doi: 10.1128/JVI.79.10.6299-6311.2005. J Virol. 2005. PMID: 15858014 Free PMC article.
-
Genetic signatures of HIV-1 envelope-mediated bystander apoptosis.J Biol Chem. 2014 Jan 31;289(5):2497-514. doi: 10.1074/jbc.M113.514018. Epub 2013 Nov 21. J Biol Chem. 2014. PMID: 24265318 Free PMC article.
-
Increase in frequencies of circulating Th-17 cells correlates with microbial translocation, immune activation and exhaustion in HIV-1 infected patients with poor CD4 T-cell reconstitution.Immunobiology. 2016 May;221(5):670-8. doi: 10.1016/j.imbio.2016.01.002. Epub 2016 Jan 15. Immunobiology. 2016. PMID: 26817581
-
Immunological abnormalities in the natural history of HIV infection: mechanisms and clinical relevance.Immunodefic Rev. 1992;3(3):173-93. Immunodefic Rev. 1992. PMID: 1354968 Review.
Cited by
-
HIV-1 envelope glycoproteins isolated from Viremic Non-Progressor individuals are fully functional and cytopathic.Sci Rep. 2019 Apr 3;9(1):5544. doi: 10.1038/s41598-019-42075-3. Sci Rep. 2019. PMID: 30944395 Free PMC article.
-
Imaging lymphoid tissues in nonhuman primates to understand SIV pathogenesis and persistence.Curr Opin Virol. 2016 Aug;19:77-84. doi: 10.1016/j.coviro.2016.07.002. Epub 2016 Aug 1. Curr Opin Virol. 2016. PMID: 27490446 Free PMC article. Review.
-
Host and Viral Factors in HIV-Mediated Bystander Apoptosis.Viruses. 2017 Aug 22;9(8):237. doi: 10.3390/v9080237. Viruses. 2017. PMID: 28829402 Free PMC article. Review.
-
The Interplay of HIV and Autophagy in Early Infection.Front Microbiol. 2021 Apr 28;12:661446. doi: 10.3389/fmicb.2021.661446. eCollection 2021. Front Microbiol. 2021. PMID: 33995324 Free PMC article. Review.
-
Interferon lambda rs368234815 ΔG/ΔG is associated with higher CD4+:CD8+ T-cell ratio in treated HIV-1 infection.AIDS Res Ther. 2020 Apr 15;17(1):13. doi: 10.1186/s12981-020-00269-0. AIDS Res Ther. 2020. PMID: 32295609 Free PMC article.
References
-
- d’Ettorre G, Paiardini M, Ceccarelli G, Silvestri G, Vullo V. HIV-associated immune activation: from bench to bedside. AIDS Res Hum Retroviruses. 2011;27:355–364. - PubMed
-
- Buzon MJ, Massanella M, Llibre JM, Esteve A, Dahl V, Puertas MC, Gatell JM, Domingo P, Paredes R, Sharkey M, Palmer S, Stevenson M, Clotet B, Blanco J, Martinez-Picado J. HIV-1 replication and immune dynamics are affected by raltegravir intensification of HAART-suppressed subjects. Nat Med. 2010;16:460–465. - PubMed
-
- Douek D. HIV disease progression: immune activation, microbes, and a leaky gut. Topics in HIV medicine : a publication of the International AIDS Society, USA. 2007;15:114–117. - PubMed
-
- Brenchley JM, Price DA, Schacker TW, Asher TE, Silvestri G, Rao S, Kazzaz Z, Bornstein E, Lambotte O, Altmann D, Blazar BR, Rodriguez B, Teixeira-Johnson L, Landay A, Martin JN, Hecht FM, Picker LJ, Lederman MM, Deeks SG, Douek DC. Microbial translocation is a cause of systemic immune activation in chronic HIV infection. Nat Med. 2006;12:1365–1371. - PubMed
Publication types
MeSH terms
Substances
Grants and funding
LinkOut - more resources
Full Text Sources
Other Literature Sources
Medical
Molecular Biology Databases
Research Materials
Miscellaneous