

Disruption of KIF3A in patient-derived glioblastoma cells: effects on ciliogenesis, hedgehog sensitivity, and tumorigenesis
- PMID: 26760767
- PMCID: PMC4872766
- DOI: 10.18632/oncotarget.6854
Disruption of KIF3A in patient-derived glioblastoma cells: effects on ciliogenesis, hedgehog sensitivity, and tumorigenesis
Abstract
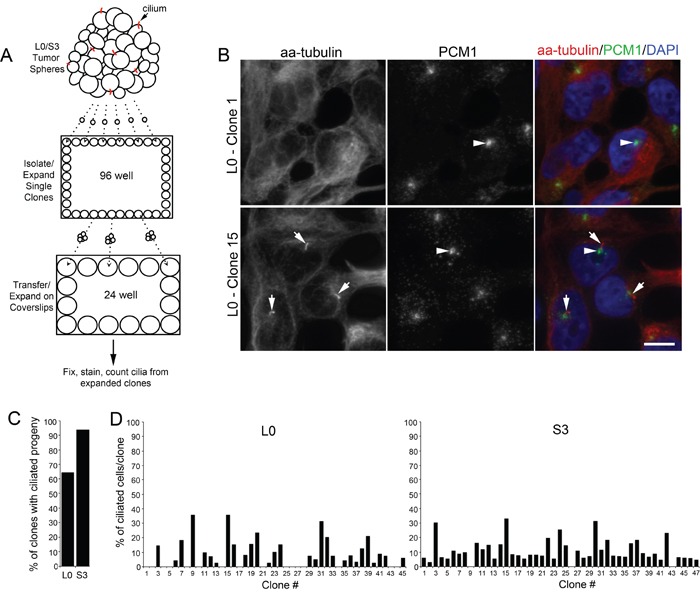
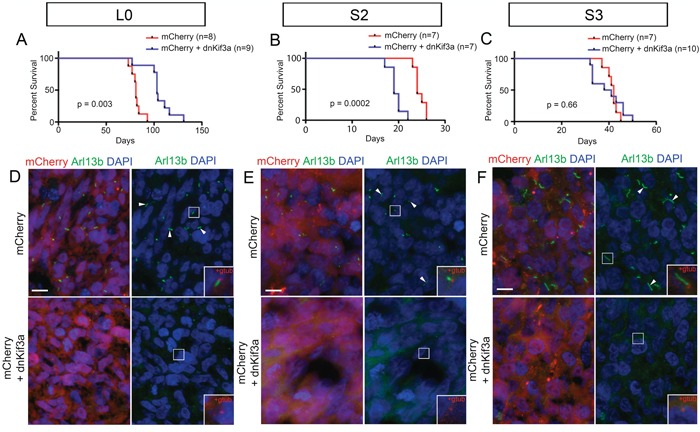
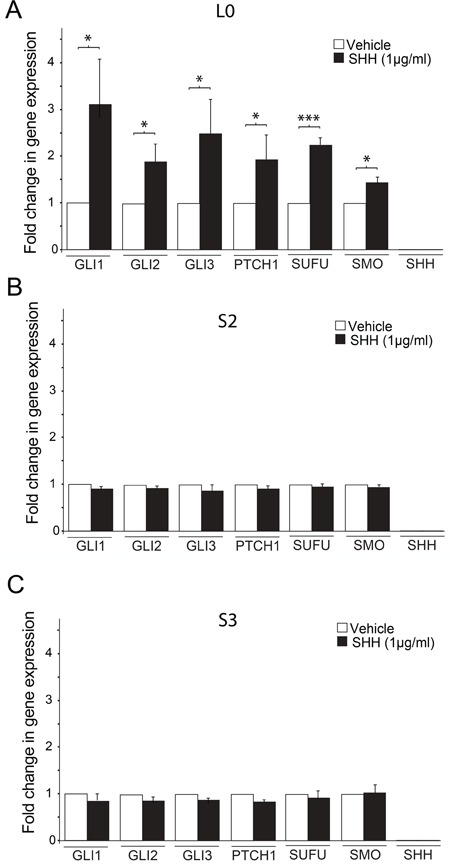
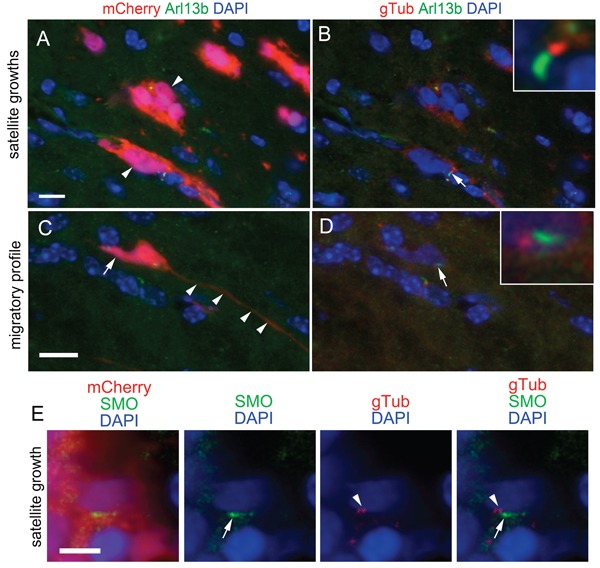
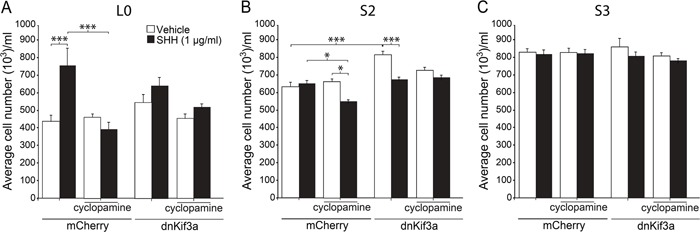
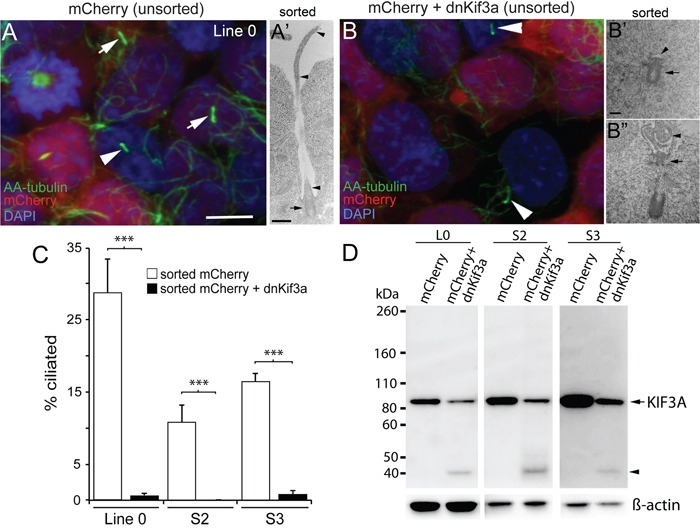
KIF3A, a component of the kinesin-2 motor, is necessary for the progression of diverse tumor types. This is partly due to its role in regulating ciliogenesis and cell responsiveness to sonic hedgehog (SHH). Notably, primary cilia have been detected in human glioblastoma multiforme (GBM) tumor biopsies and derived cell lines. Here, we asked whether disrupting KIF3A in GBM cells affected ciliogenesis, in vitro growth and responsiveness to SHH, or tumorigenic behavior in vivo. We used a lentiviral vector to create three patient-derived GBM cell lines expressing a dominant negative, motorless form of Kif3a (dnKif3a). In all unmodified lines, we found that most GBM cells were capable of producing ciliated progeny and that dnKif3a expression in these cells ablated ciliogenesis. Interestingly, unmodified and dnKif3a-expressing cell lines displayed differential sensitivities and pathway activation to SHH and variable tumor-associated survival following mouse xenografts. In one cell line, SHH-induced cell proliferation was prevented in vitro by either expressing dnKif3a or inhibiting SMO signaling using cyclopamine, and the survival times of mice implanted with dnKif3a-expressing cells were increased. In a second line, expression of dnKif3a increased the cells' baseline proliferation while, surprisingly, sensitizing them to SHH-induced cell death. The survival times of mice implanted with these dnKif3a-expressing cells were decreased. Finally, expression of dnKif3a in a third cell line had no effect on cell proliferation, SHH sensitivity, or mouse survival times. These findings indicate that KIF3A is essential for GBM cell ciliogenesis, but its role in modulating GBM cell behavior is highly variable.
Keywords: brain tumor; cilium; intraflagellar transport; kinesin-2; sonic hedgehog.
Conflict of interest statement
The authors declare no conflicts of interest.
Figures
Similar articles
-
Multifaceted Functions of Rab23 on Primary Cilium-Mediated and Hedgehog Signaling-Mediated Cerebellar Granule Cell Proliferation.J Neurosci. 2021 Aug 11;41(32):6850-6863. doi: 10.1523/JNEUROSCI.3005-20.2021. Epub 2021 Jul 1. J Neurosci. 2021. PMID: 34210780 Free PMC article.
-
In vitro and in vivo characterization of a novel Hedgehog signaling antagonist in human glioblastoma cell lines.Int J Cancer. 2012 Jul 15;131(2):E33-44. doi: 10.1002/ijc.27349. Epub 2012 Jan 31. Int J Cancer. 2012. PMID: 22072503
-
Modulation of Sonic hedgehog signaling and WW domain containing oxidoreductase WOX1 expression enhances radiosensitivity of human glioblastoma cells.Exp Biol Med (Maywood). 2015 Mar;240(3):392-9. doi: 10.1177/1535370214565989. Epub 2015 Jan 16. Exp Biol Med (Maywood). 2015. PMID: 25595187 Free PMC article.
-
Hedgehog trafficking, cilia and brain functions.Differentiation. 2012 Feb;83(2):S97-104. doi: 10.1016/j.diff.2011.11.011. Epub 2011 Dec 9. Differentiation. 2012. PMID: 22169886 Review.
-
Primary Cilia and Mammalian Hedgehog Signaling.Cold Spring Harb Perspect Biol. 2017 May 1;9(5):a028175. doi: 10.1101/cshperspect.a028175. Cold Spring Harb Perspect Biol. 2017. PMID: 27881449 Free PMC article. Review.
Cited by
-
Primary cilia-associated signalling in squamous cell carcinoma of head and neck region.Front Oncol. 2024 Aug 21;14:1413255. doi: 10.3389/fonc.2024.1413255. eCollection 2024. Front Oncol. 2024. PMID: 39234399 Free PMC article. Review.
-
Kinesin family member 3A stimulates cell proliferation, migration, and invasion of bladder cancer cells in vitro and in vivo.FEBS Open Bio. 2021 May;11(5):1487-1496. doi: 10.1002/2211-5463.12768. Epub 2021 May 2. FEBS Open Bio. 2021. Retraction in: FEBS Open Bio. 2024 Mar;14(3):528. doi: 10.1002/2211-5463.13756. PMID: 31774623 Free PMC article. Retracted.
-
Glioma cell proliferation is enhanced in the presence of tumor-derived cilia vesicles.Cilia. 2018 Nov 6;7:6. doi: 10.1186/s13630-018-0060-5. eCollection 2018. Cilia. 2018. PMID: 30410731 Free PMC article.
-
Emerging Roles of Primary Cilia in Glioma.Front Cell Neurosci. 2019 Feb 20;13:55. doi: 10.3389/fncel.2019.00055. eCollection 2019. Front Cell Neurosci. 2019. PMID: 30842728 Free PMC article. Review.
-
Primary cilium and glioblastoma.Ther Adv Med Oncol. 2018 Oct 3;10:1758835918801169. doi: 10.1177/1758835918801169. eCollection 2018. Ther Adv Med Oncol. 2018. PMID: 30302130 Free PMC article. Review.
References
-
- Stupp R, Mason WP, van den Bent MJ, Weller M, Fisher B, Taphoorn MJ, Belanger K, Brandes AA, Marosi C, Bogdahn U, Curschmann J, Janzer RC, Ludwin SK, Gorlia T, Allgeier A, Lacombe D, et al. Radiotherapy plus concomitant and adjuvant temozolomide for glioblastoma. N Engl J Med. 2005;352:987–996. - PubMed
-
- Charles NA, Holland EC, Gilbertson R, Glass R, Kettenmann H. The brain tumor microenvironment. Glia. 2012;60:502–514. - PubMed
-
- Janbazian L, Karamchandani J, Das S. Mouse models of glioblastoma: lessons learned and questions to be answered. J Neurooncol. 2014;118:1–8. - PubMed
Publication types
MeSH terms
Substances
LinkOut - more resources
Full Text Sources
Other Literature Sources
Miscellaneous
