. 2016 Jan 26;113(4):1044-9.
doi: 10.1073/pnas.1513607113. Epub 2016 Jan 11.

Imaging of the cross-presenting dendritic cell subsets in the skin-draining lymph node

Affiliations

Imaging of the cross-presenting dendritic cell subsets in the skin-draining lymph node

Masahiro Kitano et al. Proc Natl Acad Sci U S A. .

Abstract

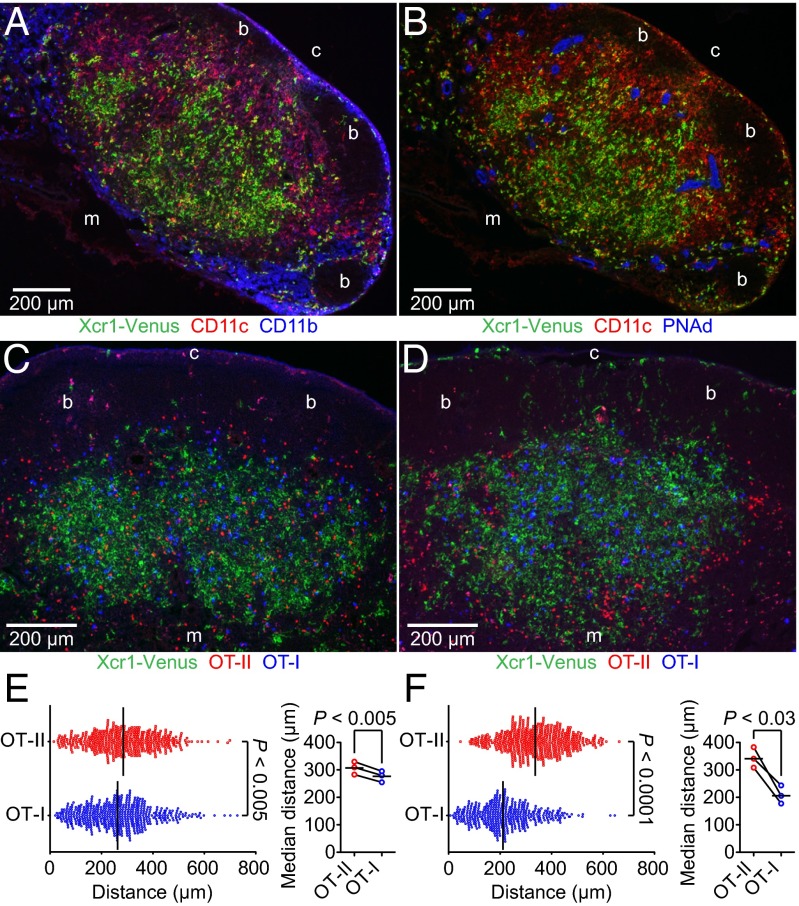
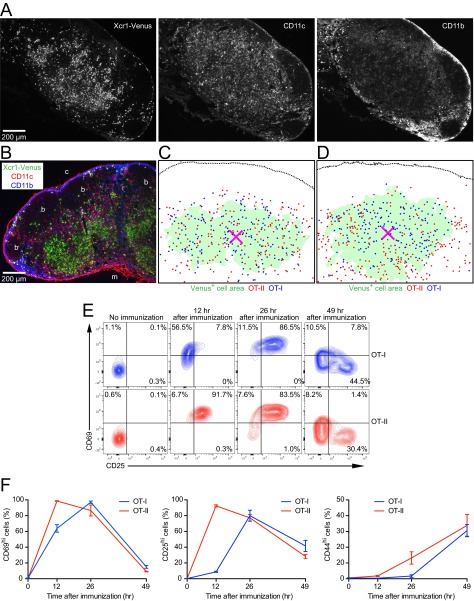
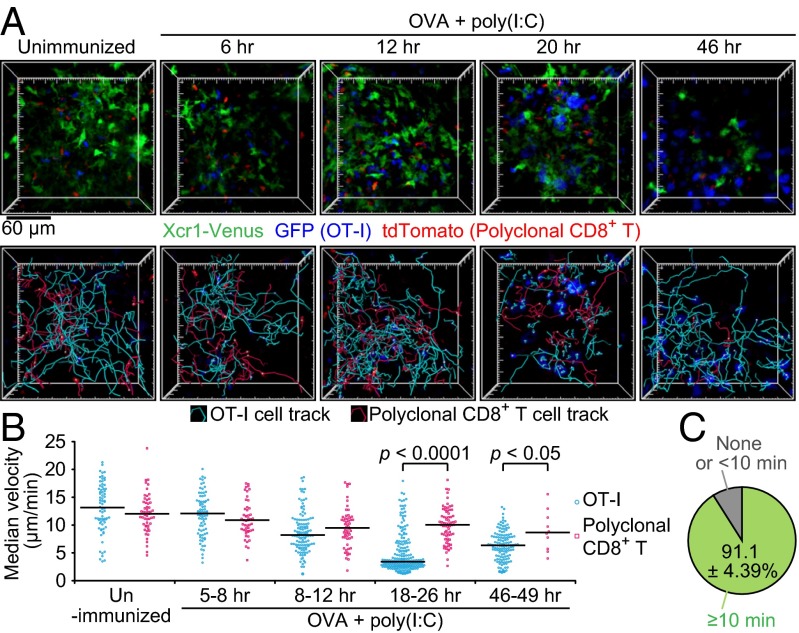
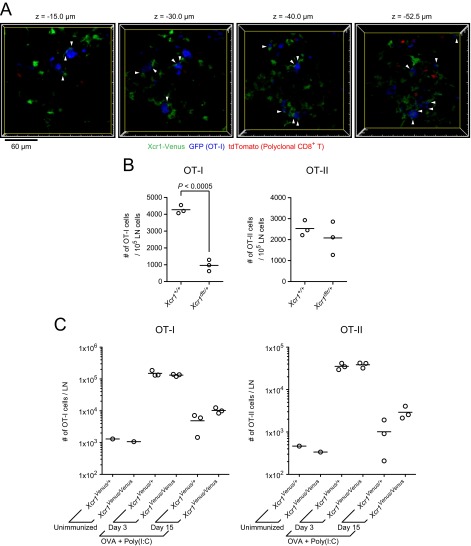
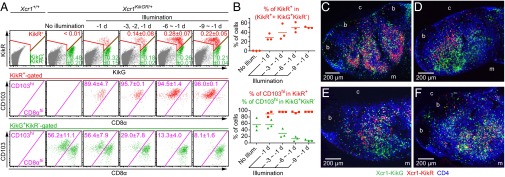
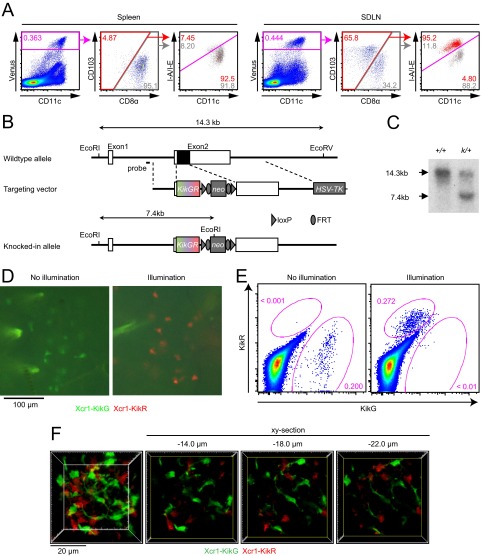
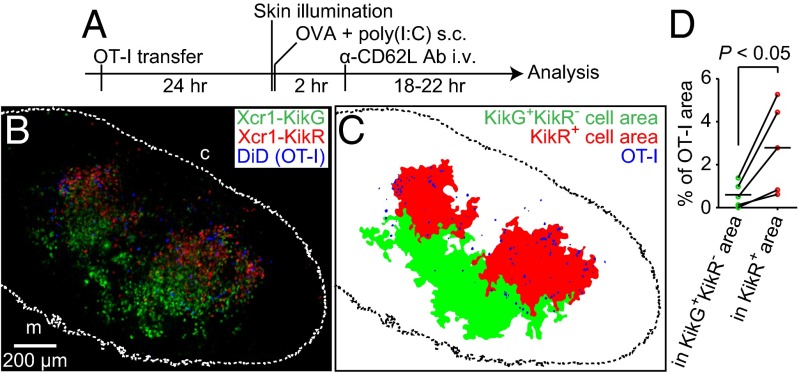
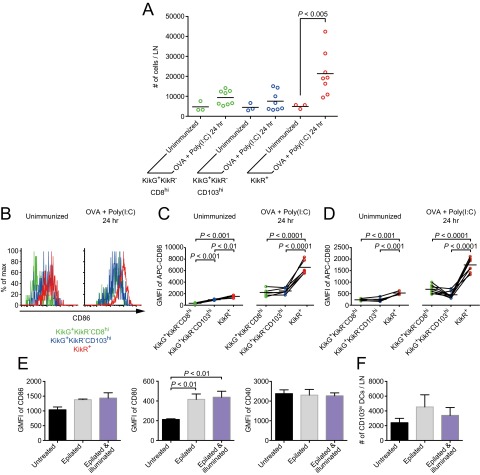
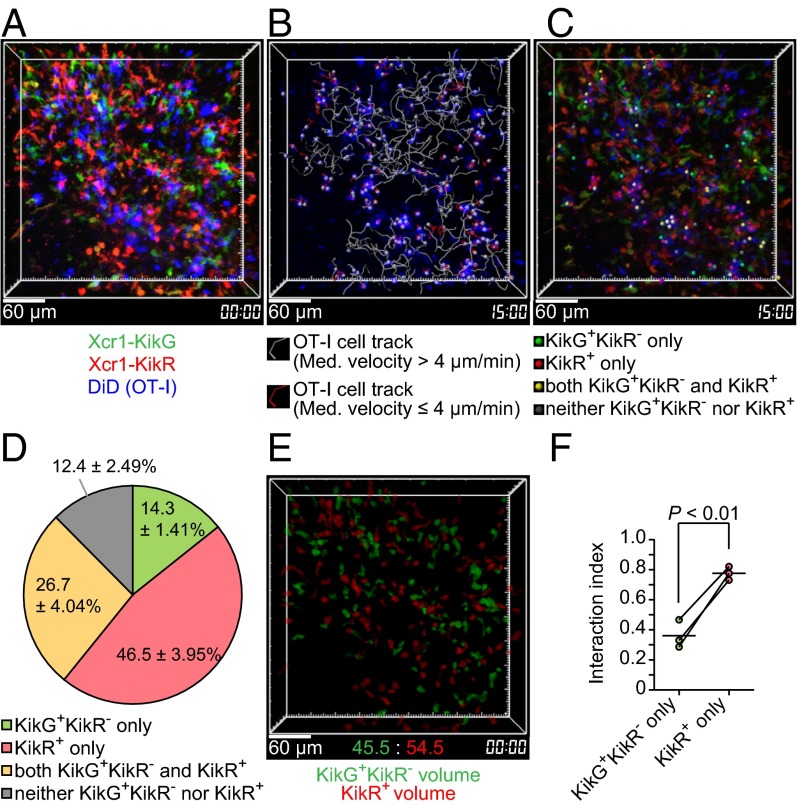
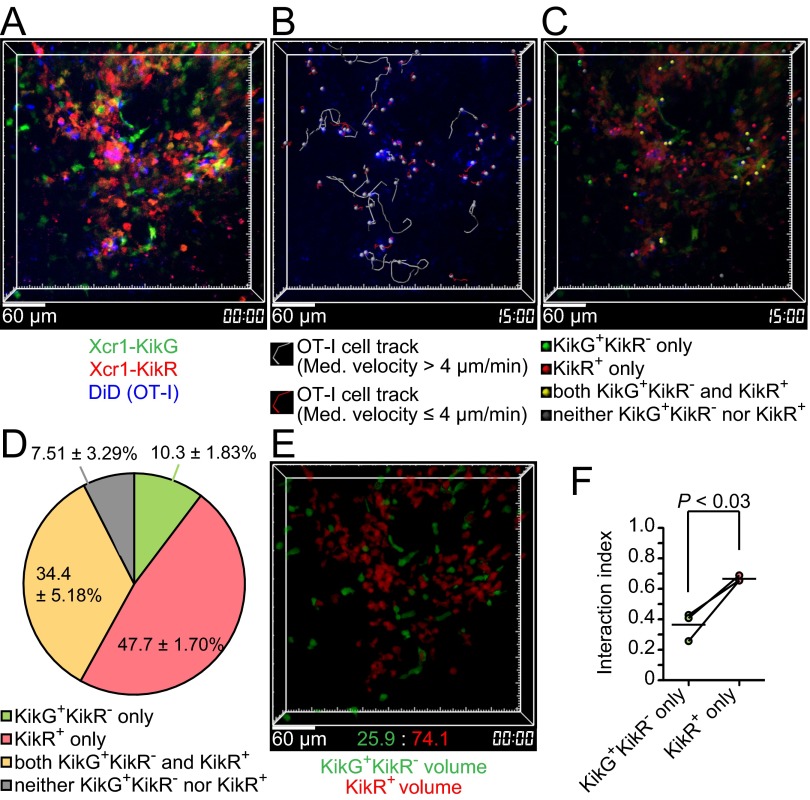
Dendritic cells (DCs) are antigen-presenting cells specialized for activating T cells to elicit effector T-cell functions. Cross-presenting DCs are a DC subset capable of presenting antigens to CD8(+) T cells and play critical roles in cytotoxic T-cell-mediated immune responses to microorganisms and cancer. Although their importance is known, the spatiotemporal dynamics of cross-presenting DCs in vivo are incompletely understood. Here, we study the T-cell zone in skin-draining lymph nodes (SDLNs) and find it is compartmentalized into regions for CD8(+) T-cell activation by cross-presenting DCs that express the chemokine (C motif) receptor 1 gene, Xcr1 and for CD4(+) T-cell activation by CD11b(+) DCs. Xcr1-expressing DCs in the SDLNs are composed of two different populations: migratory (CD103(hi)) DCs, which immigrate from the skin, and resident (CD8α(hi)) DCs, which develop in the nodes. To characterize the dynamic interactions of these distinct DC populations with CD8(+) T cells during their activation in vivo, we developed a photoconvertible reporter mouse strain, which permits us to distinctively visualize the migratory and resident subsets of Xcr1-expressing DCs. After leaving the skin, migratory DCs infiltrated to the deep T-cell zone of the SDLNs over 3 d, which corresponded to their half-life in the SDLNs. Intravital two-photon imaging showed that after soluble antigen immunization, the newly arriving migratory DCs more efficiently form sustained conjugates with antigen-specific CD8(+) T cells than other Xcr1-expressing DCs in the SDLNs. These results offer in vivo evidence for differential contributions of migratory and resident cross-presenting DCs to CD8(+) T-cell activation.

Keywords: CD8+ T cell; cross-presentation; dendritic cell; intravital two-photon imaging; photoconversion.


Conflict of interest statement

The authors declare no conflict of interest.

Figures

Fig. 1.
Fig. 1.
Localization of Xcr1-expressing DCs and spatial segregation of antigen-engaged CD8+ T cells and CD4+ T cells in the SDLNs. (A and B) Immunofluorescence images of serial inguinal LN sections from an unimmunized Xcr1Venus/+ mouse. Fig. S1 shows the grayscale images of the individual fluorescence channels in A. (C and D) Fluorescence images of inguinal LN sections from Xcr1Venus/+ mice transferred with 5 × 10⁶ DiD-labeled OT-I T cells and 5 × 10⁶ tdTomato+ OT-II T cells. The LN sections are from an unimmunized mouse (C) and a mouse s.c. immunized with soluble OVA plus poly(I:C) for 24 h (D). “b,” “c,” and “m” indicate B-cell follicle, cortical side, and medullary side, respectively. (E and F) (Left) Distances between the Xcr1-Venus+ cell area centroid and individual OT-I or OT-II T cells. Each symbol represents one cell. Bars indicate median values in each group. Data are pooled from three images of different lymph nodes from unimmunized mice (E) or mice immunized with OVA plus poly(I:C) for 24 h (F). Fig. S1 C and D shows the processed images used for data analysis. Bars indicate mean values in each group.
Fig. S1.
Fig. S1.
Single-channel images of Fig.1A, XCR1-independent localization of cross-presenting DCs in the SDLN, processed images of Fig. 1 C and D, and up-regulation of T-cell activation markers after immunization. (A) Grayscale images of the individual colors in Fig.1A. (B) Immunofluorescence image of a LN section from an unimmunized Xcr1Venus/Venus mouse. “b,” “c,” and “m” indicate B-cell follicle, cortical side, and medullary side, respectively. (C and D) Processed images of Fig. 1 C and D, respectively, for measuring the distances between the centroid of the Xcr1-expressing DC-rich region and antigen-specific T cells. The magenta X mark represents the area centroid of Xcr1-Venus+ cell area, demarcated as described in SI Materials and Methods. Each dot corresponds to the cell centroid of an OT-I or an OT-II T cell. (E and F) Flow cytometric analysis of activation marker expressions of OT-I T cells and OT-II T cells in SDLNs at indicated time points after immunization. Percentages of CD69hi cells, CD25hi cells, and CD44hi cells are shown in F. Data represent mean ± SEM (n = 3).
Fig. 2.
Fig. 2.
Xcr1-expressing DCs are the main interaction partners of antigen-specific CD8+ T cells. Xcr1Venus/+ mice were cotransferred with 4 × 10⁶ GFP+ OT-I T cells and 1 × 10⁶ tdTomato+ polyclonal CD8+ T cells, s.c. immunized with soluble OVA plus poly(I:C), and subjected to intravital imaging of inguinal LNs. (A) The 3D-rendered fluorescence images, OT-I T-cell tracks, and polyclonal CD8+ T-cell tracks at the indicated time postimmunization. Imaging duration, 30 min; image depth, 75 μm (Movie S1). (B) Median velocity of OT-I T cells and polyclonal CD8+ T cells. Each symbol represents one cell. Bars indicate median values in each group. Data are pooled from at least two imaging sessions in different LNs. (C) Percentage of OT-I T cells stably interacting with Xcr1-expressing DCs in low-motility OT-I T cells (Fig. S2A and Movie S2). Values represent mean ± SEM (n = 3; 46, 18, and 69 low-motility OT-I T cells scored in each experiment).
Fig. S2.
Fig. S2.
Stable interactions of Xcr1-expressing DCs with antigen-specific CD8+ T cells, assessment of the cellular roles for Xcr1-expressing DCs, and assessment of the molecular roles for XCR1 in the CD8+ T-cell response. (A) Single x–y plane fluorescence images of the LN at 20 h postimmunization in Fig. 2A. The arrowheads highlight the stable cell–cell contacts lasting more than 10 min between low-motility OT-I T cells (median velocity ≤4 μm) and Xcr1-expressing DCs (Movie S2). (B) Numbers of transferred OT-I T cells and OT-II T cells in the draining LNs of Xcr1+/+ mice and Xcr1DTRVenus/+ mice. The mice were treated with DT three times, i.e., 1 d before, 1 d after, and 3 d after s.c. immunization with soluble OVA plus poly(I:C). LN cells were analyzed by flow cytometry at 4 d postimmunization. Each symbol represents one mouse. Shown is a representation of similar results from two independent experiments. (C) Totals of 5 × 10⁵ OT-I T cells and 5 × 10⁵ OT-II T cells were cotransferred into Xcr1Venus/+ and Xcr1Venus/Venus mice on day −1. On day 0, the mice were s.c. immunized with 200 µg of OVA plus 20 µg of poly(I:C), and on day 3 and day 15, the draining LNs were analyzed by flow cytometry (unimmunized LNs were analyzed on day 3). Each symbol represents one mouse.
Fig. 3.
Fig. 3.
Photoconversion-based fluorescent labeling of Xcr1-expressing CD103hi migratory DCs and Xcr1-expressing CD8αhi resident DCs in the SDLNs. (A) Flow cytometry of inguinal LN cells from Xcr1KikGR/+ mice illuminated with violet-blue light at the indicated time points. Values represent mean ± SEM (n = 3). (B) Percentage of the indicated cell populations. Each symbol represents one mouse. (C–F) Confocal images of halves of inguinal LN sagittal slices from Xcr1KikGR/+ mice illuminated with violet-blue light once a day for 9 d (C), 1 d before analysis (D), 2 d before analysis (E), and 3 d before analysis (F). Shown is an x–y plane approximately 20 μm deep from the vibratome slice surface. “b,” “c,” and “m” indicate B-cell follicle, cortical side, and medullary side, respectively.
Fig. S3.
Fig. S3.
Xcr1-expressing DC subsets in the SDLN, generation of the Xcr1KikGR mouse strain, and photoconversion of Xcr1-expressing DCs in the skin. (A) Flow cytometry of the Xcr1Venus/+ mouse spleen and SDLN. (B) Schematic representation of the mouse Xcr1 wild-type allele, the targeting vector, and the KikGR knocked-in allele. Solid and open boxes denote coding and noncoding regions of Xcr1, respectively. neo, neomycin resistance gene; HSV-TK, herpes simplex virus thymidine kinase gene. (C) Southern blot analysis of Xcr1 wild-type (+/+) and Xcr1KikGR/+ (k/+) mice. Genomic DNAs were digested with EcoRI and EcoRV, electrophoresed, and hybridized with a radiolabeled probe indicated in B. Southern blot gave a 14.3-kbp and a 7.4-kbp band for the wild-type and KikGR knocked-in alleles, respectively. (D) Fluorescence images of the Xcr1KikGR/+ mouse skin with and without violet-blue light illumination. (E) Flow cytometry of cells isolated from the dermis of an Xcr1KikGR/+ mouse illuminated with violet-blue light. (F) Two-photon imaging of the intact inguinal LN of an Xcr1KikGR/+ mouse illuminated with violet-blue light as in Fig. 3D. A 3D-rendered image (F, Far Left; image depth, 50 μm) and single x–y plane fluorescence images at the indicated z distance from the top x–y plane of the 3D image volume are shown (Movie S3).
Fig. 4.
Fig. 4.
Antigen-specific CD8+ T cells colocalize with Xcr1+ migratory DCs that have arrived in the SDLN after immunization. (A) Experimental design. (B) A fluorescence image of a half of an inguinal LN sagittal slice from an Xcr1KikGR/+ mouse treated as described in A. A maximal projection image of six confocal sections (35-μm depth) is shown. The dotted line demarcates the LN boundary. “c” and “m” indicate cortical side and medullary side, respectively (C) Demarcation of the KikG+KikR area, the KikR+ area, and the OT-I T-cell–occupied area in the image shown in B. See SI Materials and Methods for the demarcation method. (D) Area occupancy by OT-I T cells in the KikG+KikR area and in the KikR+ area calculated from the data in C and four other datasets.
Fig. S4.
Fig. S4.
Activation of Xcr1+ migratory DCs upon immunization and assessment of illumination-induced effects on migratory DC properties. (A) Enumeration of the indicated cell populations in the inguinal LNs of Xcr1KikGR/+ mice. (B–D) Flow cytometric analysis of CD86 (B and C) and CD80 (D) expression on the indicated cell populations in the inguinal LNs of Xcr1KikGR/+ mice. (E and F) Xcr1KikGR/+ mice were epilated with depilatory cream, and on the following day the mice were illuminated with violet-blue light (SI Materials and Methods). After 24 h the inguinal LNs were analyzed by flow cytometry. Geometric mean of fluorescence intensity (GMFI) of the indicated DC activation markers (E) and the cell numbers (F) of Xcr1+CD103hi DCs are shown. Data represent mean ± SEM (n = 3).
Fig. 5.
Fig. 5.
Antigen-specific CD8+ T cells preferentially interact with Xcr1+ migratory DCs that arrived in the SDLN after immunization. (A) An intravital two-photon image of an inguinal LN of an Xcr1KikGR/+ mouse treated as in Fig. 4A, except that 8 × 10⁶ OT-I T cells were transferred. A 3D-rendered fluorescence image is shown. Image depth: 100 μm (Movie S5). (B) OT-I T-cell tracks. Imaging duration: 30 min. (C) The interaction partners of low-motility OT-I T cells (median velocity ≤4 μm). The colored dots were placed on low-motility OT-I T cells interacting with the indicated cells (Movie S6). (D) Percentage of the interaction partners of low-motility OT-I T cells. Data represent mean ± SEM (n = 3, 43, 113, and 121 stable interactions lasting more than 10 min in each experiment). (E) Reconstructed KikG+KikR cell volumes and KikR+ cell volumes. (F) Interaction index (SI Materials and Methods). Each pair of red and green symbols represents one mouse.
Fig. S5.
Fig. S5.
Cell–cell interaction analysis of antigen-specific CD8+ T cells with Xcr1+ migratory DCs using the 9-d illumination protocol. (A) An intravital two-photon image of an inguinal LN of an Xcr1KikGR/+ mouse treated as described in Fig. 4A, except that the mouse was illuminated with violet-blue light once a day for 8 d before the immunization and transferred with 7 × 10⁶ OT-I T cells. A 3D-rendered fluorescence image is shown. Image depth: 100 μm. (B) OT-I T-cell tracks. Imaging duration: 30 min. (C) The interaction partners of low-motility OT-I T cells (median velocity ≤4 μm). The colored dots were placed on low-motility OT-I T cells interacting with the indicated cells. (D) Percentage of the interaction partners of low-motility OT-I T cells. Data represent mean ± SEM (n = 3, 60, 57, and 57 stable interactions lasting more than 10 min in each experiment). (E) Reconstructed KikG+KikR cell volumes and KikR+ cell volumes. (F) Interaction index (SI Materials and Methods). Each pair of red and green symbols represents one lymph node.

Similar articles

Cited by

References

    1. Mellman I, Steinman RM. Dendritic cells: Specialized and regulated antigen processing machines. Cell. 2001;106(3):255–258. - PubMed
    1. Germain RN, Robey EA, Cahalan MD. A decade of imaging cellular motility and interaction dynamics in the immune system. Science. 2012;336(6089):1676–1681. - PMC - PubMed
    1. Henrickson SE, et al. In vivo imaging of T cell priming. Sci Signal. 2008;1(12):pt2. - PubMed
    1. Moreau HD, Bousso P. Visualizing how T cells collect activation signals in vivo. Curr Opin Immunol. 2014;26:56–62. - PubMed
    1. Joffre OP, Segura E, Savina A, Amigorena S. Cross-presentation by dendritic cells. Nat Rev Immunol. 2012;12(8):557–569. - PubMed

Publication types