Low adherent cancer cell subpopulations are enriched in tumorigenic and metastatic epithelial-to-mesenchymal transition-induced cancer stem-like cells
- PMID: 26752044
- PMCID: PMC4707518
- DOI: 10.1038/srep18772
Low adherent cancer cell subpopulations are enriched in tumorigenic and metastatic epithelial-to-mesenchymal transition-induced cancer stem-like cells
Abstract
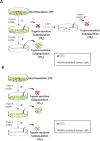
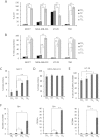
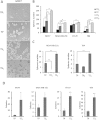
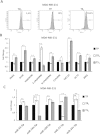
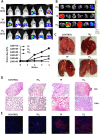
Cancer stem cells are responsible for tumor progression, metastasis, therapy resistance and cancer recurrence, doing their identification and isolation of special relevance. Here we show that low adherent breast and colon cancer cells subpopulations have stem-like properties. Our results demonstrate that trypsin-sensitive (TS) breast and colon cancer cells subpopulations show increased ALDH activity, higher ability to exclude Hoechst 33342, enlarged proportion of cells with a cancer stem-like cell phenotype and are enriched in sphere- and colony-forming cells in vitro. Further studies in MDA-MB-231 breast cancer cells reveal that TS subpopulation expresses higher levels of SLUG, SNAIL, VIMENTIN and N-CADHERIN while show a lack of expression of E-CADHERIN and CLAUDIN, being this profile characteristic of the epithelial-to-mesenchymal transition (EMT). The TS subpopulation shows CXCL10, BMI-1 and OCT4 upregulation, differing also in the expression of several miRNAs involved in EMT and/or cell self-renewal such as miR-34a-5p, miR-34c-5p, miR-21-5p, miR-93-5p and miR-100-5p. Furthermore, in vivo studies in immunocompromised mice demonstrate that MDA-MB-231 TS cells form more and bigger xenograft tumors with shorter latency and have higher metastatic potential. In conclusion, this work presents a new, non-aggressive, easy, inexpensive and reproducible methodology to isolate prospectively cancer stem-like cells for subsequent biological and preclinical studies.
Figures


Similar articles
-
Isolation and characterization of CD105+/CD90+ subpopulation in breast cancer MDA-MB-231 cell line.Int J Clin Exp Pathol. 2015 May 1;8(5):5105-12. eCollection 2015. Int J Clin Exp Pathol. 2015. PMID: 26191205 Free PMC article.
-
Coexpression of gene Oct4 and Nanog initiates stem cell characteristics in hepatocellular carcinoma and promotes epithelial-mesenchymal transition through activation of Stat3/Snail signaling.J Hematol Oncol. 2015 Mar 11;8:23. doi: 10.1186/s13045-015-0119-3. J Hematol Oncol. 2015. PMID: 25879771 Free PMC article.
-
MicroRNA-9 is associated with epithelial-mesenchymal transition, breast cancer stem cell phenotype, and tumor progression in breast cancer.Breast Cancer Res Treat. 2014 Aug;147(1):39-49. doi: 10.1007/s10549-014-3069-5. Epub 2014 Aug 3. Breast Cancer Res Treat. 2014. PMID: 25086633
-
Epithelial-to-mesenchymal transition: what is the impact on breast cancer stem cells and drug resistance.Cancer Treat Rev. 2014 Apr;40(3):341-8. doi: 10.1016/j.ctrv.2013.09.008. Epub 2013 Sep 15. Cancer Treat Rev. 2014. PMID: 24090504 Review.
-
Cancer stem cells: problems for therapy?J Pathol. 2011 Jan;223(2):147-61. doi: 10.1002/path.2793. Epub 2010 Oct 25. J Pathol. 2011. PMID: 21125672 Review.
Cited by
-
A reliable mouse model of liver and lung metastasis by injecting esophageal cancer stem cells (CSCs) through tail-vein injection.Mol Biol Rep. 2023 Apr;50(4):3401-3411. doi: 10.1007/s11033-023-08294-8. Epub 2023 Feb 8. Mol Biol Rep. 2023. PMID: 36753017
-
HNRNPA2/B1 is upregulated in endocrine-resistant LCC9 breast cancer cells and alters the miRNA transcriptome when overexpressed in MCF-7 cells.Sci Rep. 2019 Jul 1;9(1):9430. doi: 10.1038/s41598-019-45636-8. Sci Rep. 2019. PMID: 31263129 Free PMC article.
-
Long non-coding RNA SOX2OT promotes cell proliferation and motility in human ovarian cancer.Exp Ther Med. 2018 Feb;15(2):2182-2188. doi: 10.3892/etm.2017.5618. Epub 2017 Dec 12. Exp Ther Med. 2018. PMID: 29434823 Free PMC article.
-
Targeting Key Signaling Pathways in Glioblastoma Stem Cells for the Development of Efficient Chemo- and Immunotherapy.Int J Mol Sci. 2022 Oct 26;23(21):12919. doi: 10.3390/ijms232112919. Int J Mol Sci. 2022. PMID: 36361720 Free PMC article.
-
Cytomorphology and Gene Expression Signatures of Anchorage-independent Aggregations of Oral Cancer Cells.Cancer Genomics Proteomics. 2023 Jan-Feb;20(1):64-74. doi: 10.21873/cgp.20365. Cancer Genomics Proteomics. 2023. PMID: 36581338 Free PMC article.
References
Publication types
MeSH terms
Substances
LinkOut - more resources
Full Text Sources
Other Literature Sources
Research Materials
Miscellaneous

