. 2016 Feb 2;7(5):5892-908.
doi: 10.18632/oncotarget.6824.

Gastro-duodenal fluid induced nuclear factor-κappaB activation and early pre-malignant alterations in murine hypopharyngeal mucosa

Affiliations

Gastro-duodenal fluid induced nuclear factor-κappaB activation and early pre-malignant alterations in murine hypopharyngeal mucosa

Dimitra P Vageli et al. Oncotarget. .

Abstract

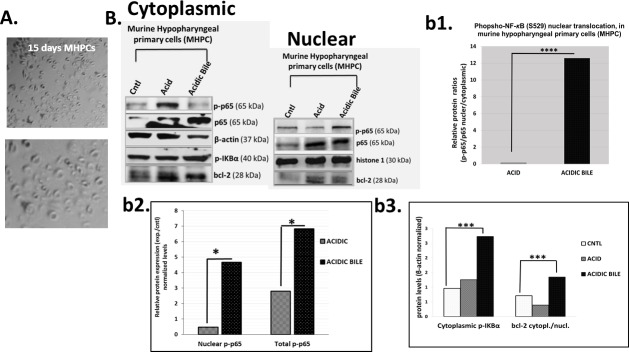
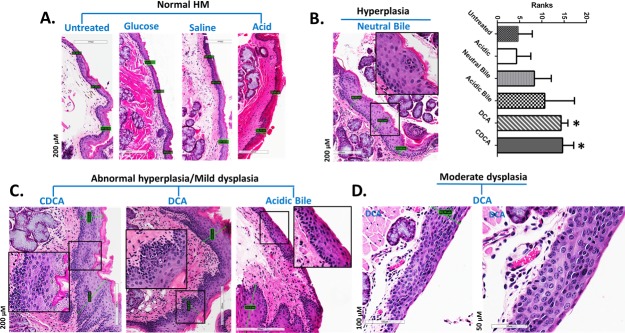
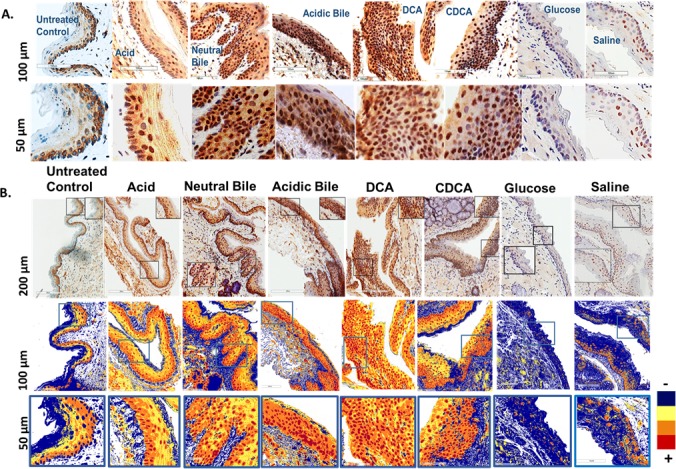
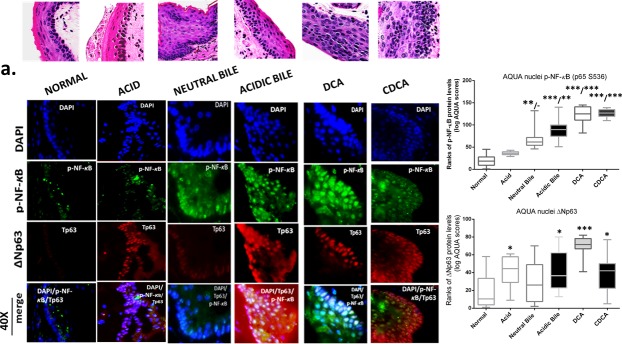
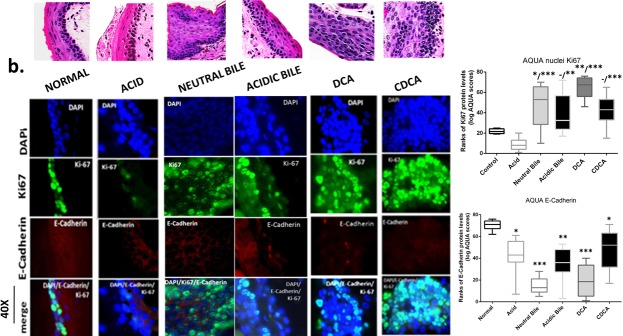
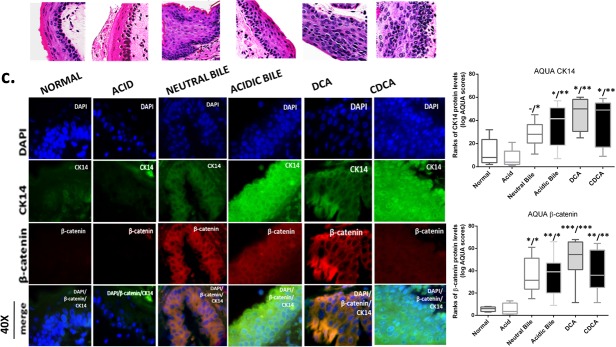
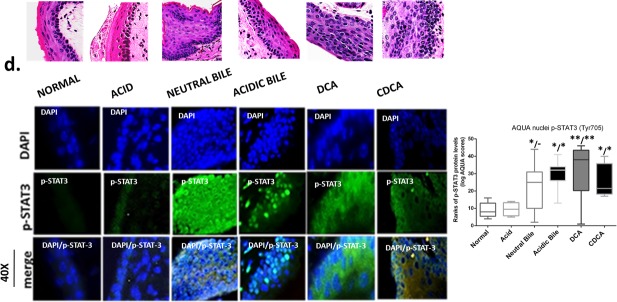
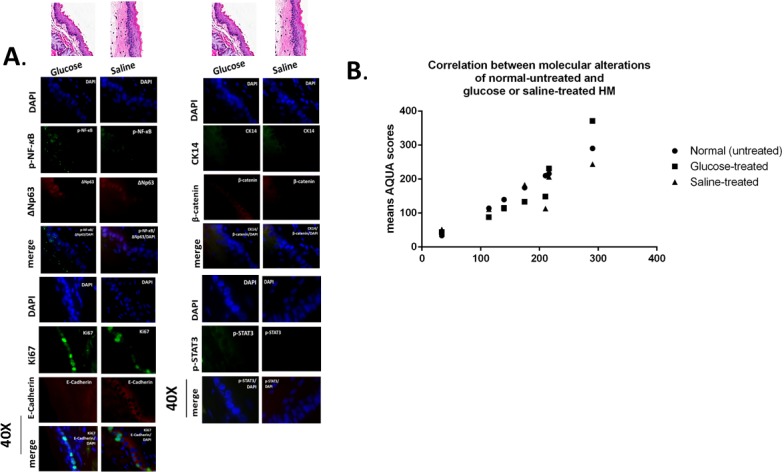
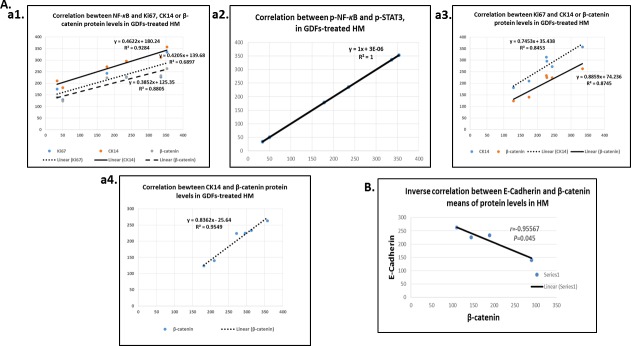
We recently described the role of gastro-duodenal fluids (GDFs) in generating changes consistent with hypopharyngeal neoplasia through activation of NF-κB pathway, using an in vitro model of human hypopharyngeal normal keratinocytes. Here, we further provide evidence that gastro-duodenal reflux is a risk factor for early pre-malignant alterations in hypopharyngeal mucosa (HM) related to an activated NF-κB oncogenic pathway, using both an in vitro and a novel in vivo model of C57Bl/6J mice. Histological, immunohistochemical and automated quantitative analysis documents significant NF-κB activation and early pre-malignant alterations in HM topically exposed to GDFs, compared to acid alone and other controls. Early pre-malignant histologic lesions exhibited increased Ki67, CK14 and ΔNp63, cell proliferation markers, changes of cell adhesion molecules, E-Cadherin and β-catenin, and STAT3 activation. The in vivo effect of NF-κB activation is positively correlated with p-STAT3, Ki67, CK14 or β-catenin expression, while GDFs induce significant transcriptional activation of RELA(p65), bcl-2, TNF-α, STAT3, EGFR and wnt5A, in vivo. Our in vivo model demonstrates selectively activated NF-κB in response to topically administrated GDFs, leading to early pre-malignant events in HM.

Keywords: NF-κB; bile acids; gastroduodenal reflux; hypopharyngeal cancer; in vivo.


Conflict of interest statement

CONFLICTS OF INTEREST

There is no conflict of interest.

Figures

Figure 1
Figure 1. Gastro-duodenal fluids (GDFs) induced NF-κB activation and bcl-2 overexpression in murine hypopharyngeal primary cells (MHPCs), in vitro
A. Murine Hypopharyngeal Primary Cells (MHPCs) cultured in KGM-2 SFM medium for 15 days after dissociation of cells from hypopharyngeal tissue of C57Bl6J mice. B. Western blot analysis for total NF-κB (p65), p-NF-κB (p-p65), p-IKBα and bcl-2 protein levels (b1) nuclear p-NF-κB (p-p65 S529) translocation value (nuclear/cytoplasmic p-p65/p65 ratios); (b2) nuclear and total p-NF-κB (p-p65) experimental to untreated control (exp./control) expression ratios; (b3) cytoplasmic p-IKBα (Ser32/36) and cytoplasmic/nuclear bcl-2 levels (*p < 0.05; ***p < 0.0005,****p < 0.0005; by z-test).
Figure 2
Figure 2. GDFs-induced premalignant lesions in murine hypopharyngeal mucosa of C57BL6J mice (H&E staining)
A. Normal HM: keratinized stratified squamous epithelium/single layer of basal cells. B. Hyperplastic HM: thickness of stratified epithelium and hyperchromatic or pleiomorphic basal cells expanding in the stratum spinosum. Columns of graph created be GrapPad software, correspond to thickness means of HM under different treatment. The upper line of column indicate the highest measurement. (*p < 0.05; ANOVA, Kruskal-Wallis test; Graph Pad Prism 6.0). C. Abnormal hyperplastic/mild dysplastic HM: thickness of stratified epithelium, hyperchromatic or pleiomorphic basal cells expanding in the stratum spinosum, nuclear atypia into the middle third of the mucosa. D. Moderate dysplastic HM: full-thickness, nuclear hyperchromatism, high degree of basal layer expansion, large cells with increase of nuclear to cytoplasm ratios near the surface, and/or loss of cells polarity large.
Figure 3
Figure 3. In vivo GDFs-induced NF-κB activation in murine hypopharyngeal mucosa (HM)
A. Immunohistochemical analysis (IHC) for p-NF-κB (p65 S536) (from left to right): control (normal) untreated-HM, cytoplasmic staining; acid alone treated-HM, nuclear or cytoplasmic staining mainly of cells of basal layer and weak cytoplasmic staining of suprabasal layers; hyperplastic/dysplastic neutral-bile, acidic-bile, DCA and CDCA treated-HM, intense nuclear and cytoplasmic staining of cells of basal and suprabasal layers; glucose and saline treated-HM, cytoplasmic staining sporadically of a few basal/parabasal cells. B. Image analysis algorithm(s) (red, nuclear positive staining of p-NF-κB; orange, intense positive cytoplasmic staining of p-NF-κB; yellow, weak cytoplasmic staining of p-NF-κB; blue, negative p-NF-κB staining).
Figure 4
Figure 4. Molecular alterations underlying GDFs induced histopathological alterations of murine hypopharyngeal mucosa (HM), in vivo, linked to p-NF-κB activation, increased cell proliferation, cell-cell adhesion changes, and STAT3 activation
Immunofluorescence (IF) staining and automated quantitative analysis (AQUA) for (a) p-NF-κB (p65 S536) (green) and ΔNp63 (red); (b) Ki67 (green) and E-cadherin (red); (c) CK14 (green) and ϐ-catenin (red); and (d) p-STAT3 (Tyr705) (green) (from left to right): Normal untreated-HM, acid alone treated-HM, and hyperplastic/dysplastic neutral-bile, acidic-bile, DCA, and CDCA treated-HM derived from C57Bl6J mice. DAPI (blue) was used for nuclei staining. (DyLight®488 for green and DyLight®549 for red). The boxplots, represent the means ranks. The upper line indicates the highest value, the lower line the lowest value and the middle line the mean of AQUA normalized quantities of each variable. Statistically significant difference between AQUA-score means is indicated for GDFs vs. acid (left) and GDFs or acid treated vs. normal-untreated (right) (*p < 0.01; **p < 0.001;***p < 0.0001; ONE-WAY ANOVA, Kruskal-Wallis and Dunn's multiple comparison tests; Graph Pad Prism 6.0).
Figure 5
Figure 5. Murine hypopharyngeal mucosa (HM) exposed to glucose or saline present normal histological features and immunofluorescence (IF) staining patterns similar to normal-untreated HM
A. IF staining for (a) p-NF-κB (p65 S536) (green) and ΔNp63 (red); (b) Ki67 (green) and E-Cadherin (red); (c) CK14 (green) and ϐ-catenin (red); and (d) p-STAT3 (Tyr705) (green). DAPI (blue) was used for nuclei staining. (DyLight®488 for green and DyLight®549 for red). B. Graph presents linear correlation between AQUA means of glucose or saline-treated HM and normal untreated-HM (Paired-t test, GraphPad Prism 6.0).
Figure 6
Figure 6. Diagrams show significant linear correlations by Pearson
A., among altered protein expression levels upon GDFs treatment in murine HM; (a1) between p-NF-κB and Ki67, CK14 or β-catenin; (a2) between p-NF-κB and p-STAT3; (a3) between Ki67 and CK14 or β-catenin; and (a4) between CK14 and β-catenin. B. Diagram depicting an inverse correlation between E-cadherin and β-catenin levels.
Figure 7
Figure 7. GDFs-induced transcriptional activation of NF-κB related oncogenic pathways in murine hypopharyngeal mucosa (HM), in vivo
A. Graph presents the increased differential mRNA expression of NF-κB related oncogenic pathways between GDFs treated and untreated-control murine HM (p values by z-test). (GAPDH was used as housekeeping gene to normalize mRNA expression values of each target gene). B. Diagrams depicting strong linear correlation between RELA(p65) and bcl-2, TNF-α (b1) or WNT5A (b2), mRNA relative expression ratios (GDFs treated/untreated control) in murine HM (by Pearson).

Similar articles

Cited by

References

    1. Galli J, Cammarota G, De Corso E, Agostino S, Cianci R, Almadori G, Paludetti G. Biliary laryngopharyngeal reflux: a new pathological entity. Curr Opin Otolaryngol Head Neck Surg. 2006;14:128–132. - PubMed
    1. Sasaki CT, Marotta J, Hundal J, Chow J, Eisen RN. Bile-induced laryngitis: is there a basis in evidence? Ann Otol Rhinol Laryngol. 2005;114:192–197. - PubMed
    1. Tutar H, Erdamar H, Köybaşioğlu A, Dinç AE, Ceylan A, Uslu S. ORL J Can bile acids be an etiological factor for laryngeal carcinoma? Otorhinolaryngol Relat Spec. 2011;73:156–161. - PubMed
    1. McQuaid KR, Laine L, Fennerty MB, Souza R, Spechler SJ. Systematic review: the role of bile acids in the pathogenesis of gastro-oesophageal reflux disease and related neoplasia. Aliment Pharmacol Ther. 2011;34:146–165. - PubMed
    1. Kauer WK, Peters JH, DeMeester TR, Ireland AP, Bremner CG, Hagen JA. Mixed reflux of gastric and duodenal juices is more harmful to the esophagus than gastric juice alone. The need for surgical therapy re-emphasized. Ann Surg. 1995;222:525–531. discussion 531-533. - PMC - PubMed

Publication types

MeSH terms