. 2016 Jan 8:6:18979.
doi: 10.1038/srep18979.

PKN3 is the major regulator of angiogenesis and tumor metastasis in mice

Affiliations

PKN3 is the major regulator of angiogenesis and tumor metastasis in mice

Hideyuki Mukai et al. Sci Rep. .

Abstract

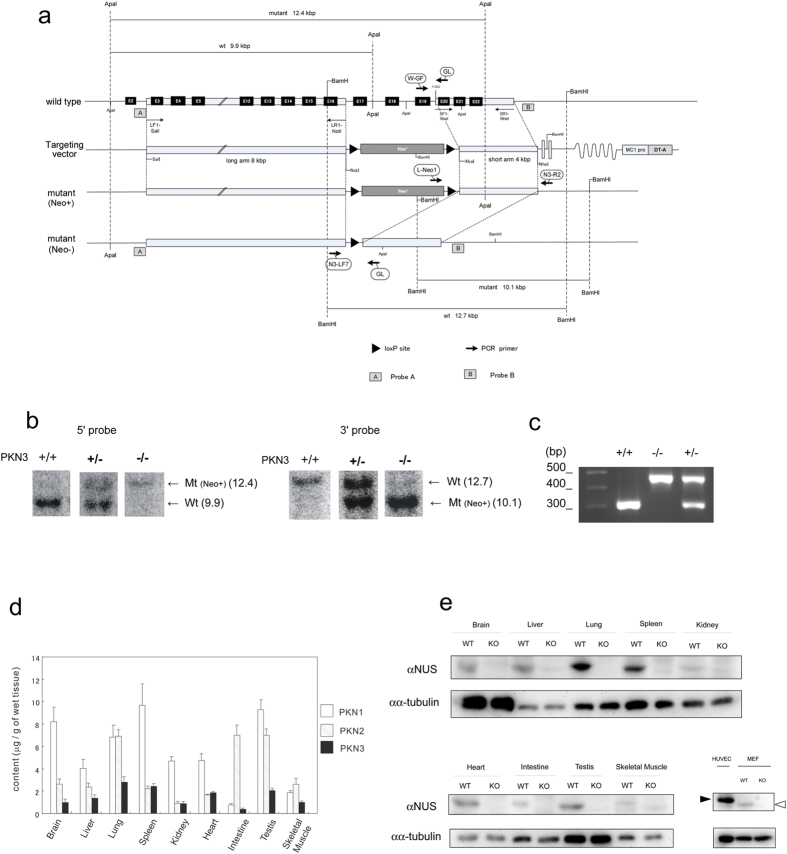
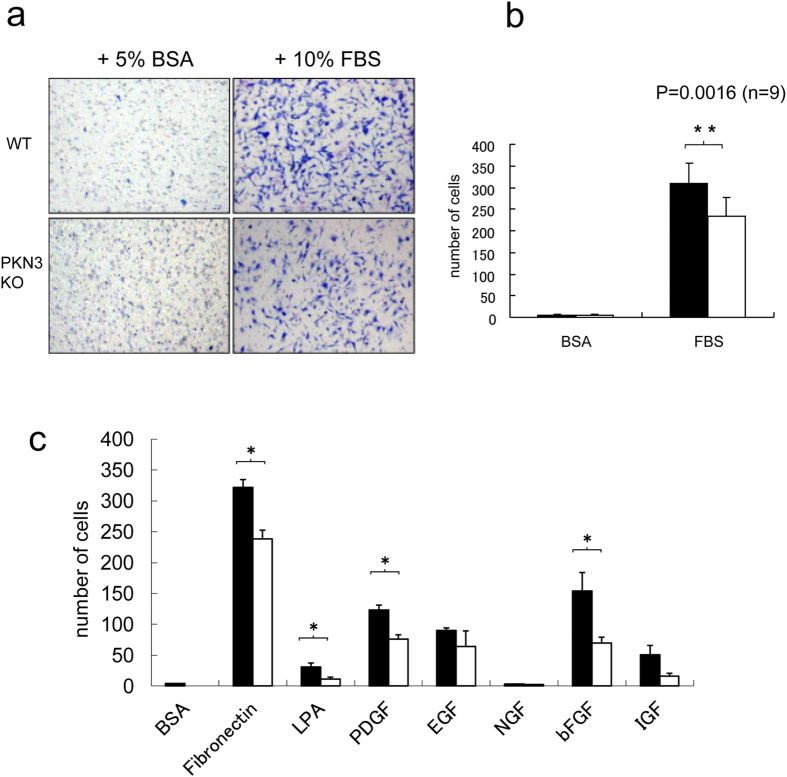
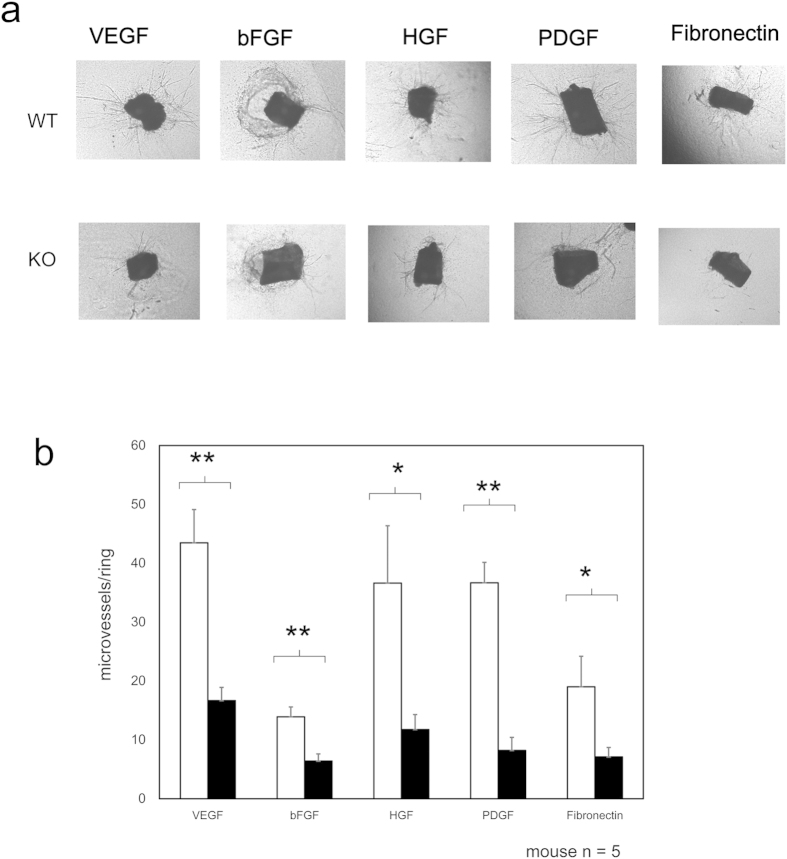
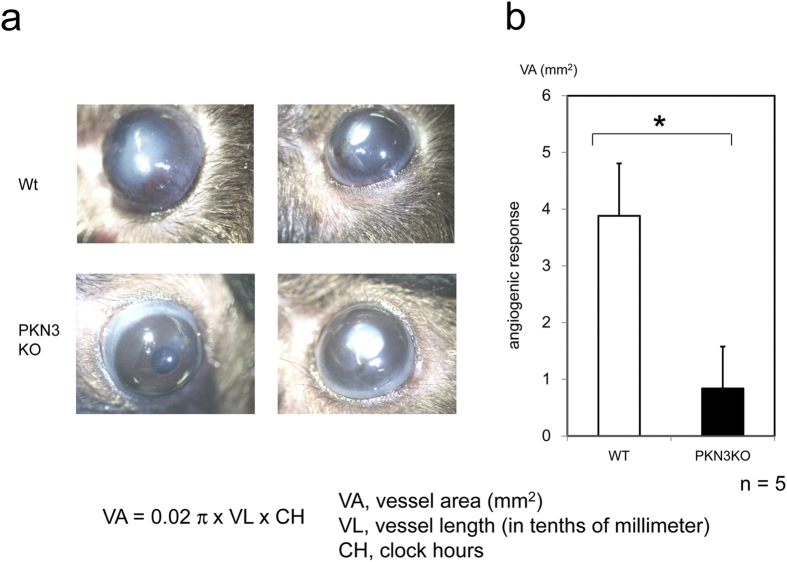
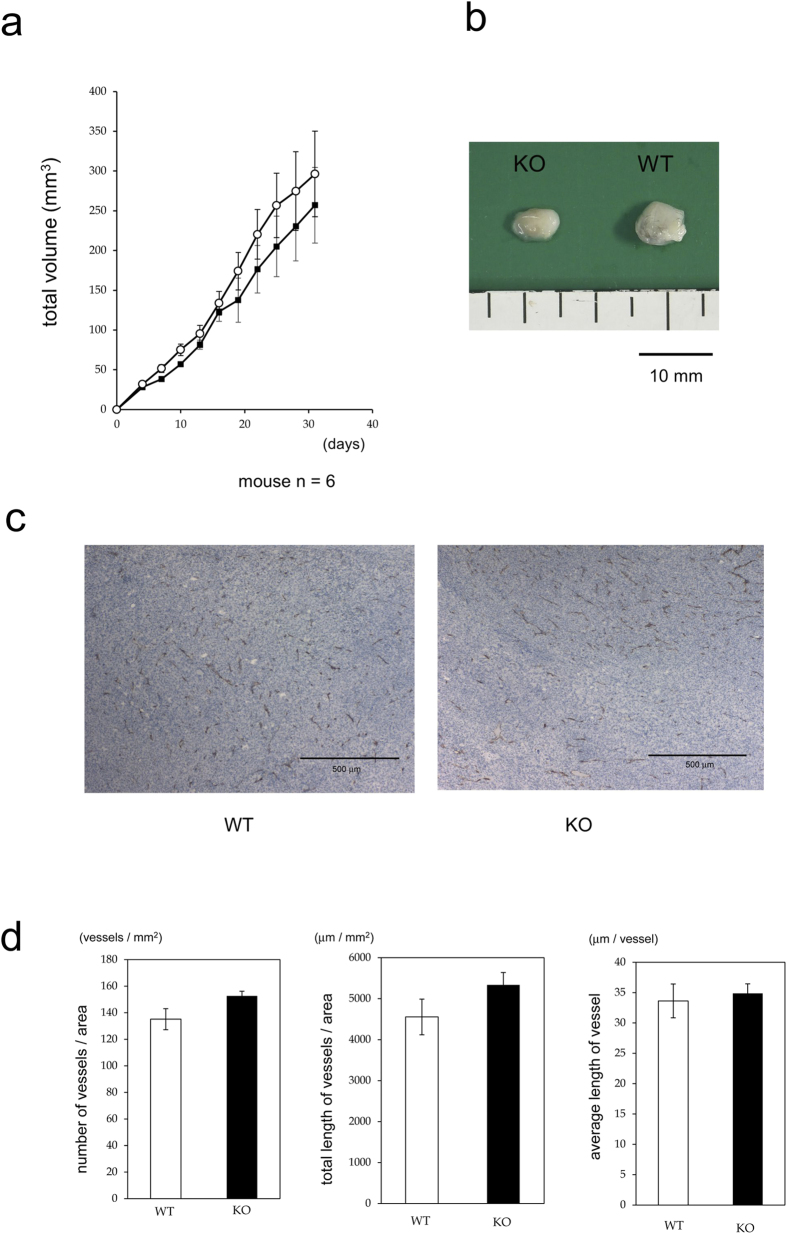
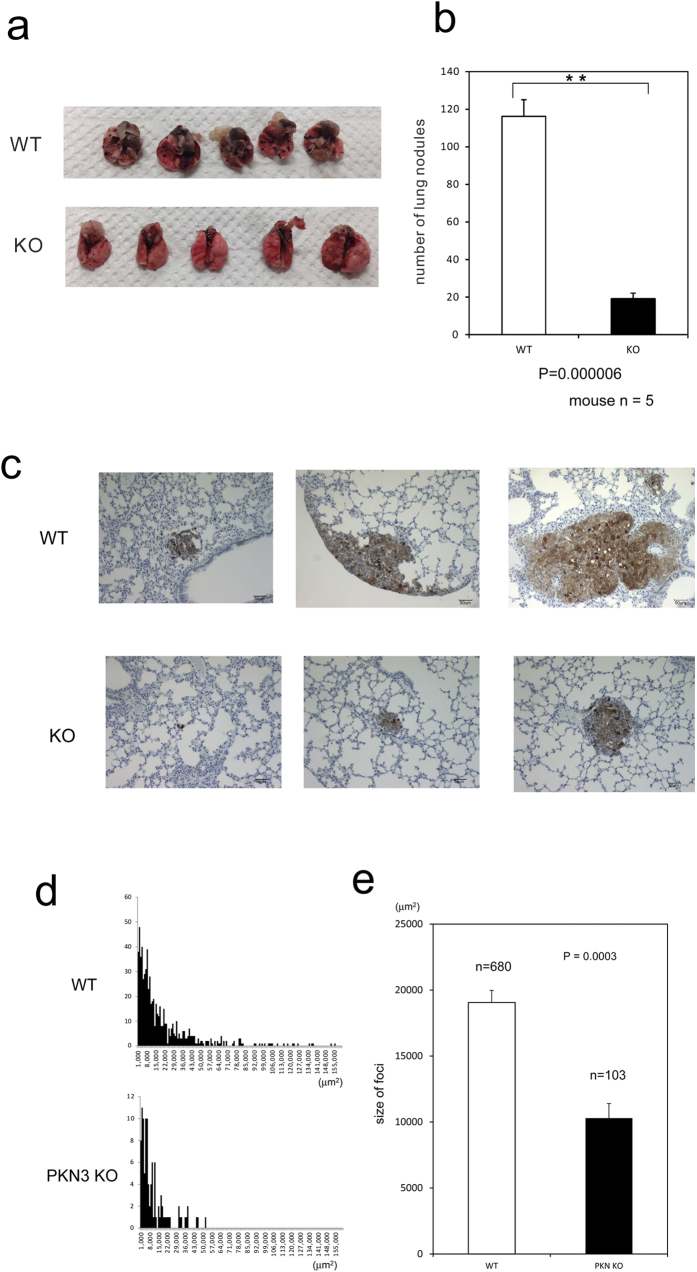
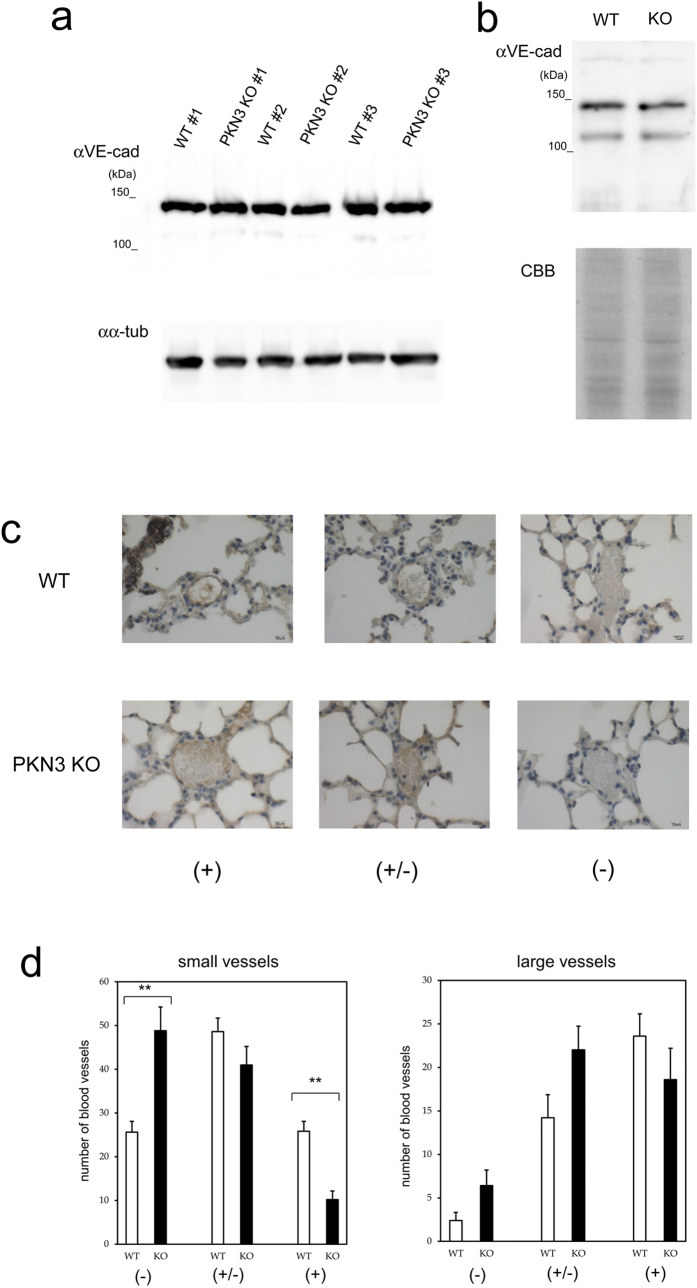
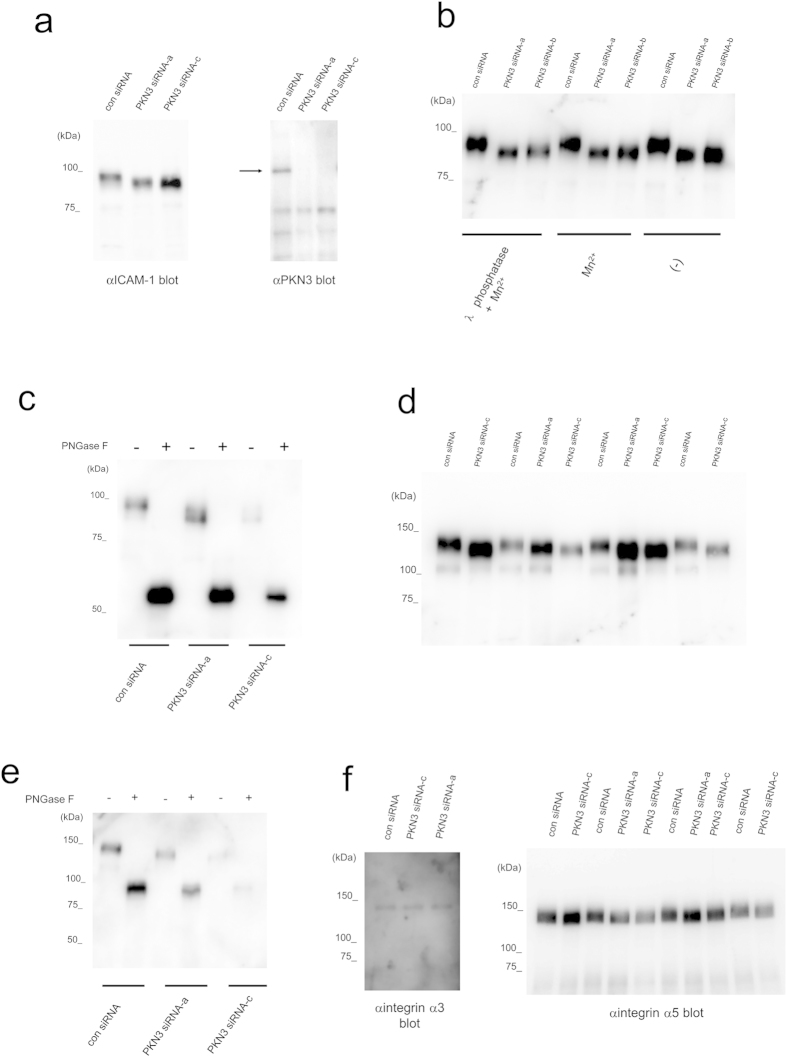
PKN, a conserved family member related to PKC, was the first protein kinase identified as a target of the small GTPase Rho. PKN is involved in various functions including cytoskeletal arrangement and cell adhesion. Furthermore, the enrichment of PKN3 mRNA in some cancer cell lines as well as its requirement in malignant prostate cell growth suggested its involvement in oncogenesis. Despite intensive research efforts, physiological as well as pathological roles of PKN3 in vivo remain elusive. Here, we generated mice with a targeted deletion of PKN3. The PKN3 knockout (KO) mice are viable and develop normally. However, the absence of PKN3 had an impact on angiogenesis as evidenced by marked suppressions of micro-vessel sprouting in ex vivo aortic ring assay and in vivo corneal pocket assay. Furthermore, the PKN3 KO mice exhibited an impaired lung metastasis of melanoma cells when administered from the tail vein. Importantly, PKN3 knock-down by small interfering RNA (siRNA) induced a glycosylation defect of cell-surface glycoproteins, including ICAM-1, integrin β1 and integrin α5 in HUVECs. Our data provide the first in vivo genetic demonstration that PKN3 plays critical roles in angiogenesis and tumor metastasis, and that defective maturation of cell surface glycoproteins might underlie these phenotypes.


Figures

Figure 1
Figure 1. Generation of PKN3 KO mice.
(a) Scheme of PKN3 genomic DNA, targeting vector, and disrupted gene. The targeting vector and a partial map of the PKN3 locus before and after homologous recombination in ES cells, and after further deletion of neomycin resistance cassette by Cre mediated recombination. Positions of the loxP sites are designated by black triangles. Subsequent breeding of heterozygous mice indicated by PKN3 +/− generates PKN3 knockout (KO) mice (PKN3 −/−). The exons, deduced by comparison with the cDNA sequence, are denoted by black boxes. The positions of the genomic DNA probes (a,b) used in Southern blotting are indicated, as well as the positions of the primers used for screening of homologous recombination (L-Neo1 and N3-R2), and subsequent PCR genotyping (W-GF, GL, N3-LF7). (b) Southern blot analysis. Shown is the result of a representative litter of F2 mice obtained by crossing a pair of PKN3 +/− (containing Neo cassette) F1 mice. Genomic DNA was digested with ApaI and probed with probe A on the left, and digested with BamHI and probed with probe B on the right. (c) PCR genotyping for discrimination between WT and mutant allele lacking Neo cassette. (d) Quantification of PKN3 in various tissues of WT mice. Each tissue was homogenized and subjected to SDS-PAGE. The amount of PKN3 was measured by immunoblot analysis using the αNUS antibody and indicated as “μg/g of wet tissue”. The data are expressed as the means ± S.E.M from n = 3 mice. (e) Expression of PKN3. Whole-cell lysates of 500 μg wet weight of each tissue from WT and PKN3 KO mice was resolved by SDS-PAGE, and subjected to immunoblot analysis using the αNUS antibody and anti α-tubulin antibody. Fifty μg protein of whole cell lysate of each HUVECs and mouse embryonic fibroblasts was subjected to SDS-PAGE followed by immunoblot analysis using the αNUS antibody and anti α-tubulin antibody. White arrowhead indicates mouse PKN3. Black arrowhead indicates human PKN3. WT, WT mice; KO, PKN3 −/− mice.
Figure 2
Figure 2. Migration of embryonic fibroblasts from WT and PKN3 KO mice.
(a) Cell migration was determined using the Transwell membrane. After 5 h of incubation at 37 °C, the cells that had migrated to the lower surface of the membrane were fixed and stained. Shown are the representative photos of lower surface of the Transwell membrane. (b) Diagrams of migrating cells in the presence of 10% FBS or 5% BSA as a control. n = 9. ** indicates P < 0.01. (c) Diagrams of migrating cells in the presence of various migration factors. The concentration of migration factors are as follows. Fibronectin, 10 μg/ml; lysophosphatidic acid (LPA), 10 μM; PDGF, 25 ng/ml; Epidermal growth factor (EGF), 25 ng/ml; bFGF, 20 ng/ml; Nerve growth factor (NGF), 50 ng/ml; Insulin-like growth factor-1 (IGF-1), 100 ng/ml. P values are as follows. Fibronectin, p = 0.044/n = 9; LPA, p = 0.029/n = 4; PDGF, p = 0.035/n = 9; bFGF, p = 0.036/n = 4; IGF-1, p = 0.069/n = 4. * indicates P < 0.05.
Figure 3
Figure 3. Influence of PKN3 KO in the regulation of ex vivo angiogenesis.
(a) Abdominal aortic ring segments from WT or PKN3 KO mice embedded in matrigel (for PDGF) or collagen (for VEGF, bFGF, HGF, and Fibronectin). Aortic ring segments were incubated with each growth factor indicated for 6 days. Panel shows representative photomicrographs of microvascular sprouting in each condition after 6 days in culture. (b) Effect on the sprouting vessels from ex vivo aortic rings. Bars represent mean of 15 independent experiments ± SEM. (mouse number of each genotype is 5). * and ** indicate P < 0.05 and P < 0.01, respectively.
Figure 4
Figure 4. Corneal angiogenesis assay of PKN3 KO mice.
(a) Corneas of mice 7 days after post implantation of growth factor pellets. A hydron pellet containing bFGF was implanted in a surgically created micropocket on the cornea of PKN3 KO mice and WT control mice. (b) Angiogenic response quantified by measuring the neovascular area in the corneas. Five pairs of animals were used in the study.
Figure 5
Figure 5. Growth of the primary tumor.
(a) Growth kinetics of implanted Lewis lung cancer in WT and PKN3 KO mice. The closed square indicates WT and the open circle indicates PKN3 KO mice. n = 6 mice per group. Error bar, SEM. (b) Representative photograph of tumors when resected. (c) Representative photographs of anti CD31 antibody staining of tumor sections. (d) The density and the length of blood vessels in tumors. The entire field of maximum tumor sections were digitalized by CCD camera and the CD31 staining were traced and quantified by using WinROOF (Ver7.2, Mitani corporation, Fukui, Japan) software. Each data point represents the mean ± SE. n = 6 mice per group.
Figure 6
Figure 6. Reduced metastasis formation in PKN3 KO mice.
(a) Macroscopic appearance of lungs obtained from WT and PKN3 KO mice at 14 days after an i.v. injection of B16BL6 cells. (b) The number of metastatic foci on the lung surface. ** indicates P < 0.01. (c) Microscopic appearance of lungs after B16BL6 cell injection. Lungs were removed at 14 days after injection of melanoma cells, and processed to anti S100 antibody staining to visualize melanoma cells and H&E staining. Representative results from independent mice are shown here. (d) The tumor size histogram of metastatic foci. The horizontal axis indicates the size of tumor (μm2) observed in the slice section of mouse lungs. The vertical axis indicate the number of foci. (e) The average size of foci of mouse lungs.
Figure 7
Figure 7. Expression of VE-cadherin in WT and PKN3 KO mouse lungs.
(a) Immunoblotting of the crude extract of mouse lungs with anti VE-cadherin antibody. Each crude extract of lung from individual WT mouse (#1 – #3) and PKN3 KO mouse (#1 – #3) was prepared by homogenizing lung directly with sample buffer for SDS-PAGE. “αVE-cad” and “αα-tub” indicate immunoblotting with anti VE-cadherin and anti α-tubulin antibodies, respectively. (b) Immunoblotting of the plasma membrane fraction of mouse lungs with anti VE-cadherin antibody. The plasma membrane fractions of mouse lungs were prepared using Minute Plasma Membrane Protein Isolation Kit (Invent Biotechnologies, Inc.). “αVE-cad” indicates immunoblotting with anti VE-cadherin antibody. “CBB” indicates Coomassie staining of the gel after SDS-PAGE. (c) Immunohistochemical staining of mouse lungs with anti VE-cadherin. Blood vessels were classified into dense (indicated by + ), moderate (indicated by +/−), and weak (indicated by −) immunoreactive staining groups. (−) indicates no immunoreactivity or indistinguishable from red blood cells. (+/−) indicates mild immunoreactivity detectable only at x 400 magnification. (+) indicates obvious immunoreactivity detectable even at x 100 magnification. (d) The number of blood vessels classified by the VE-cadherin immunoreactivity. Blood vessels were first classified into two groups by size (“small vessels” and “large vessels”), and further classified by VE-cadherin immunoreactivity as described in (C). “small vessels” indicate thin vessels in the peripheral in the intra or inter alveolar area. “large vessels” indicate thick vessels rich in tunica media along bronchus or vessels radiating from that thick vessel to periphery. “small vessels” were counted up to 100/each slice of lung, and all of the “large vessels” were counted in each slice. ** indicates P < 0.01.
Figure 8
Figure 8. Immunoblotting of HUVECs with antibody against surface glycoproteins.
“con siRNA” indicates validated universal negative control SIC-001 (Sigma-Aldrich Japan K.K.). “PKN3 siRNA-a” indicates Hs_PKN3_8290 (Sigma Aldrich Japan K.K.) derived from the coding sequence for ACC3 domain of human PKN3, “PKN3 siRNA-b” indicates Hs_PKN3_8291 (Sigma-Aldrich Japan K.K.) derived from the coding sequence for the catalytic domain of human PKN3, and PKN3 siRNA-c indicates M-004647-01 (Dharmacon Research) derived from the coding sequence for the catalytic domain of human PKN3. (a) Immunoblotting of HUVECs transfected with siRNA for PKN3 and control with antibody against ICAM-1 and PKN3. αNUS antibody was used for αPKN3 blotting. The arrow indicates the position of PKN3. (b) The effect of treatment of HUVEC extract with λ phosphatase on ICAM-1 immunoreactivity. (c) The effect of treatment of HUVEC extract with PNGase F on ICAM-1 immunoreactivity. (d) Immunoblotting of HUVECs transfected with siRNA for PKN3 and control with antibody against integrin β1. (e) The effect of treatment of HUVEC extract with PNGase F on integrin β1 immunoreactivity. (f) Immunoblotting of HUVECs transfected with siRNA for PKN3 and control with antibody against integrin α3 and α5.

Similar articles

Cited by

References

    1. Mukai H. The structure and function of PKN, a protein kinase having a catalytic domain homologous to that of PKC. J Biochem. 133, 17–27 (2003). - PubMed
    1. Maesaki R. et al. The structural basis of Rho effector recognition revealed by the crystal structure of human RhoA complexed with the effector domain of PKN/PRK1. Mol Cell. 4, 793–803 (1999). - PubMed
    1. Oishi K., Mukai H., Shibata H., Takahashi M. & Ona Y. Identification and characterization of PKNbeta, a novel isoform of protein kinase PKN: expression and arachidonic acid dependency are different from those of PKNalpha. Biochem Biophys Res Commun. 261, 808–814 (1999). - PubMed
    1. Morrice N. A., Gabrielli B., Kemp B. E. & Wettenhall R. E. A cardiolipin-activated protein kinase from rat liver structurally distinct from the protein kinases C. J Biol Chem. 269, 20040–20046 (1994). - PubMed
    1. Mukai H. et al. Activation of PKN, a novel 120-kDa protein kinase with leucine zipper-like sequences, by unsaturated fatty acids and by limited proteolysis. Biochem Biophys Res Commun. 204, 348–356 (1994). - PubMed

Publication types

MeSH terms