Review
. 2016 Jun 8;116(11):6323-69.
doi: 10.1021/acs.chemrev.5b00541. Epub 2016 Jan 6.

Solution NMR Spectroscopy for the Study of Enzyme Allostery

Affiliations
Review

Solution NMR Spectroscopy for the Study of Enzyme Allostery

George P Lisi et al. Chem Rev. .

Abstract

Allostery is a ubiquitous biological regulatory process in which distant binding sites within a protein or enzyme are functionally and thermodynamically coupled. Allosteric interactions play essential roles in many enzymological mechanisms, often facilitating formation of enzyme-substrate complexes and/or product release. Thus, elucidating the forces that drive allostery is critical to understanding the complex transformations of biomolecules. Currently, a number of models exist to describe allosteric behavior, taking into account energetics as well as conformational rearrangements and fluctuations. In the following Review, we discuss the use of solution NMR techniques designed to probe allosteric mechanisms in enzymes. NMR spectroscopy is unequaled in its ability to detect structural and dynamical changes in biomolecules, and the case studies presented herein demonstrate the range of insights to be gained from this valuable method. We also provide a detailed technical discussion of several specialized NMR experiments that are ideally suited for the study of enzymatic allostery.


Figures

Figure 1
Figure 1
Structural comparison of deoxy- and O2-bound Hb. Subunits of deoxy-Hb are shown in darker shades and their corresponding heme moieties are colored yellow. Subunits of O2-bound Hb are shown in lighter shades with red heme groups. A change in the position of the subunits and heme groups is observed as the dimers rotate in the O2-bound structure.
Figure 2
Figure 2
Comparison of MWC (formula image) and KNF (—) models in describing O2 binding to Hb. The data points are taken from Monod, Wyman, Changeaux. The curves are non-linear least squares fits with Equations (1) and (2).
Figure 3
Figure 3
Schematic depiction (upper) of the timescale for various protein motions and the corresponding NMR experiments (lower) that are valuable for their characterization.
Figure 4
Figure 4
General depiction of chemical shift perturbation by ligand saturation for a two state equilibrium. The resonance shifts as the apo protein (red) is fully saturated (purple). Figure adapted from Ref. with permission from Elsevier.
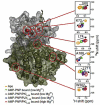
Figure 5
Figure 5
The reaction catalyzed by ATCase where carbamoyl phosphate and L-Asp are converted to N-carbamoyl-L-Asp via a proposed tetrahedral intermediate. The bisubstrate effector PALA is believed to mimic the tetrahedral intermediate and, depending on conditions, activate or inhibit ATCase. At low [Asp] and high [CP], PALA activates ATCase. However, as [PALA] increases, it occupies most of the sites where the catalytic intermediate is hydrolyzed, inhibiting activity. Figure taken from Ref. with permission from Elsevier.
Figure 6
Figure 6
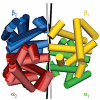
Comparison of quaternary structures of ATCase in T- and R-state viewed above (upper) and along (lower) the 3-fold symmetry axis. Catalytic chains are shown in blue and regulatory chains are shown in yellow. Figure taken from Ref. with permission from Elsevier.
Figure 7
Figure 7
Structural changes in the apo ATCase backbone (Cα) associated with PALA binding. The structure depicts two adjacent catalytic domains, highlighting the 50’s, 80’s, and 240’s loops of one domain, and the adjacent 80’s (c2) loop. Loop positions in the apo enzyme are shown by the blue highlight and loop positions in the ATCase-PALA complex are shown by the red highlight. The color gradient was generated by linear calculations of 40 structures between two known X-ray structures 1ZA1 and 1D09. Spheres show the bound PALA molecule. Figure taken from Ref. with permission from Elsevier.
Figure 8
Figure 8
Schematic of the interactions identified to be important in stabilizing each allosteric state of ATCase, or the transition between the two states, by site-directed mutagenesis. (A) T-state ATCase and (B) R-state ATCase. Figure taken from Ref. with permission from Elsevier.
Figure 9
Figure 9
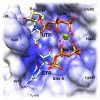
X-ray crystal structure of ATCase in complex with Mg2+ and inhibitors CTP and UTP solved by Kantrowitz and coworkers. Positive electrostatic potential (shown in blue) is mapped onto the solvent accessible surface of a single regulatory chain. Residues involved in inhibitor binding in the regulatory site are labeled, and two exogenous water molecules are shown in the Mg2+ coordination sphere. Reprinted with permission from Reference . Copyright 2012 American Chemical Society
Figure 10
Figure 10
1H-13C methyl-TROSY correlation spectrum of 2H, δ113CH3-Ile ATCase. Peaks from the regulatory (R) chain are colored red, and those from the catalytic (C) chain are colored black. Spectrum was collected at 800 MHz on 0.6 mM ATCase with a 40-minute acquisition time. Figure reprinted from Ref. with permission. Copyright (2007) National Academy of Sciences, USA.
Figure 11
Figure 11
Effects of substrate and substrate analogue binding on the NMR spectrum of apo ATCase. Each panel displays portions of the δ113CH3-Ile spectrum showing an Ile resonance from the regulatory chain (upper row) and catalytic chain (lower row). Column 1, apo ATCase; column 2, ATCase with 15 equivalents per monomer of CP; column 3, ATCase with 58 equivalents of PAM; column 4, ATCase with 1.5 equivalents of PALA; column 5, ATCase with 30 equivalents of CP and 75 equivalents of succinate; column 6, apo cK164E/cE239K ATCase, a mutant favoring the R conformation. Figure reprinted from Ref. with permission. Copyright (2007) National Academy of Sciences, USA.
Figure 12
Figure 12
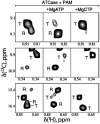
Effects of allosteric effector nucleotides on the [T]/[R] equilibrium of PAM-bound ATCase. Panels display three different regions of the 2H, δ113CH3-Ile spectrum of ATCase saturated with 58 equivalents of PAM. Saturating concentrations of MgATP (46 equivalents) or MgCTP (32 equivalents) were added in columns 2 and 3, respectively. Figure adapted from Ref. with permission. Copyright (2007) National Academy of Sciences, USA.
Figure 13
Figure 13
Nucleotide effects on the Ile, Leu, and Val methyl chemical shifts of catalytic chains of R-state ATCase. (A) Cartoon structure of ATCase in the R-state (PDB 8AT1) showing the bound CTP nucleotide in blue spheres and bound substrates PAM and malonate in black and green spheres, respectively. Positions of Ile, Leu, and Val methyl groups within the catalytic chain are shown as yellow spheres. (B) Overlay of HMQC NMR spectra of PAM-saturated cK164E/cE239K ATCase before (black) and after (red) addition of 20 mM Na2ATP. (C) Before (black) and after (blue) addition of 20 mM Na2CTP. (D) Before (black) and after (green) addition of 252 mM sodium malonate. (E) Before (black) and after (red) addition of 20 mM MgATP. Subunit labeling for panels b-d shows unlabeled regulatory chain, Ileδ1-[13CH3], Leu, Val-[13CH3, 12CD3]-labeled catalytic chain and for panel e Ileδ1-[13CH3], Leu, Val-[13CH3, 12CD3]-labeled regulatory chain and unlabeled catalytic chain. Figure reprinted from Reference with permission from Elsevier.
Figure 14
Figure 14
Reactions catalyzed by the IGPS heterodimer. Ammonia generated from glutamine hydrolysis in HisH travels to the HisF subunit where it is incorporated into IGP, a breakdown product of PRFAR.
Figure 15
Figure 15
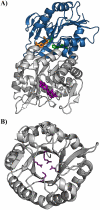
(A) X-ray crystal structure of the IGPS heterodimer (PDB 1GPW) with the HisH subunit shown in blue and the HisF subunit shown in grey. The catalytic Cys, His, and Glu triad residues of HisH are shown as green sticks, the Gln substrate analogue acivicin is shown in orange, and the allosteric effector PRFAR is shown in purple. (B) Bottom view of the HisF subunit showing the ammonia tunnel through the center of the protein. Passage of NH3 is believed to be gated at the HisH/HisF interface by conserved charged residues fArg5, fGlu46, fLys99, and fGlu167, shown as purple sticks.
Figure 16
Figure 16
Structure of the IGPS enzyme complex showing (βα)8 barrel of HisF in the open (A) and closed (B) conformations with one and two phosphate ions bound, respectively. The effector binding site was inferred from positions of bound phosphate ions in these structures, which mark the locations of the phosphate end groups of PRFAR. HisF is shown in yellow ribbons, and HisH in blue ribbons. Figure reprinted from Ref. with permission from Elsevier.
Figure 17
Figure 17
Interaction of IGP with HisF-IGPS shown by (A) 1H/15N combination chemical shift changes in HisF upon saturation with IGP determined by Δδ=(Δδ2NH+Δδ2NH25)2,, (B) chemical shift changes with standard deviations of 1-4 from the average are mapped onto the HisF structure in a gradient of light to dark red spheres. Black spheres represent exchange-broadened residues. In (C) selected examples of IGP binding-induced exchange broadening is shown for residues 12, 20, 178, and 204. Resonances from the apo enzyme are shown in red (positive peaks) and green (negative peaks). Resonances from the IGP form are shown in blue (lower). Figure reprinted from Reference with kind permission of Springer Science and Business Media.
Figure 18
Figure 18
Residue specific R2¯ values. Data are shown for (A) HisF, (B) HisF + IGP, (C) HisF-IGPS, and (D) HisF-IGPS + IGP. IGP was saturating (10 × Kd) in panels B and D. The horizontal red line indicates the 10% trimmed mean of the data points. Amino acid residues with significantly elevated values are indicated. Figure reprinted from Reference with kind permission of Springer Science and Business Media
Figure 19
Figure 19
CPMG dispersion curves for IGP-bound HisF. TROSY-based CPMG dispersion curves were determined for 18 residues in apo HisF. Equation (21) was fit to each relaxation series to determine Rex = (pA pB Δω2 / kex), for each residue. The residue specific value of Rex is shown above each graph. Figure reprinted from Reference with kind permission of Springer Science and Business Media.
Figure 20
Figure 20
(A) Representative MQ dispersion curves for HisF residues showing positive dispersion. (B) All residues exhibiting dispersion are mapped onto the HisF structure in the IGPS complex, with HisH colored blue, HisF colored grey, and individual atoms with dispersion shown in bright orange. Figure reprinted from Reference with permission from Elsevier.
Figure 21
Figure 21
Chemical shift perturbations upon PRFAR binding to 15N-labeled HisF-IGPS. (A) Overlay of 1H-15N TROSY spectrum of apo (orange) and PRFAR-bound (blue) IGPS. (B) 1H/15N composite chemical shift changes in HisF upon saturation with PRFAR determined by Δδ=(Δδ2NH+Δδ2NH25)2,. Resonances broadened beyond detection are indicate intermediate exchange and are denoted with negative chemical shift values. (C) Chemical shift changes from 0.1 – 0.35 ppm are mapped onto the HisF structure as a gradient from pink to red spheres. Exchange broadened residues are shown as black spheres, and PRFAR is shown in blue sticks. Figure partially adapted from Reference with permission from Elsevier.
Figure 22
Figure 22
Comparison of dispersion profiles for apo (squares), binary-acivicin (triangles), binary-PRFAR (circles), and ternary HisF-IGPS (diamonds). Figure reproduced from Reference with permission from Elsevier.
Figure 23
Figure 23
(A) Venn diagram summarizing relationships between dynamic residues determined from 13C-ILV relaxation dispersion experiments and the enzyme complex in which they occur for apo (black), binary acivicin (green), binary PRFAR (blue), and ternary PRFAR (red). Residues common to all four complexes are shown in the center with larger font. (B) Ile, Leu, and Val methyl groups exhibiting dispersion in the binary and ternary PRFAR complexes mapped onto the structure of IGPS. Residues with dispersion in only the PRFAR binary complex are shown as blue spheres, only in the PRFAR ternary complex are shown as red spheres, and those common to both are shown as magenta spheres. Figure reproduced from Reference with permission from Elsevier.
Figure 24
Figure 24
(A) Synergistic chemical shift changes due to ligand binding plotted as 13C ΔΔδ between the two binary forms of HisF-IGPS and the ternary complex. (B) Residues with a nonadditive value of ΔΔδ ≥ 1.5 σ from the mean are mapped onto the HisF structure in IGPS and shown as magenta spheres. Figure reproduced from Reference with permission from Elsevier.
Figure 25
Figure 25
Schematic representation of conformational changes required for stabilization of the oxyanion hole formed during hydrolysis of glutamine. Adapted from Reference . Copyright (2012) National Academy of Sciences.
Figure 26
Figure 26
(A) Cartoon representation of the oxyanion hole formed by the PGVG loop (cyan) with the catalytic Cys84 residue. Activation of HisH is predicted to require flipping of the amide bond, presenting the amide proton of Val51 to stabilize the oxyanion reaction intermediate. (B) Resonance broadening of Gly50 in 1H-15N HSQC spectrum of HisH-IGPS upon titration with PRFAR. The Gly50 resonance is broadened beyond detection when saturated with PRFAR; apo (red) 0.038 mM PRFAR (orange), 0.150 mM (yellow), 0.220 mM (green), 0.290 mM (blue), 0.87 mM (purple, 99.8 % saturated). Figure reproduced from Reference with permission from Elsevier.
Figure 27
Figure 27
X-ray crystal structure of A) dimeric and B) monomeric (after 90° rotation from A) AAC(6’)-Ii (PDB 1N71) bound to AcCoA. The N-terminal arm of monomer 1, composed of residues 1-103, is shown in grey, and the C-terminal arm containing residues 104-182 is shown in blue. The N-terminal and C-terminal arms of monomer 2 are colored green and red, respectively. AcCoA is shown in pink sticks in both structures and the flexible hinge connecting the two domains of the monomer (B) is shown in red.
Figure 28
Figure 28
Summary of interactions between AcCoA and the AAC(6’)-Ii enzyme. Residues from the N-terminal arm (1-103, clustered at the bottom of the figure) and C-terminal arm (104-182, upper four labeled residues) interact with AcCoA (dark lines), with dashed lines indicating hydrogen bonds and semicircles indicating hydrophobic contacts. Hydrogen bond distances are given in Angstroms, as determined in Ref. . Figure reprinted from Reference with permission Elsevier.
Figure 29
Figure 29
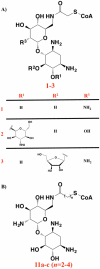
Representative aminoglycoside-CoA bisubstrate inhibitors of AAC(6’)-Ii synthesized as described in Ref. with (A) varying substituent groups appended to the ring system and (B) varying linker length between the amide-CoA thioester bond. Nanomolar (nM) inhibition constants (Ki) for the compounds 1-3 in (A) are (1) 76 ± 25; (2) 111 ± 28; (3) 119 ± 14. Ki values for compounds 11a-c in (B) are (11a) 43 ± 23; (11b) 161 ± 98; (11c) 7990 ± 2663.
Figure 30
Figure 30
1H-15N HSQC NMR spectra of (A) apo-AAC(6’)-Ii and (B) paromomycin-bound AAC(6’)-Ii. (C) X-ray crystal structure of AAC(6’)-Ii bound to a bisubstrate inhibitor where backbone chains of the two subunits are colored grey and yellow, and the aminoglycoside and CoA portions of the ribostamycin-based inhibitor are colored red and blue, respectively. Figure reprinted by permission from Macmillan Publishers Ltd.
Figure 31
Figure 31
1H-15N HSQC spectra at 800 MHz of (A) apo AAC(6’)-Ii and (B) AAC(6’)-Ii saturated with AcCoA. X-ray crystal structures below display (C) AcCoA-bound AAC(6’)-Ii (PDB 2A4N) with AcCoA shown in green sticks and residues with assigned cross peaks in the HSQC spectrum shown as blue spheres. (D) Apparent chemical shift differences between the apo- and holo-enzyme mapped onto the structure of AAC(6’)-Ii. Amide nitrogen atoms of one subunit are shown as spheres indicating Δδapp < 0.5 ppm (white), 0.5 ≤ Δδapp < 1 (light yellow), 1 ≤ Δδapp < 2 (dark yellow), 2 ≤ Δδapp < 4 (orange), and 4 ≤ Δδapp (red). Spheres indicating unassigned residues are colored grey. Figure reprinted by permission from Macmillan Publishers Ltd.
Figure 32
Figure 32
Combined ITC-NMR analysis presented by Mittermaier and coworkers describing the allosteric behavior of AAC(6’)-Ii. (A) ITC-determined populations of apo- (red), singly bound- (blue), and doubly-bound (yellow) forms of the paromomycin-AAC(6’)-Ii complex. (B) Representative normalized intensities of the apo- (yellow points, dashed red line) and holo- AAC(6’)-Ii (green points, solid blue line) resonances for Gly136 as a function of ligand concentration. (C) Histogram depiction of relative contributions of the singly-bound enzyme to apo- (I1a) and holo-AAC(6’)-Ii (I1h). Intensities from 19 apo peaks and 37 holo peaks from the 1H-15N HSQC spectra were included, and peak intensities were recorded at 15 different concentrations of paromomycin. Figure reprinted by permission from Macmillan Publishers Ltd.
Figure 33
Figure 33
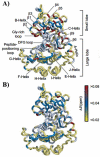
Structure of GCK (PDB 1V4S) displaying the distribution of representative GCK mutations in the small domain (cyan, blue circle) and large domain (red, red circle). The dynamic α13-helix is shown in orange, and mutation sites are shown as yellow spheres. Figure reprinted from Reference .
Figure 34
Figure 34
1H-15N HSQC NMR spectra of 15Nε tryptophan side chains in (A) apo GCK and (B) GCK in the presence of 50 mM glucose. Figure reprinted with permission from Reference . Copyright 2010 American Chemical Society.
Figure 35
Figure 35
Structural changes accompanying complex formation in (A) apo (PDB 1V4T), (B) glucose-bound binary (PDB 3IDH), and (C) glucose-AMP-PNP-bound ternary (PDB 3FGU) GCK. The large and small domains of GCK are colored grey and blue, respectively. Cα positions of Ile and Trp residues are shown as red and yellow spheres, respectively. The β-hairpin formed by residues 151-179 is shown as a magenta ribbon, glucose is depicted with green spheres, and AMP-PNP is depicted with orange spheres. Accompanying 1H-13C HMQC NMR spectra of 13Cδ1-labeled Ile residues for (D) apo, (E) glucose-bound binary, and (F) glucose-AMP-PNP-bound ternary GCK are below each structure. Labels for assigned Ile residues from the large domain are colored grey, Ile residues from the small domain are colored blue, and Ile residues from the 151-179 loop are colored magenta. Figure reprinted from Reference .
Figure 36
Figure 36
X-ray crystal structure of a GCK-glucose-activator ternary complex illustrating the allosteric communication relay in the enzyme. The 151-179 β-hairpin is shown in magenta, the α13-helix in blue, the allosteric activator molecule in cyan, and glucose in green. The Cα atoms of Ile159, Ile163 and Trp167 are shown as red (Ile) and yellow (Trp) spheres and V452 is shown as blue spheres. Magenta sticks show Lys169, which hydrogen bonds to the O6 atom of glucose. Figure reprinted from Reference .
Figure 37
Figure 37
Representative CPMG relaxation dispersion curves following changes in 13CHD2δ1-Ile methyl group dynamics in the absence (blue) and presence (green) of glucose. Panels A-C show dispersion profiles for residues located in the small domain. Panel D shows profiles for I159 of the disordered loop (circles), I348 of the large domain (squares), and I390 of the hinge region (triangles). Data analysis was carried out as described in Ref. . Figure was reproduced from Reference with permission from Wiley Publishing.
Figure 38
Figure 38
Conformational changes associated with ligand binding in PKA-C. Major conformational states defined by the angle between the large and small lobes of the catalytic subunit, and the reported angles were calculated as an average of those given by X-ray crystal structures of open (PDB 3O7L, 1CMK, 1CTP, 1J3H, 2QVS), intermediate (PDB 1BKX, 1BX6, 1STC, 1JLU, 1RE8, 1REK, 3DND, 3DNE, 3IDB, 3IDC), and closed (PDB 1JBP, 1ATP, 1APM, 1YDS, 1YDR, 1YDT) PKA-C. Figure reprinted from Reference with permission from Elsevier.
Figure 39
Figure 39
Chemical shift perturbations (Δδ) upon binding of (A) AMP-PNP and (B) Kemptide (Leu-Arg-Arg-Ala-Ser-Leu-Gly) to PKA-C. Figure reprinted from Reference with permission from Elsevier.
Figure 40
Figure 40
Summary of nucleotide-induced exchange broadening in apo PKA-C. Red dashed circles indicate the disappearance of assigned resonances. Figure reprinted from Reference with permission from Elsevier.
Figure 41
Figure 41
Linear changes in chemical shift among different forms of PKA-C. As described in Ref. , the extremes of shifts are apo (orange) and super-inhibited ternary complex (red), with changes in representative residues dispersed throughout the enzyme in regions near the active and allosteric sites. Figure reprinted from Reference with permission from Elsevier.
Figure 42
Figure 42
Amide backbone dynamics determined by CPMG relaxation dispersion for (A) apo (B) AMP-PNP binary and (C) AMP-PNP/PLN1-20 ternary PKA-C. Figure reprinted from Reference with permission from Macmillan Publishing.
Figure 43
Figure 43
Synchronous opening/closing of the enzyme active site cleft. Correlation plots of Rex with the chemical shift differences of the open and closed enzyme states for (A) AMP-PNP binary and (B) AMP-PNP/PLN1-20 ternary PKA-C. (C) Contiguous and noncontiguous pathways involved in opening and closing of the enzyme stemming from the active site cleft (orange surface). (D) Residues that show no linear correlation in (A,B, shown as red points) with respect to opening/closing interact directly with the regulatory subunit of PKA, shown in the crystal structure (red surface, PDB 2QCS). Figure reproduced from Reference with permission from Macmillan Publishing.
Figure 44
Figure 44
Free energy landscape of ligand-induced PKA-C conformational fluctuations on fast (ps-ns, blue structures) and slow (μs-ms, green structures) timescales. Conformational exchange motions are presumed to be related to the opening and closing of the active site cleft, which is quenched in the presence of inhibitors (i.e. PKI5-24). Figure reproduce from Reference with permission from Elsevier.
Figure 45
Figure 45
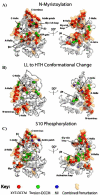
Allosteric interaction networks determined by MD simulations for various conformational states of PKA-C. (A) Effect of myristoylation comparing myr(+) and myr(−) simulations. (B) Effect of the LL → HTH conformational change comparing myr(+)-LL and myr(+)-HTH simulations. (C) Effect of S10 phosphorylation by comparing myr(+)phos(+)-HTH and myr(+)phos(−)-HTH simulations. Differences between each simulated conformational state are mapped onto the PKA-C structure (see ‘Key’ at the bottom), and the combined perturbation of all algorithms, reflective of the allosteric network, is depicted as a gold surface. Details of the simulation models and perturbation determinants can be found in the Materials and Methods section of Ref. . Figure reproduced from Reference with permission. Copyright 2012 American Chemical Society.
Figure 46
Figure 46
Slow timescale conformational motions in PKA-C measured by CPMG relaxation dispersion. Residues involved in the concerted motional network are mapped onto the structure of WT PKA-C, while dispersion curves of WT and Y204A PKA-C reveal a mutation-induced change in the nature of the dynamics. Figure reproduced from Reference with permission from Elsevier.
Figure 47
Figure 47
Cartoon representation of the R and R2 crystal structures of Hb A illustrating the difference in orientation of the α2β2 dimeric subunit when the α1β1 dimer is superimposed. Also included in the overlay is the solution structure of Hb A complexed with CO. The α2β2 dimeric units of the R, solution HbCo, and R2 structures are colored in dark, medium and light shades of red and blue, respectively. The C2 symmetry axes of the R and R2 structures are shown as black and white rods, respectively. Figure reproduced from Reference with permission from PNAS. Copyright (2003) National Academy of Sciences.
Figure 48
Figure 48
TROSY (blue) and HSQC (red) NMR spectra of the 15N labeled β-chain of Hb-CO showing cross peaks of βLys65 in (A) bicelle, (B) Pf1 phage, and (C) isotropic media. As described in Ref. , the separation between TROSY and HSQC resonances in (A) and (B) is given by [(1JNH + 1DNH)/2] and the RDC (1DNH) is extracted from differences in splitting between crystalline and isotropic media in which the TROSY vs. HSQC difference is 0.5 × 1JNH. Figure reproduced from Reference with permission from PNAS. Copyright (2003) National Academy of Sciences.

Similar articles

Cited by

References

    1. Tsai C-J, Nussinov R. A Unified View of "How Allosery Works". PLOS Comp. Biol. 2014;10:1–12. - PMC - PubMed
    1. Monod J, Wyman J, Changeux J-P. On the nature of allosteric transitions: A plausible model. J. Mol. Biol. 1965;12:88–118. - PubMed
    1. Koshland DE, Jr., Nemethy G, Filmer D. Comparison of Experimental Binding Data and Theoretical Models in Proteins Containing Subunits. Biochemistry. 1966;5:365–368. - PubMed
    1. Demerdash ONA, Daily MD, Mitchell JC. Structure-Based Predictive Models of Allosteric Hot Spots. PLoS Comput. Biol. 2009;5:e1000531–e1000555. - PMC - PubMed
    1. Weinkam P, Pons J, Sali A. A Structure-Based Model of Allostery Predicts Coupling Between Distant Sites. Proc. Natl. Acad. Sci. USA. 2012;109:4875–4880. - PMC - PubMed

Publication types

LinkOut - more resources