. 2015 Dec 22:8:79.
doi: 10.3389/fnmol.2015.00079. eCollection 2015.

Disturbances of Ligand Potency and Enhanced Degradation of the Human Glycine Receptor at Affected Positions G160 and T162 Originally Identified in Patients Suffering from Hyperekplexia

Affiliations

Disturbances of Ligand Potency and Enhanced Degradation of the Human Glycine Receptor at Affected Positions G160 and T162 Originally Identified in Patients Suffering from Hyperekplexia

Sinem Atak et al. Front Mol Neurosci. .

Abstract

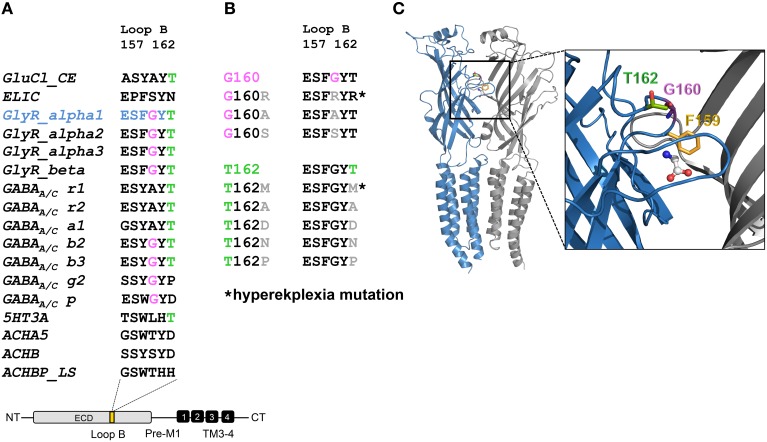
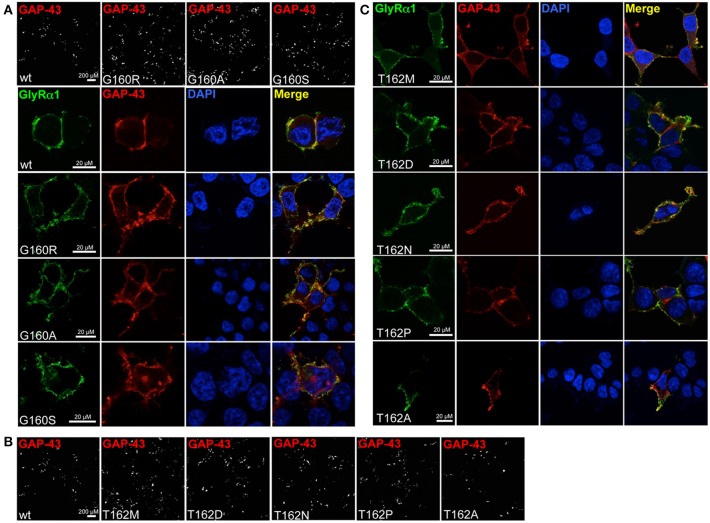
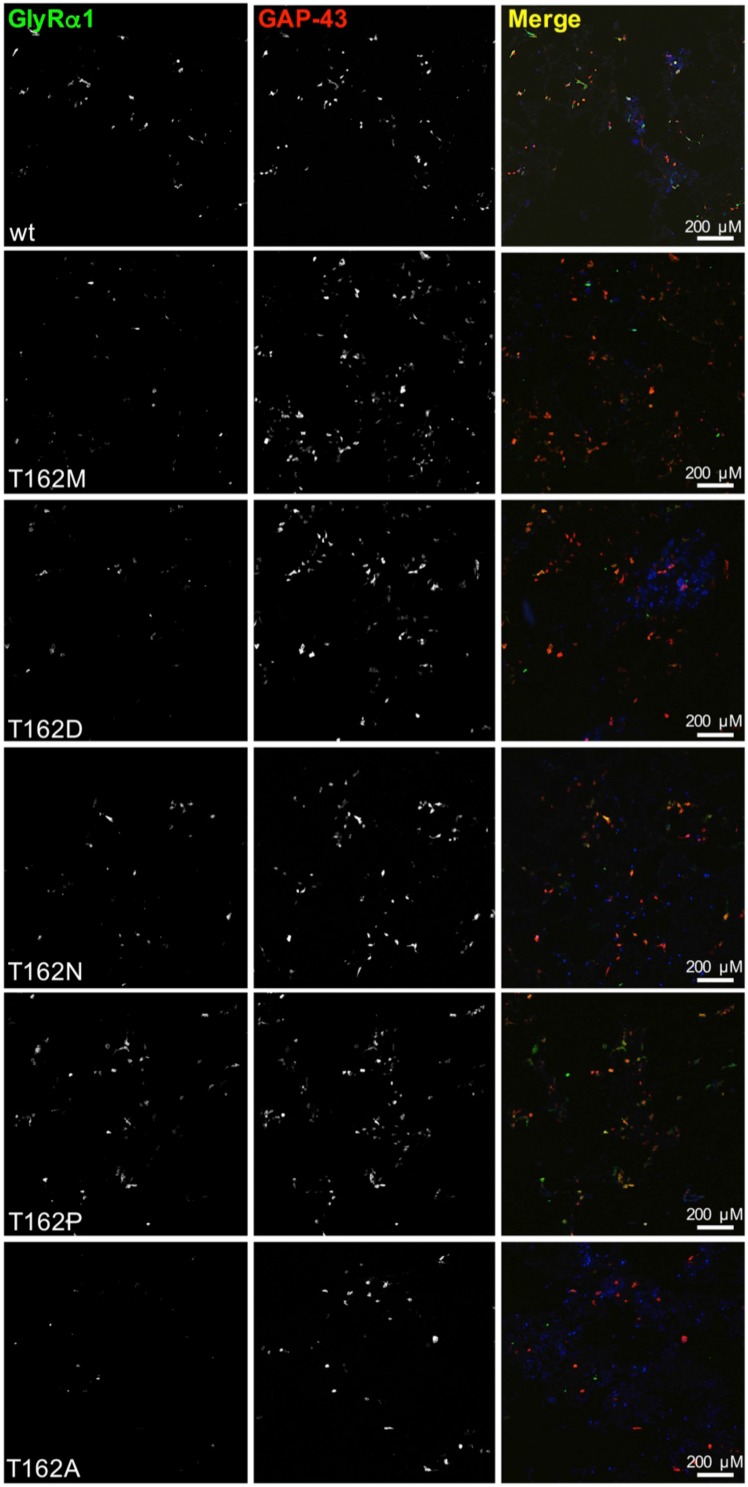
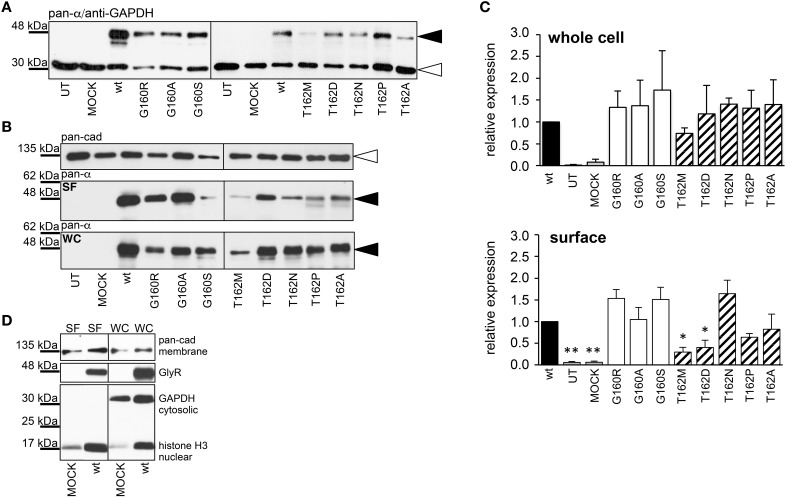
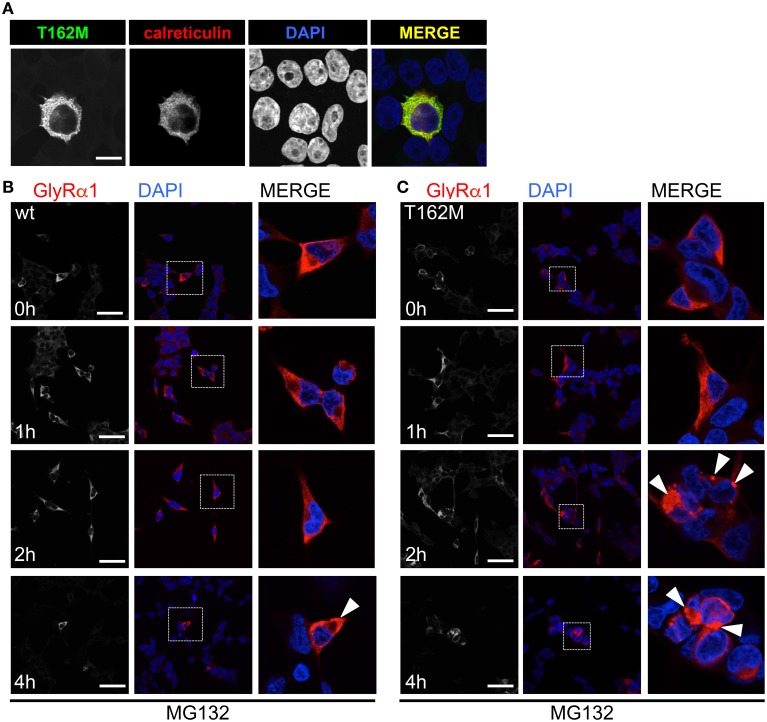
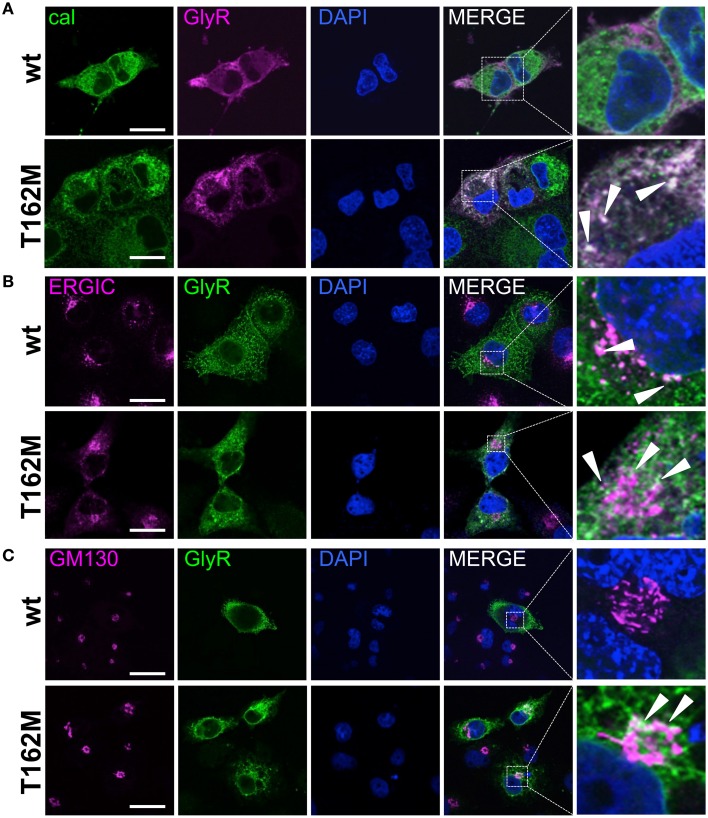
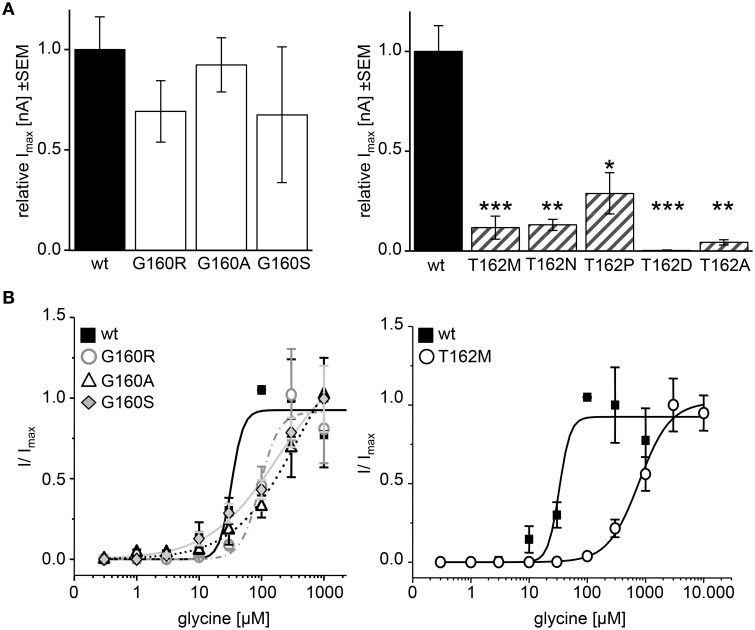
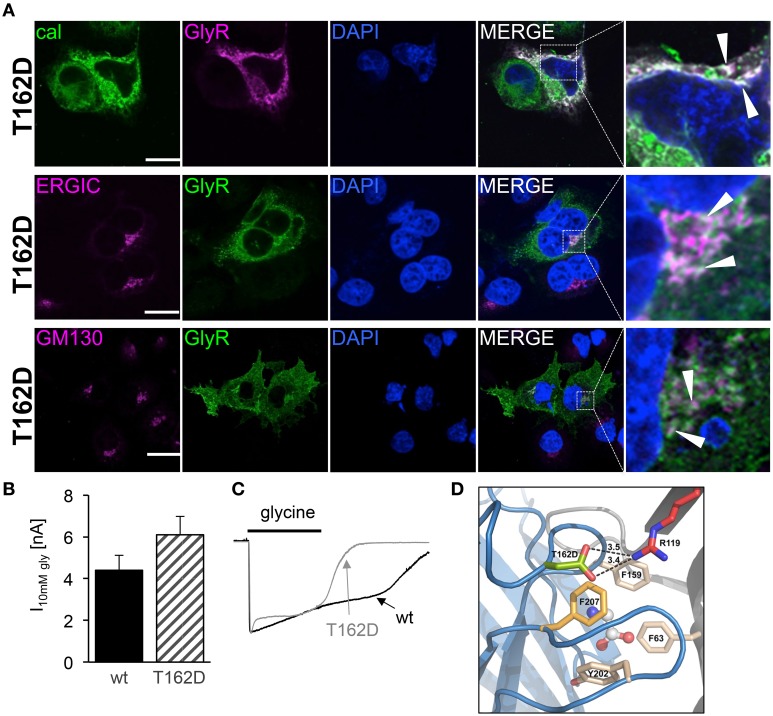
Ligand-binding of Cys-loop receptors is determined by N-terminal extracellular loop structures from the plus as well as from the minus side of two adjacent subunits in the pentameric receptor complex. An aromatic residue in loop B of the glycine receptor (GlyR) undergoes direct interaction with the incoming ligand via a cation-π interaction. Recently, we showed that mutated residues in loop B identified from human patients suffering from hyperekplexia disturb ligand-binding. Here, we exchanged the affected human residues by amino acids found in related members of the Cys-loop receptor family to determine the effects of side chain volume for ion channel properties. GlyR variants were characterized in vitro following transfection into cell lines in order to analyze protein expression, trafficking, degradation and ion channel function. GlyR α1 G160 mutations significantly decrease glycine potency arguing for a positional effect on neighboring aromatic residues and consequently glycine-binding within the ligand-binding pocket. Disturbed glycinergic inhibition due to T162 α1 mutations is an additive effect of affected biogenesis and structural changes within the ligand-binding site. Protein trafficking from the ER toward the ER-Golgi intermediate compartment, the secretory Golgi pathways and finally the cell surface is largely diminished, but still sufficient to deliver ion channels that are functional at least at high glycine concentrations. The majority of T162 mutant protein accumulates in the ER and is delivered to ER-associated proteasomal degradation. Hence, G160 is an important determinant during glycine binding. In contrast, T162 affects primarily receptor biogenesis whereas exchanges in functionality are secondary effects thereof.

Keywords: Cys-loop receptor; glycine receptor; hyperekplexia; ligand potencies; loop B; side chain properties.


Figures

Figure 1
Figure 1
Overview domain architecture of the GlyR. (A) The loop B region of amino acid residues 157–162 is highly conserved within the family of Cys-Loop receptors. All glycine receptor subunits (α1–blue, α2, α3, β) carry the sequence of ESFGYT. A glycine is localized at position 160 (pink) and a threonine at position 162 (green). (B) Loop B mutations (gray letter) are shown and residues linked to hyperekplexia are marked by an asterisk (*). Glycine 160 was mutated into an alanine G160A and a serine G160S. Threonine at position 162 was mutated into alanine, aspartate, asparagine and proline (T162A, D, N, and P). (C) Representation of two GlyR α1 subunits of a receptor (blue and gray chain, respectively). For this homology model the crystal structure of GluCl (3RIF) was used as a template. Within the loop B region of amino acid 157–162 (enlarged inlet) between β-sheets 7 and 8 of the ECD residues G160 (pink), T162 (green), and F159 (yellow) are marked.
Figure 2
Figure 2
Integration of GlyR variants into the cellular membrane. Different α1 mutants were expressed in HEK293 cells following co-transfection of a marker for membrane expression (GAP-43 coupled to dsRed). (A) Overview images (first line) represent controls for transfection efficiency (GAP-43) for wt and G160 variants. Below GlyR α1 homomers (green) expressed at cell surface (GAP-43 marker) are shown. G160R, G160A, and G160S mutants are well integrated into the cell surface. (B) Transfection efficiency controls for cotransfections of T162 mutants together with GAP-43 coupled to dsRed. (C) Mutant GlyRs at position 162 (T162M, T162N, T162D, T162P, and T162A) stained at the cell surface. All GlyR α1 were detected with the monoclonal MAb2b antibody. DAPI was used for staining of the nuclei.
Figure 3
Figure 3
Overview images demonstrating differences in GlyRα1 expression for T162 mutants. HEK293 cells were cotransfected with GlyR α1 wt (green) or T162 variants together with the membrane marker GAP-43 coupled to dsRed (red). GAP-43 serves as a marker for transfection efficiency and colocalizes with GlyR α1. Differences in GlyR expression of T162 variants in comparison to α1 wt were observed (first row).
Figure 4
Figure 4
Quantitative expression levels of mutant GlyRs. (A) Crude HEK293 whole cell lysates transiently expressing GlyR α1 (wt) or α1 variants. Loading control GAPDH 37 kDa. (B) Biotinylation pull down experiments to quantify the protein expression of GlyR α1 variants and to distinguish between whole cell (WC) and surface (SF) protein levels. The obtained data were taken from 4 independent experiments. The overall expression seems to be unaffected. Note, differences between surface expression levels of wt and G160 compared to T162 variants. Pan-cadherin was used as a loading control. The GlyR α1 variants were stained at the appropriate molecular weight of 48 kDa (black arrowheads), pan-cadherin appeared at 135 kDa (white arrowheads). (C) Quantification of protein levels determined from whole cell (WC) and surface (SF) fractions from 4 independent experiments normalized to pan-cadherin (membrane marker protein). The expression levels are shown in comparison to wild type (wt = 1). Error bars refer to standard error of the mean S.E.M. values. *p < 0.05, **p < 0.01 were considered significant. (D) Control for purity of surface protein fraction. Surface (SF) and whole cell (WC) fractions were loaded from MOCK and wt α1 transfected HEK293 cells. Both fractions were stained for the cytosolic protein GAPDH (37 kDa), the membrane marker pan-cadherin (135 kDa) and the nuclear marker histone H3 (17 kDa). Note, histones were stained in all fractions due to (i) their localization attached to the inner nuclear membrane, (ii) naturally occurring posttranslational biotinylation of histones, and (iii) binding to streptavidin beads following spin-down of membranes and solubilization of membrane attached proteins.
Figure 5
Figure 5
ER accumulation of T162M. (A) Following cotransfection into HEK293 cells, intracellular stainings of GlyR α1 T162M (MAb4a, green) and the ER marker calreticulin expressed as a fusion protein coupled to dsRed (red). (B) Inhibition of the proteasomal pathway using MG132 for 1, 2, and 4 h. Following 2 h presence of MG132, wt transfected cells (MAb4a, red signal) seemed rather unaffected in protein distribution. (C) In contrast, T162M (MAb4a, red) showed large accumulations in the cellular lumen (white arrowheads, third lane, right picture). Lower lane represents pictures after 4 h treatment with MG132. Enlarged images are shown in right column. GlyR wt (B) signal is dense, whereas T162M (C) is characterized by large protein aggregations localized close to the nucleus.
Figure 6
Figure 6
T162M degradation via the proteasomal degradation pathway. (A) MG132 was added to transfected HEK293 cells expressing either wt or T162M for 0, 1, and 2 h. Following incubation with the proteasomal blocker, cell lysates (40 μg per lane) were analyzed by Western blotting (upper blot) using the GlyR antibody MAb4a (black arrowhead, 48 kDa). GAPDH 37 kDa served as a loading control (white arrowhead). Inhibition of cellular lysosomes by leupeptin for 0, 6, and 12 h (lower blot), GAPDH 37 kDa. GlyR protein is marked by black arrowhead. (B) Quantification of protein levels after MG132 incubation for 1 and 2 h from 4 independent experiments. T162M increased after 2 h proteasomal block, *p < 0.05.
Figure 7
Figure 7
Trafficking routes of T162M. (A) Costaining of T162M (MAb4a, red) and calreticulin (green), a chaperone and ER quality control protein in the ER in transfected Cos7 cells. Note again large T162 accumulations in the ER compared to wt (upper lane, white dots marked by white arrowheads). (B) ERGIC co-staining of GlyR wt and T162M (anti-α1, green) together with ERGIC-53 (pink). (C) Cis-Golgi staining using GM130 (pink) as a marker of the secretory Golgi compartment. Mutant GlyR T162M (anti-α1, green) was visible in the cis-Golgi compartment. The white bar represents 30 μm. Right column represents enlargements of merged images (white dotted boxes).
Figure 8
Figure 8
Physiological changes in agonist potency due to affected loop B residues. Whole cell recordings on HEK293 cells transiently expressing GlyR α1 or mutant GlyR were performed to analyze receptor functionality and ligand potency. (A) Relative maximal currents (Imax) of G160 variants (left graph, white bars) determined at 100 μM glycine. Note, all T162 variants show reduced maximal currents (right graph, gray striped bars). n, number of independent measurements; n = 7; *p < 0.05, **p < 0.01, ***p < 0.001. (B) EC50 measurements using glycine concentrations of 1, 3, 10, 30, 100, 300, 1000, 3000, and 10.000 μM. GlyR α1 wt–black square, solid line; G160R–circles, dot-dashed line; G160A–triangle, dashed line; G160S–diamond, gray line; T162M–white circles, solid line. 1 mM glycine was used as a standard glycine concentration to determine I/Imax. n = 5–6.
Figure 9
Figure 9
Subcompartmental distribution of T162D. (A) Transfected Cos7 cells were used to co-stain GlyR α1 T162D (pink) with calreticulin (green). Large ER accumulations (white dots marked by white arrow heads) were obvious (right picture, first lane). Costaining of T162D (anti-α1, green) with ERGIC (pink, second lane), colocalization with GM130 (pink, third lane). Right pictures demonstrate enlarged areas of the white dotted box in the merged picture. (B) Whole cell maximal currents of T162D compared to α1 wt at saturating concentrations of glycine (10 mM). (C) Single traces of 10 mM recordings from wt and T162D. Note, the fast channel closure compared to wt channels during washout of very high glycine concentrations. (D) View from the side onto the ligand-binding site at the interface of two adjacent GlyR subunits (blue and gray), with bound glycine (in ball-and-stick representation). Residue D162 is marked in green, F159 in beige, further aromatic residues lining the glycine binding site (Y202, F63) are beige and R119 shown in red with putative salt bridge indicated by black dashed lines and distances given in Å. Note: F63 and R119 are localized at the neighboring subunit.

Similar articles

Cited by

References

    1. Bailey L. M., Ivanov R. A., Wallace J. C., Polyak S. W. (2008). Artifactual detection of biotin on histones by streptavidin. Anal. Biochem. 373, 71–77. 10.1016/j.ab.2007.09.003 - DOI - PubMed
    1. Beato M. (2008). The time course of transmitter at glycinergic synapses onto motoneurons. J. Neurosci. 28, 7412–7425. 10.1523/JNEUROSCI.0581-08.2008 - DOI - PMC - PubMed
    1. Becker K., Hohoff C., Schmitt B., Christen H. J., Neubauer B. A., Sandrieser T., et al. . (2006). Identification of the microdeletion breakpoint in a GLRA1null allele of Turkish hyperekplexia patients. Hum. Mutat. 27, 1061–1062. 10.1002/humu.9455 - DOI - PubMed
    1. Bode A., Lynch J. W. (2013). Analysis of hyperekplexia mutations identifies transmembrane domain rearrangements that mediate glycine receptor activation. J. Biol. Chem. 288, 33760–33771. 10.1074/jbc.M113.513804 - DOI - PMC - PubMed
    1. Bode A., Lynch J. W. (2014). The impact of human hyperekplexia mutations on glycine receptor structure and function. Mol. Brain 7:2. 10.1186/1756-6606-7-2 - DOI - PMC - PubMed