Review
. 2016 Jan:61:83-108.
doi: 10.1016/j.plipres.2015.12.002. Epub 2015 Dec 15.

Novel advances in shotgun lipidomics for biology and medicine

Affiliations
Review

Novel advances in shotgun lipidomics for biology and medicine

Miao Wang et al. Prog Lipid Res. 2016 Jan.

Abstract

The field of lipidomics, as coined in 2003, has made profound advances and been rapidly expanded. The mass spectrometry-based strategies of this analytical methodology-oriented research discipline for lipid analysis are largely fallen into three categories: direct infusion-based shotgun lipidomics, liquid chromatography-mass spectrometry-based platforms, and matrix-assisted laser desorption/ionization mass spectrometry-based approaches (particularly in imagining lipid distribution in tissues or cells). This review focuses on shotgun lipidomics. After briefly introducing its fundamentals, the major materials of this article cover its recent advances. These include the novel methods of lipid extraction, novel shotgun lipidomics strategies for identification and quantification of previously hardly accessible lipid classes and molecular species including isomers, and novel tools for processing and interpretation of lipidomics data. Representative applications of advanced shotgun lipidomics for biological and biomedical research are also presented in this review. We believe that with these novel advances in shotgun lipidomics, this approach for lipid analysis should become more comprehensive and high throughput, thereby greatly accelerating the lipidomics field to substantiate the aberrant lipid metabolism, signaling, trafficking, and homeostasis under pathological conditions and their underpinning biochemical mechanisms.

Keywords: Alzheimer's disease; Bioactive lipids; Lipidomics; Mass spectrometry; Metabolic syndrome; Shotgun lipidomics.


Figures

Figure 1
Figure 1
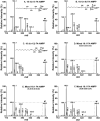
The dependence of ionization efficiency on the charge propensities of analytes. A glycerophospholipid mixture was comprised of 1 pmol/μL each of di15:0 and di22:6 phosphatidylglycerol (PG) (representing anionic glycerophospholipids), 10 pmol/μL each of di14:1 and di18:1 phosphatidylcholine (PC) (representing charge neutral, but polar lipids), and 15 pmol/μL each of di15:0 and di20:4 phosphatidylethanolamine (PE) (representing weakly anionic lipids) species in 1:1 chloroform/methanol (v/v). The mixture was analyzed with a QqQ mass spectrometer (TSQ Quantum Ultra, Thermo Fisher Scientific) in the negative- (Panels A and C) or positive-ion (Panels B and D) mode after direct infusion in the absence (Panels A and B) or presence (Panels C and D) of 30 pmol/μL of LiOH in methanol. All the indicated molecular species were confirmed with product ion ESI-MS analysis. The horizontal bars indicate the ion peak intensities after 13C deisotoping and normalizing the species to the one with less number of carbon atoms (i.e., the one with lower molecular weight) in each lipid class. (Modified from the ref [39] with permission from the American Society for Mass Spectrometry, Copyright 2006).
Figure 2
Figure 2
Illustration of the workflow of global analysis of cellular lipidomes directly from a crude extract of a biological sample after intrasource separation or with derivatization. First, diluted lipid extracts are directly analyzed in the negative- and positive-ion modes to determine anionic lipids (Condition I) and individual species of some special lipid classes (e.g., sodiated choline lysoglycerophospholipid and protonated acylcarnitine) (Condition II), respectively. Then weakly anionic lipid classes such as ethanolamine-containing lipids (Condition III) and charge-neutral, but polar lipids (e.g., phosphocholine-containing lipid classes and triacylglycerols) (Condition IV) are determined in the negative- and positive-ion modes, respectively, after addition of a small amount of LiOH to the diluted lipid solution. Finally, small portions of lipid solution can be separately derivatized for analysis of some specific lipid classes such hydroxyalkenal, carboxylic acid-containing lipid classes, hydroxyl-containing lipid classes, etc. (Condition V). Some examples of analysis of these lipid classes after derivatization are given in Section 2.2. After intrasource separation or derivatization, analyzing individual species of a class of interest is achieved through building block analysis by MS/MS in an MDMS-SL manner, which is exemplified in Figure 2.
Figure 3
Figure 3
Illustration of analyzing mouse myocardial lipid species by using multi-dimensional mass spectrometry-based shotgun lipidomics (MDMS-SL) after intrasource separation. Mouse heart sample (∼ 15 mg) was dissected and a lipid extract of the tissue was prepared by using a modified procedure of Bligh-Dyer extraction. A small portion of the lipid extract was diluted and directly analyzed under different mass spectrometric conditions (Conditions I and II of Figure 2) to selectively ionize anionic lipids (Top mass spectrum of left panel) or to form sodiated or protonated lipids for analysis of some special lipid classes from these kinds of adducts (Second mass spectrum of left panel), respectively. Another portion of the lipid extract was diluted and rendered to weakly basic with addition of a small amount of a base solution such as LiOH. This basic lipid solution was used to analyze weakly anionic lipids (e.g., free fatty acids, phosphatidylethanolamines (PE), and lysoPE, etc.) in the negative-ion mode (Condition III of Figure 2) (Third mass spectrum of left panel) and charge-neutral lipids (e.g., acylcarnitine, phosphatidylcholine (PC), lysoPC, triglycerides, cholesteryl esters, etc.) in the positive-ion mode (Condition IV of Figure 2) (Bottom mass spectrum of left panel). Each of these detected lipid classes was then identified and quantified separately by two-dimensional mass spectrometry. Right panel shows an example of analyzing individual choline lysoglycerophospholipid (lysoPC) species (which are present in very low abundance as shown in the second mass spectrum of left panel as acquired under Condition II) through the combined analyses of multiple neutral loss scans (NLS) and/or precursor-ion scans (PIS). These NLS and/or NLS spectra specifically detect the fragments (i.e., building blocks) resulted from individual lysoPC species including regioisomers. The rest portion of the lipid extract was used to analyze many other lipid classes (e.g., mono- and diacylglycerols, eicosanoids, retinoic acids, 4-hydroxyalkanels, etc., which are present in very low abundance, or not ionizable, or not containing specific fragments for NLS/PIS analyses) through derivatization as described in the text (Section 2.2).
Figure 4
Figure 4
Scheme of Michael adduct of carnosine with 4-hydroxyalkenal species followed by spontaneous hydrolysis. R represents any aliphatic moiety with or without double bond(s).
Figure 5
Figure 5
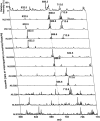
Representative product ion and two-dimensional mass spectrometric analyses of carnosine-adducted 4-hydroxyalkenal species. Carnosine-4-hydroxyalkenal adducts were prepared by incubating individual 4-hydroxyalkenal species as previously described [103]. Product ion ESI-MS analyses of carnosine adducts of 4-hydroxynonenal (4-HNE, Panel A), 4-hydroxyhexenal (4-HHE, Panel C), and 4-hydroxynondienal (4-HNDE, Panel D) were performed on a QqQ mass spectrometer as previously described [103]. The fragmentation pattern of protonated 4-HNE-carnosine adduct was proposed (Panel B). Lipid extracts of mouse myocardium were prepared by a modified Bligh-Dyer method and derivatized with carnosine as described previously [103]. Two-dimensional mass spectrometric analyses of carnosine-adducts of 4-hydroxyalkenal species present in mouse myocardial lipid extracts comprised of their unique fragments (i.e., building blocks) derived from Panels A to D including NLS17.0, NLS63.0, NLS71.0, and NLS117.0 were conducted on a QqQ mass spectrometer (TSQ Vantage, Thermo Fisher Scientific) after direct infusion of the derivatized lipid extract at collision energy of 16, 27, 23, and 28 eV, respectively, and collision gas pressure of 1 mTorr. “IS” stands for internal standard.
Figure 6
Figure 6
Scheme of amidation reaction between aliphatic carboxylic acid and a primary amine carrying a positive charge. The reaction is catalyzed by 1-ethyl-3-(3-dimethylaminopropyl)carbodiimide (EDC).
Figure 7
Figure 7
Product ion ESI-MS analyses of 18:1 fatty acid isomers and their mixtures after derivatized with N-(4-aminomethylphenyl)pyridinium (AMPP). Derivatization of 18:1 fatty acid isomers and their mixtures with AMPP and product ion ESI-MS analyses of derivatized 18:1(n-7) (Panel A), 18:1(n-9) (Panel B), and 18:1(n-12) (Panel C) FA isomers, and n-7/n-9/n-12 18:1 FA isomer mixtures in a ratio of 0.33:0.33:0.33 (Panel D), 0.2:0.4:0.4 (Panel E), or 0.06:0.60:0.34 (Panel F) at collision energy of 40 eV and collision gas pressure of 1 mTorr were performed as described previously [76]. The majority of the abundant fragment ions after charge-remote fragmentation with AMPP was assigned and illustrated in the corresponding molecular structures. The signatures highlighted with the broken lined boxes were used to determine the composition of 18:1 FA isomers in the mixtures through multiple linear regression analysis of these signatures as the responses with the fragmentation patterns of individual 18:1 FA isomers (shown in Panels A to C) as the predictors.
Figure 8
Figure 8
Representative two-dimensional MS analysis of lithiated DMG-DAG species present in lipid extracts of mouse liver samples. All MS/MS scans (i.e., NLS103, PIS110, and NLS87) for characterization of the DMG head group and all NLS of FA chains from lithiated DMG-DAG species were performed as previously described [116]. Individual MS and MS/MS traces presented in two-dimensional mass spectrometric analysis were displayed after normalization of the base peaks in the spectra. Identification of individual DMG-DAG species from the two-dimensional mass spectrometry exemplified was discussed in the text.
Figure 9
Figure 9
Product ion ESI-MS analyses of representative lithiated dimethylglycine (DMG)-derivatized monoacylglycerol (MAG) and N-acylethanolamine (NAE) species. Derivatization of MAG and NAE species with DMG was conducted as described previously [116]. Product ion analyses of derivatized 18:0 (A) and 20:4 MAG (B), and 18:0 (C), and 20:4 NAE (D) species were performed after selection of the corresponding lithiated molecular ions by Q1, collision activation in Q2 with collision energy of 35 eV and collision gas pressure of 1.0 mTorr, and product ion detection by Q3. The majority of the fragment ions in the spectra were assigned.
Figure 10
Figure 10
Representative comparison of tandem MS mass spectra of lysoglycerophospholipid (lysoGPL) species present in lipid extracts of the livers between wild-type and ob/ob mice. Tandem mass spectra were acquired as described previously [130]. Each paired mass spectra were displayed after normalization to the internal standard (IS) peaks (i.e., the peaks corresponding to IS are equally intense in each paired spectra) for direct comparisons. The red arrows indicate the changes of some lipid species in ob/ob mice in comparison to controls. LysoPC, lysoPE, lysoPG, and lysoPI denote choline lysoglycerophospholipid, ethanolamine lysoglycerophospholipid, lysophosphatidylglycerol, and lysophosphatidylinositol, respectively.
Figure 11
Figure 11
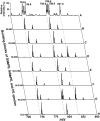
Representative MS and neutral loss analyses of methylated DMePE, MMePE, and PE species. An equimolar mixture of di16:0 and di18:1 DMePE, di16:0 and di18:1 MMePE, and di16:0, di18:3, and 16:0-22:6 PE at 1 pmol/μl each was treated with CD3I as described previously [138]. A survey scan (A), and NLS62.1 (B, for methylated DMePE), NLS65.1 (C, for methylated MMePE), and NLS68.1 (D, for methylated PE) performed at collision energy of 26 eV, and NLS186 (E, for methylated DMePE), NLS189 (F, for methylated MMePE), NLS192 (G, for methylated DMePE and PE), and NLS195 (H, for methylated MMePE) performed at collision energy of 33 eV were acquired as previously described [138].
Figure 12
Figure 12
Scheme of Paternò–Büchi reaction between acetone and a lipid species containing a double bond initiated with UV light (hv).
Figure 13
Figure 13
Schematic illustration of cardiolipin biosynthesis and remodeling pathways. Cardiolipin (CL) biosynthesis is initiated from condensation of phosphatidic acid (PA) and CTP to produce cytidine diphosphate-diacylglycerol (CDP-DAG) through phosphatidate cytidylyltransferase activity. The produced CDP-DAG reacts with glycerol-3-phosphate to form phosphatidylglycerol phosphate (PGP) catalyzed by PGP synthase. PGP is dephosphated to generate phosphatidylglycerol (PG). Newly synthesized CL (immature CL) is formed by the condensation of PG and CDP-DAG catalyzed by CL synthase. Immature CL is then deacylated to form monolysoCL and then reacylated using acyl chains from acyl CoA or the sn-2 acyl chain of phosphatidylcholine (PC) and phosphatidylethanolamine (PE) species, leading to the formation of matured CL. The highlighted lipid classes with red indicate those that were determined by MDMS-SL.
Figure 14
Figure 14
Schematic illustration of triacylglycerol biosynthesis model for simulation of triacylglycerol ion profiles. Triacylglycerol (TAG) species are de novo synthesized with reacylation of diacylglycerol (DAG) species of different pools produced mainly through dephosphorylation of phosphatidic acid (PA) (DAGPA) and reacylation of monoacylglycerol (MAG) (DAGMAG) as well as, to a less degree (as indicated with a broken line arrow), through hydrolysis of phosphatidylinositol (PI) with phospholipase C (PLC) activities (DAGPI). The contributions of these pathways to the TAG pools were determined through simulation of individual TAG ion profile with parameters of K1, K2, and K3, respectively, which are the probabilities of individual DAG pools being reacylated to TAG. In addition, the parameters of k1, k2, and k3 were used in the sn-1, 2, and 3 reacylation steps of TAG species in the forms of exp(-k1.xj), exp(k2.xj), and exp(-k3.xj), respectively, where k1 and k3 represented a simulated decay constant whereas k2 represented a simulated enhancing constant, and xj is the number of double bonds present in the corresponding FA chain. MGAT and DGAT denote MAG and DAG acyltransferases, respectively. The multiple arrows at the k1 step indicate that MAG species could be generated from a variety of sources such as lysoPA dephosphatation, DAG hydrolysis, and glycerol acylation.
Figure 15
Figure 15
Comparison of representative mass spectral analyses of ethanolamine glycerophospholipid (PE) and phosphatidylserine (PS) species present in the samples of brain from infant monkeys with or without exposure to sevoflurane. MDMS-SL analysis of lipid extracts from brain samples of infant monkeys with or without prolonged exposure to sevoflurane was performed in the negative-ion mode as previously described [233]. The narrows with red between the paired mass spectra indicated that the mass levels of individual PE species were significantly reduced in sevoflurane-exposed brain compared to those of the controls. The narrows with blue between the paired mass spectra indicated that the mass levels of individual PS species were significantly reduced in sevoflurane-exposed brain compared to those of the controls. The paired mass spectra are displayed after normalization to the internal standard (IS) peaks (i.e., the peaks corresponding to the IS are equally intense in each paired spectra) for direct comparisons.

Similar articles

Cited by

References

    1. Yetukuri L, Katajamaa M, Medina-Gomez G, Seppanen-Laakso T, Vidal-Puig A, Oresic M. Bioinformatics strategies for lipidomics analysis: characterization of obesity related hepatic steatosis. BMC Syst Biol. 2007;1:12. - PMC - PubMed
    1. Han X, Jiang X. A review of lipidomic technologies applicable to sphingolipidomics and their relevant applications. Eur J Lipid Sci Technol. 2009;111:39–52. - PMC - PubMed
    1. Yang K, Cheng H, Gross RW, Han X. Automated lipid identification and quantification by multi-dimensional mass spectrometry-based shotgun lipidomics. Anal Chem. 2009;81:4356–68. - PMC - PubMed
    1. Nomenclature I-ICoB. The nomenclature of lipids (recommendations 1976)
    2. Eur J Biochem. 1977;79:11–21. - PubMed
    3. Hoppe-Seylers Z Physiol Chem. 1977;358:617–631. - PubMed
    4. Lipids. 1977;12:455–468. - PubMed
    5. Mol Cell Biochem. 1977;17:157–171.
    6. Chem Phys Lipids. 1978;21:159–173.
    7. J Lipid Res. 1978;19:114–128. - PubMed
    8. Biochem J. 1978;171:21–35. http://www.chem.qmulac.uk/iupac/lipid/ - PMC - PubMed
    1. Fahy E, Subramaniam S, Brown HA, Glass CK, Merrill AH, Jr, Murphy RC, Raetz CR, Russell DW, Seyama Y, Shaw W, Shimizu T, Spener F, van Meer G, VanNieuwenhze MS, White SH, Witztum JL, Dennis EA. A comprehensive classification system for lipids. J Lipid Res. 2005;46:839–61. - PubMed

Publication types