. 2016 Jan 12;23(1):194-205.
doi: 10.1016/j.cmet.2015.12.001. Epub 2015 Dec 15.

SerpinB1 Promotes Pancreatic β Cell Proliferation

Affiliations

SerpinB1 Promotes Pancreatic β Cell Proliferation

Abdelfattah El Ouaamari et al. Cell Metab. .

Abstract

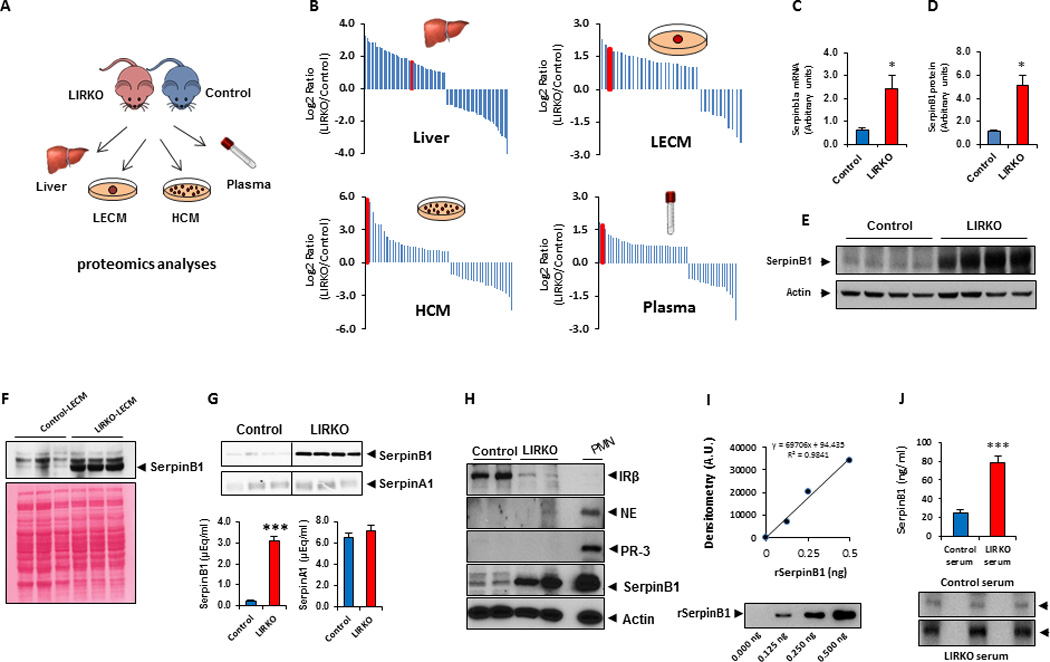
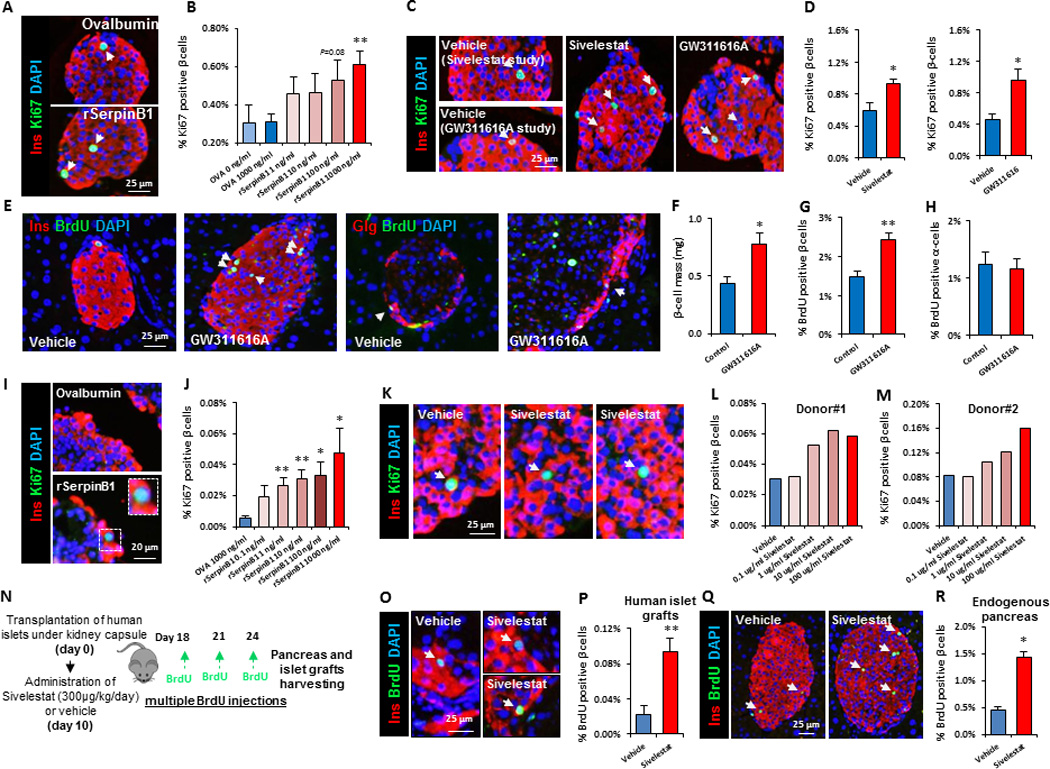
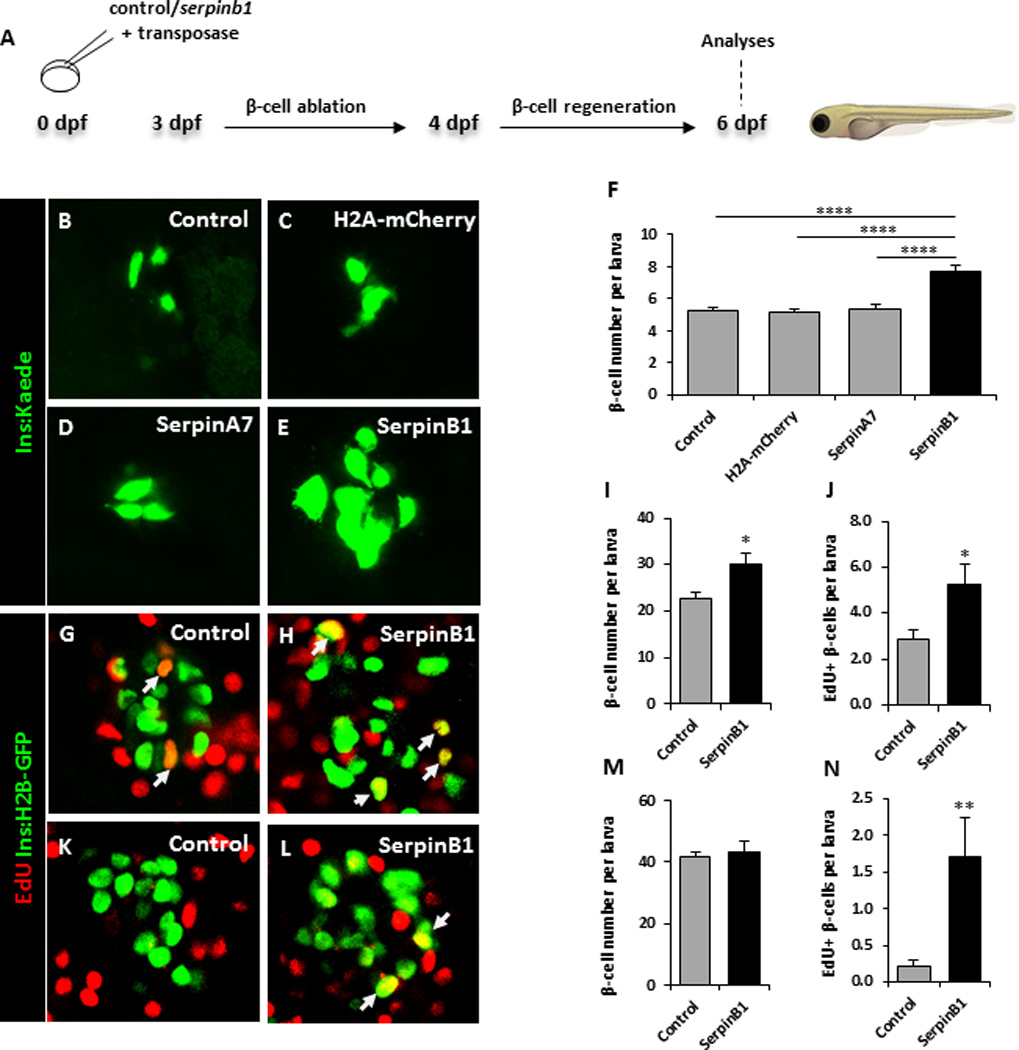
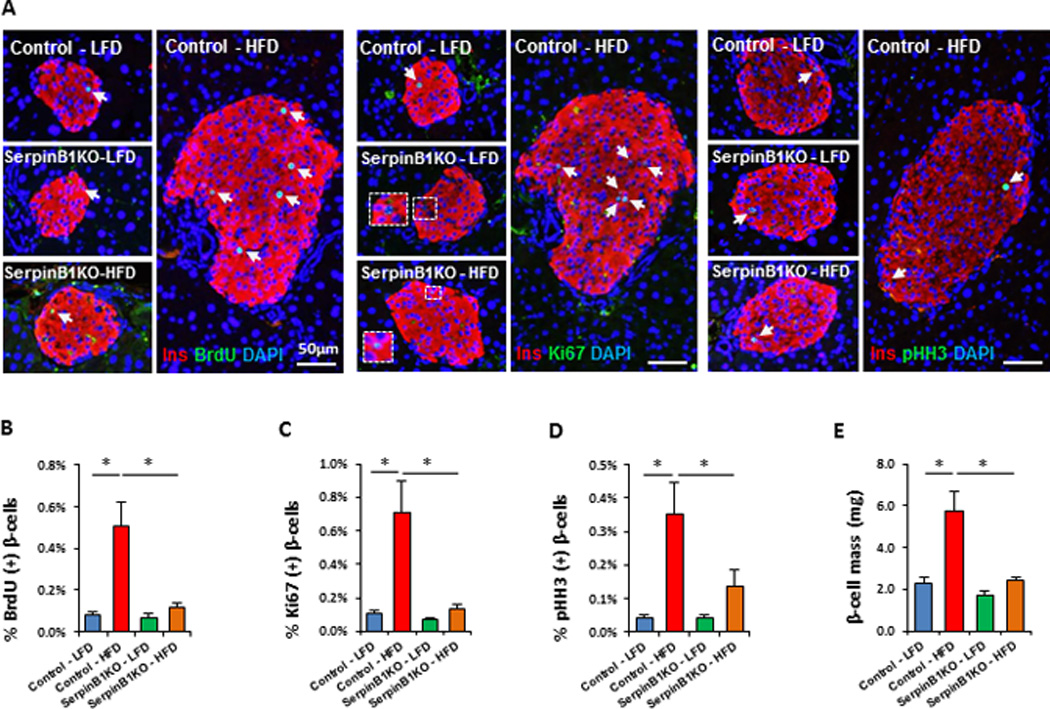
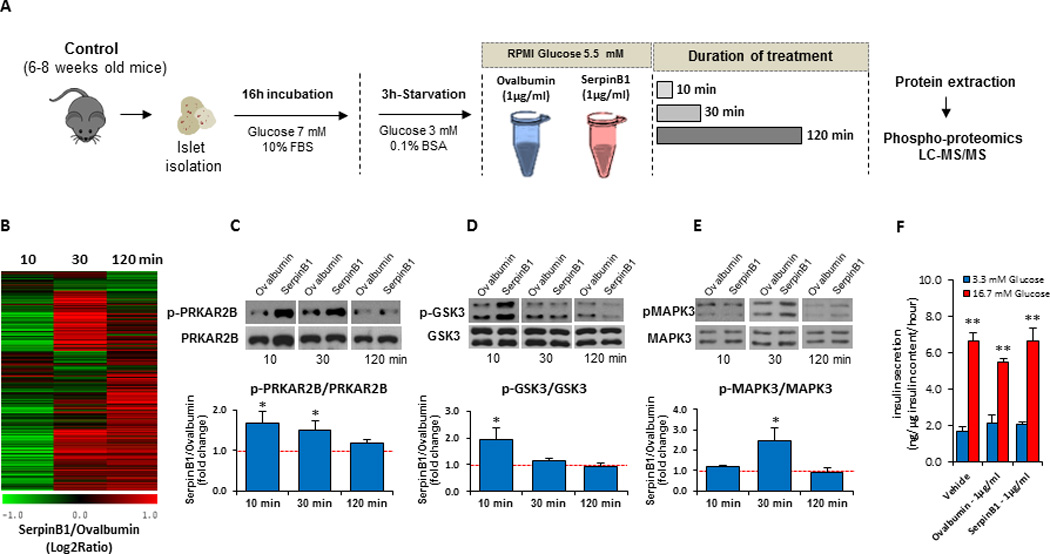
Although compensatory islet hyperplasia in response to insulin resistance is a recognized feature in diabetes, the factor(s) that promote β cell proliferation have been elusive. We previously reported that the liver is a source for such factors in the liver insulin receptor knockout (LIRKO) mouse, an insulin resistance model that manifests islet hyperplasia. Using proteomics we show that serpinB1, a protease inhibitor, which is abundant in the hepatocyte secretome and sera derived from LIRKO mice, is the liver-derived secretory protein that regulates β cell proliferation in humans, mice, and zebrafish. Small-molecule compounds, that partially mimic serpinB1 effects of inhibiting elastase activity, enhanced proliferation of β cells, and mice lacking serpinB1 exhibit attenuated β cell compensation in response to insulin resistance. Finally, SerpinB1 treatment of islets modulated proteins in growth/survival pathways. Together, these data implicate serpinB1 as an endogenous protein that can potentially be harnessed to enhance functional β cell mass in patients with diabetes.


Figures

Fig. 1
Fig. 1. Identification of serpinB1 in the LIRKO model
A. Experimental workflow for analysis of proteins from liver, liver explant conditioned media (LECM), hepatocyte-conditioned media (HCM), and plasma. B. Identification of serpinB1 by LC-MS/MS proteomics. Protein abundances were quantified based on spectral counts, and top differentially expressed proteins were plotted as log2 ratio of LIRKO vs control. Red bars correspond to serpinB1. C. Relative quantification of liver serpinb1a mRNA by quantitative RT-PCR (normalized to TBP). Data represent mean ± SEM. *p ≤ 0.05, (n=6 per group). D. Quantification of serpinB1 protein (in E) in 12 wk-old male control and LIRKO mice. E. Western blot of serpinB1 in liver. SerpinB1 protein was normalized to actin, and data represent mean ± SEM. *p ≤ 0.05, (n=4–5 per group). F. Western blot (top panel) of serpinB1 in LECM from 12 wk-old male control and LIRKO mice. Bottom panel shows Ponceau S staining of protein. G. Western blot of serpinB1 and serpinA1 (α1–antitrypsin) in LECM from control or LIRKO mice (10 wk old males). The bands (top panel) were quantified (bottom panel) relative to human SerpinB1 and human SerpinA1 run in parallel as standards. Data represent mean ± SEM, ***p ≤ 0.001 (n=3 per group). H. Western blot of insulin receptor, serpinB1, neutrophil elastase (NE) and proteinase-3 (PR-3) in hepatocytes from 12-wk-old male control or LIRKO mice. IR-β, insulin receptor beta subunit; NE, neutrophil elastase; PR-3, proteinase-3; PMN; polymorphonuclear leukocytes. I–J. Analysis of serpinB1 by western blot in serum derived from 12-wk-old male control or LIRKO mice. Quantification of serpinB1 bands in (J) is based on parallel standard curve of recombinant human SerpinB1 shown in (I). Data represent mean ± SEM. ***p ≤ 0.01, (n=10–12 per group)
Fig. 2
Fig. 2. SerpinB1 and its partial mimics promote proliferation of mouse and human pancreatic β-cells
A. Representative images of mouse islets treated with ovalbumin or SerpinB1 and co-immunostained for Ki67, insulin and DAPI. B. Quantification of Ki67+ insulin+ cells (in A). Data represent mean ± SEM. **p ≤ 0.01, (n=6–12 per group). C. Representative images and quantitation of insulin+ Ki67+ cells of islets isolated from wild-type male mice and cultured for 48 hr in presence of 100 µg/ml of either sivelestat or GW311616A. D. Quantification of insulin+Ki67+ cells of sivelestat-treated islets (in C). Data represent mean ± SEM. *p ≤ 0.05, (n=3 per group for GW311616A studies and n=6 per group for sivelestat studies). Five to six-week old wild-type male mice were treated with GW311616A for 2 wks. Islet β-cell and α-cell proliferation was assessed by immunostaining. E. Pancreatic sections co-immunostained for BrdU and insulin and DAPI (two left panels) or co-immunostained for glucagon and BrdU and DAPI (two right panels). F. Quantification of beta cell mass (in E). Data represent mean ± SEM. *p ≤ 0.05, (n=4–5 per group). G. Quantification of insulin+ BrdU+ cells (in E). Data represent mean ± SEM. **p ≤ 0.01, (n=4–5 per group). H. Quantification of glucagon+ BrdU+ cells (in E). Data represent mean ± SEM. **p ≤ 0.01, (n=4–5 per group). I. Representative images of human islets treated with ovalbumin or SerpinB1 and co-immunostained for Ki67, insulin and DAPI. J. Quantification of Ki67+ insulin+ cells (in I). Data represent mean ± SEM. *p ≤ 0.05, **p ≤ 0.01, (n=7 per group). For details of the human donors please see Table S2. K. Representative images of human islets treated with vehicle or sivelestat and co-immunostained for Ki67, insulin and DAPI. L and M. Quantification of Ki67+ insulin+ cells (in K). For details of human donors please see Table S3. N. Experimental workflow for transplantation studies to explore the effects of sivelestat on human β-cell proliferation in vivo. O. Representative images of human islet grafts retrieved from mice treated with sivelestat or vehicle and co-immunostained for BrdU, insulin and DAPI. P. Quantification of BrdU+ insulin+ cells (in O). Q. Representative images of endogenous pancreases harvested from mice treated with sivelestat or vehicle and co-immunostained for BrdU, insulin and DAPI. R. Quantification of BrdU+ insulin+ cells (in Q). For details of human donors please see Table S3. Data represent mean ± SEM. *p ≤ 0.05, **p ≤ 0.01, (n=5–6 per group for retrieved human islet grafts and n=3 for endogenous pancreas). Arrows indicate proliferating cells.
Fig. 3
Fig. 3. Overexpression of Serpinb1 in zebrafish enhances β-cell regeneration and proliferation
A. Schematic of experimental plan. B–E. Representative images at 6 dpf of Tg(ins:kaede);Tg(ins:CFP-NTR) transgenic larvae that had not been injected (control), or injected at the 1-cell stage with transposase mRNA + bactin:H2A-mCherry, bactin:serpina7, or bactin:serpinb1; subjected to β-cell ablation by metronidazole during 3–4 dpf, and subsequently allowed to regenerate for 2 days. F. Quantification of β-cell regeneration at 6 dpf in control (n=87), bactin:H2A-mCherry-overexpressing (n=61), bactin:serpina7-overexpressing (n=46), bactin:serpinb1-overexpressing (n=36) Tg(ins:kaede);Tg(ins:CFP-NTR) larvae. G–J. Control (n=27) and bactin:serpinb1-overexpressing (n=18) Tg(ins:H2B-GFP);Tg(ins:Flag-NTR) transgenics were treated with metronidazole from 3–4 dpf to ablate the β-cells, and subsequently incubated with EdU during regeneration from 4–6 dpf. G–H. Representative confocal images at 6 dpf of control and bactin:serpinb1-overexpressing larvae showing β-cells in green and the β-cells that had incorporated EdU in yellow (green and red overlap; arrowheads). I. Quantification of the total number of β-cells at 6 dpf. J. Quantification of β-cells that incorporated EdU during β-cell regeneration from 4–6 dpf. K–N. To determine whether Serpinb1 affects β-cell proliferation during regular development, we treated control (n=25) and bactin:serpinb1-overexpressing Tg(ins:H2B-GFP) (n=21) transgenic larvae with EdU from 4–6 dpf. K–L. Representative confocal images at 6 dpf of control and bactin:serpinb1-overexpressing larvae showing β-cells in green and the β-cells that had incorporated EdU in yellow (green and red overlap; arrowhead). M. Quantification of the total number of β-cells at 6 dpf. N. Quantification of β-cells that incorporated EdU from 4–6 dpf. Data shown are the mean ± SEM; **** P<0.0001, **P<0.01, * P<0.05. Arrows indicate proliferating cells.
Fig. 4
Fig. 4. SerpinB1 deficiency leads to maladaptive β-cell proliferation in insulin resistant states
Eight week old control or serpinb1a−/− (serpinB1KO) male mice were challenged with low fat diet (LFD) or HFD for 30 weeks. Five hours before sacrificing, mice were injected with BrdU (100 mg/kg body weight). A. Representative images of pancreases co-immunostained for BrdU and insulin and DAPI (left panel). Representative images of pancreases co-immunostained for Ki67 and insulin and DAPI (middle panel). Representative images of pancreases co-immunostained for pHH3 and insulin and DAPI (right panel). B. Quantification of BrdU+ insulin+ cells (in A). C. Quantification of Ki67+ insulin+ cells (in A). D. Quantification of pHH3+ insulin+ cells (in A). E. Measurement of β-cell mass. Data represent mean ± SEM. *p ≤ 0.05, (n=4–6 per group). Immunostaining for BrdU and Ki67 markers, shown in (A), were performed on consecutive sections. Arrows indicate proliferating cells.
Fig. 5
Fig. 5. Protease inhibitory activity is involved in SerpinB1 enhancement of β-cell proliferation
A. Activity of recombinant human SerpinB1 demonstrated by covalent complex formation with protease as previously described (Cooley et al., 2001). SerpinB1 (160ng), generated in insect cells (see Methods), was incubated with the indicated molar equivalents (mol.eq.) of human neutrophil elastase (NE) or porcine pancreatic elastase (PE) in 20 µl for 5 min at 37°C. Shown are reduced SDS gels gold-stained for total protein. Arrows indicate active SerpinB1 (42 kD), NE or PE (26 kD), complex (cpx, 66 kD) and post-cpx (inactive) SerpinB1 (38 kD). B. Activities of commercial recombinant SerpinB1 preparations and two preparations of insect cell-derived untagged SerpinB1 examined by peptidase inhibition. NE (500 ng) was combined with the indicated molar equivalents of SerpinB1 preparations in 150 µl, and the mixtures were incubated at 37C for 3 min. The substrate Ala-Ala-Pro-Val-p-nitroanilide was added and the change of OD405 nm was measured over 5 min. The abscissa shows the molar inhibitor:proteinase (I:P) ratio during the 3 min reaction. C. Activities of preparations of recombinant human serpinB1 examined by complex formation with NE. Equal amounts of SerpinB1 preparation (160ng based on suppliers' information) was incubated with the indicated molar equivalents of NE for 5 min at 37°C. Shown are gold-stained reduced SDS gels. The three commercial products were examined on separate gels; insect cell-derived untagged SerpinB1 was examined on the same gel as the GeneCopoeia preparation, but only 1/3 of the reaction was run to avoid overloading. The NE control lane is shown twice (lanes 4 and 13) in lane 10, NE was inactivated with DFP (diisopropyl fluorophosphate) prior to incubation with the serpin. Red arrows in lanes 3, 7 and 15 indicate the covalent SerpinB1-NE complex. D. Isolated islets of naive wild-type mice were stimulated with ovalbumin, insect cell derived untagged SerpinB1 or N-tagged SerpinB1 from GeneCopoeia (1µg/ml). Islets were embedded in agarose and immunostained for insulin and Ki67 and the nuclei were stained with DAPI. Quantification of Ki67+ insulin+ cells. Data represent mean ± SEM, *p < 0.05, (n= 3 per group).
Fig. 6
Fig. 6. SerpinB1 activates proteins in the growth factor signaling pathway
A. Schematic of experimental plan. Islets (100) isolated from male C57Bl/6 mice were treated for 10, 30 or 120 min (n=3) with (1 µg/ml) ovalbumin or rSerpinB1 (insect cell derived), and islet lysates were analyzed by LC-MS/MS phosphoproteomics. B. Heat map of the relative abundances of ~1,100 phosphopeptides in islets stimulated with SerpinB1 vs. ovalbumin. The relative abundances were displayed as Log2 Ratio (serpinB1/ovalbumin). C. Western blots (upper panel) and quantification (lower panel) of p-PRKAR2B/PRKAR2B in response to SerpinB1. Data represent mean ± SEM, *p < 0.05, (n= 5 per group) D. Western blots (upper panel) and quantification (lower panel) of p-GSK3/GSK3 in response to SerpinB1. Data represent mean ± SEM, *p < 0.05, (n= 5 per group). E. Western blots (upper panel) and quantification (lower panel) of p-MAPK3/MAPK3 in response to SerpinB1. Data represent mean ± SEM, *p < 0.05, (n= 5 per group). F. Glucose-stimulated insulin secretion (GSIS) in presence of vehicle, ovalbumin (1µg/ml) or rSerpinB1 (1µg/ml). Data represent mean ± SEM, **p < 0.01, (n=4 per group).

Comment in

Similar articles

Cited by

References

    1. Amrein PC, Stossel TP. Prevention of degradation of human polymorphonuclear leukocyte proteins by diisopropylfluorophosphate. Blood. 1980;56:442–447. - PubMed
    1. Andersson O, Adams BA, Yoo D, Ellis GC, Gut P, Anderson RM, German MS, Stainier DY. Adenosine signaling promotes regeneration of pancreatic beta cells in vivo. Cell metabolism. 2012;15:885–894. - PMC - PubMed
    1. Becker CE, Creagh EM, O'Neill LA. Rab39a binds caspase-1 and is required for caspase-1-dependent interleukin-1beta secretion. The Journal of biological chemistry. 2009;284:34531–34537. - PMC - PubMed
    1. Benarafa C, Remold-O'Donnell E. The ovalbumin serpins revisited: perspective from the chicken genome of clade B serpin evolution in vertebrates. Proceedings of the National Academy of Sciences of the United States of America. 2005;102:11367–11372. - PMC - PubMed
    1. Bernal-Mizrachi E, Kulkarni RN, Scott DK, Mauvais-Jarvis F, Stewart AF, Garcia-Ocana A. Human beta-cell proliferation and intracellular signaling part 2: still driving in the dark without a road map. Diabetes. 2014;63:819–831. - PMC - PubMed

Publication types