Distinct expression of interleukin (IL)-36α, β and γ, their antagonist IL-36Ra and IL-38 in psoriasis, rheumatoid arthritis and Crohn's disease
- PMID: 26701127
- PMCID: PMC4837235
- DOI: 10.1111/cei.12761
Distinct expression of interleukin (IL)-36α, β and γ, their antagonist IL-36Ra and IL-38 in psoriasis, rheumatoid arthritis and Crohn's disease
Abstract
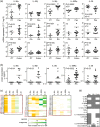
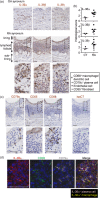
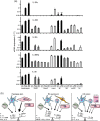
Interleukin (IL)-36α, IL-36β and IL-36γ are expressed highly in skin and are involved in the pathogenesis of psoriasis, while the antagonists IL-36Ra or IL-38, another potential IL-36 inhibitor, limit uncontrolled inflammation. The expression and role of IL-36 cytokines in rheumatoid arthritis (RA) and Crohn's disease (CD) is currently debated. Here, we observed that during imiquimod-induced mouse skin inflammation and in human psoriasis, expression of IL-36α, γ and IL-36Ra, but not IL-36β and IL-38 mRNA, was induced and correlated with IL-1β and T helper type 17 (Th17) cytokines (IL-17A, IL-22, IL-23, CCL20). In mice with collagen-induced arthritis and in the synovium of patients with RA, IL-36α, β, γ, IL-36Ra and IL-38 were all elevated and correlated with IL-1β, CCL3, CCL4 and macrophage colony-stimulating factor (M-CSF), but not with Th17 cytokines. In the colon of mice with dextran sulphate sodium-induced colitis and in patients with CD, only IL-36α, γ and IL-38 were induced at relatively low levels and correlated with IL-1β and IL-17A. We suggest that only a minor subgroup of patients with RA (17-29%) or CD (25%) had an elevated IL-36 agonists/antagonists ratio, versus 93% of patients with psoriasis. By immunohistochemistry, IL-36 cytokines were produced by various cell types in skin, synovium and colonic mucosa such as keratinocytes, CD68⁺ macrophages, dendritic/Langerhans cells and CD79α⁺ plasma cells. In primary cultures of monocytes or inflammatory macrophages (M1), IL-36β and IL-36Ra were produced constitutively, but IL-36α, γ and IL-38 were produced after lipopolysaccharide stimulation. These distinct expression profiles may help to explain why only subgroups of RA and CD patients have a potentially elevated IL-36 agonists/antagonists ratio.
Keywords: Crohn's disease; IL-36; psoriasis; rheumatoid arthritis.
© 2016 British Society for Immunology.
Figures


Similar articles
-
IL-36α from Skin-Resident Cells Plays an Important Role in the Pathogenesis of Imiquimod-Induced Psoriasiform Dermatitis by Forming a Local Autoamplification Loop.J Immunol. 2018 Jul 1;201(1):167-182. doi: 10.4049/jimmunol.1701157. Epub 2018 May 23. J Immunol. 2018. PMID: 29794016
-
Differential Expression of IL-36 Family Members and IL-38 by Immune and Nonimmune Cells in Patients with Active Inflammatory Bowel Disease.Biomed Res Int. 2018 Dec 10;2018:5140691. doi: 10.1155/2018/5140691. eCollection 2018. Biomed Res Int. 2018. PMID: 30643810 Free PMC article. Clinical Trial.
-
The novel cytokine interleukin-36α is expressed in psoriatic and rheumatoid arthritis synovium.Ann Rheum Dis. 2013 Sep 1;72(9):1569-74. doi: 10.1136/annrheumdis-2012-202264. Epub 2012 Dec 25. Ann Rheum Dis. 2013. PMID: 23268368
-
Biology of IL-36 cytokines and their role in disease.Semin Immunol. 2013 Dec 15;25(6):458-65. doi: 10.1016/j.smim.2013.11.003. Epub 2013 Dec 17. Semin Immunol. 2013. PMID: 24355486 Review.
-
IL-36, IL-37, and IL-38 Cytokines in Skin and Joint Inflammation: A Comprehensive Review of Their Therapeutic Potential.Int J Mol Sci. 2019 Mar 13;20(6):1257. doi: 10.3390/ijms20061257. Int J Mol Sci. 2019. PMID: 30871134 Free PMC article. Review.
Cited by
-
Transcriptomic Profiling of Peripheral Edge of Lesions to Elucidate the Pathogenesis of Psoriasis Vulgaris.Int J Mol Sci. 2022 Apr 30;23(9):4983. doi: 10.3390/ijms23094983. Int J Mol Sci. 2022. PMID: 35563374 Free PMC article.
-
Cytokines in the pathogenesis of rheumatoid arthritis: new players and therapeutic targets.BMC Rheumatol. 2017 Nov 28;1:3. doi: 10.1186/s41927-017-0001-8. eCollection 2017. BMC Rheumatol. 2017. PMID: 30886947 Free PMC article. Review.
-
Immune-Mediated Inflammatory Diseases and Cancer - a dangerous liaison.Front Immunol. 2024 Sep 18;15:1436581. doi: 10.3389/fimmu.2024.1436581. eCollection 2024. Front Immunol. 2024. PMID: 39359726 Free PMC article. Review.
-
IL-1 Family Antagonists in Mouse and Human Skin Inflammation.Front Immunol. 2021 Mar 16;12:652846. doi: 10.3389/fimmu.2021.652846. eCollection 2021. Front Immunol. 2021. PMID: 33796114 Free PMC article. Review.
-
IL-17A-driven psoriasis is critically dependent on IL-36 signaling.Front Immunol. 2023 Dec 11;14:1256133. doi: 10.3389/fimmu.2023.1256133. eCollection 2023. Front Immunol. 2023. PMID: 38162658 Free PMC article.
References
-
- Gabay C, Lamacchia C, Palmer G. IL‐1 pathways in inflammation and human diseases. Nat Rev Rheumatol 2010; 6:232–41. - PubMed
-
- Gabay C, Towne JE. Regulation and function of interleukin‐36 cytokines in homeostasis and pathological conditions. J Leukoc Biol 2015; 97:645–52. - PubMed
-
- Vigne S, Palmer G, Martin P et al IL‐36 signaling amplifies Th1 responses by enhancing proliferation and Th1 polarization of naive CD4+ T cells. Blood 2012; 120:3478–87. - PubMed
-
- Gunther S, Sundberg EJ. Molecular determinants of agonist and antagonist signaling through the IL‐36 receptor. J Immunol 2014; 193:921–30. - PubMed
Publication types
MeSH terms
Substances
LinkOut - more resources
Full Text Sources
Other Literature Sources
Medical
Research Materials

