. 2015 Dec 22;11(12):e1005344.
doi: 10.1371/journal.ppat.1005344. eCollection 2015 Dec.

The Epstein-Barr Virus BART miRNA Cluster of the M81 Strain Modulates Multiple Functions in Primary B Cells

Affiliations

The Epstein-Barr Virus BART miRNA Cluster of the M81 Strain Modulates Multiple Functions in Primary B Cells

Xiaochen Lin et al. PLoS Pathog. .

Abstract

The Epstein-Barr virus (EBV) is a B lymphotropic virus that infects the majority of the human population. All EBV strains transform B lymphocytes, but some strains, such as M81, also induce spontaneous virus replication. EBV encodes 22 microRNAs (miRNAs) that form a cluster within the BART region of the virus and have been previously been found to stimulate tumor cell growth. Here we describe their functions in B cells infected by M81. We found that the BART miRNAs are downregulated in replicating cells, and that exposure of B cells in vitro or in vivo in humanized mice to a BART miRNA knockout virus resulted in an increased proportion of spontaneously replicating cells, relative to wild type virus. The BART miRNAs subcluster 1, and to a lesser extent subcluster 2, prevented expression of BZLF1, the key protein for initiation of lytic replication. Thus, multiple BART miRNAs cooperate to repress lytic replication. The BART miRNAs also downregulated pro- and anti-apoptotic mediators such as caspase 3 and LMP1, and their deletion did not sensitize B-cells to apoptosis. To the contrary, the majority of humanized mice infected with the BART miRNA knockout mutant developed tumors more rapidly, probably due to enhanced LMP1 expression, although deletion of the BART miRNAs did not modify the virus transforming abilities in vitro. This ability to slow cell growth could be confirmed in non-humanized immunocompromized mice. Injection of resting B cells exposed to a virus that lacks the BART miRNAs resulted in accelerated tumor growth, relative to wild type controls. Therefore, we found that the M81 BART miRNAs do not enhance B-cell tumorigenesis but rather repress it. The repressive effects of the BART miRNAs on potentially pathogenic viral functions in infected B cells are likely to facilitate long-term persistence of the virus in the infected host.


Conflict of interest statement

The authors have declared that no competing interests exist.

Figures
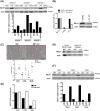
Fig 1
Fig 1. The deletion of BART miRNAs enhances BZLF1 expression in infected B cells.
(A) We performed immunoblot analyses on LCLs transformed with M81, M81/ΔAll or its revertant with antibodies specific for BZLF1 and actin. The upper picture shows the results of this assay for three different donors. The relative intensity of the signals were quantified using the ImageJ software and are given as a graph of bars. (B) A LCL transformed by M81/ΔAll was stably transfected with a plasmid that encodes a truncated form of NGFR and both BART-miRNA clusters (C1C2) or with a plasmid that encodes NGFR only (empty). After 30 days, the NGFR-positive cells were purified with a specific antibody. We determined the BART-miRNA expression in these cells relative to M81 LCL (left panel) and their BZLF1 protein expression (right panel). (C) This figure depicts the BZLF1 expression pattern in LCLs transformed by M81 or M81/ΔAll as determined by immunofluorescence staining. One staining example is shown in the top pictures, whilst the percentage of BZLF1-positive cells in LCLs from multiple B-cell donors at different days post infection (dpi) is given in the scatter plot underneath. The p values obtained from paired t tests performed with LCLs infected by the two types of virus are given. Both pictures were taken at the same magnification and replicating cells appear larger, presumably as the result of cytopathic effects induced by the lytic replication. (D) This western blot analysis was performed with protein lysates from LCLs generated with M81 or M81/ΔAll that contain the same number of BZLF1-positive cells and stained with a BZLF1-specific and an actin-specific antibody. (E) We used qPCR with a BZLF1-specfic Taqman probe to determine the BZLF1 mRNA levels in LCLs transformed with M81 and M81/ΔAll. The graph of bars shows the ratio between the expression levels in the 2 types of LCLs at different time points post-infection. (F) This immunoblot shows the variation of BZLF1 protein expression in B cells infected with wild type virus or with the BART miRNA knockout mutant over a period of 76 days. Actin staining was used as a loading control. An LCL generated with the same B cells and a virus depleted with lytic transactivators BZLF1 and BRLF1 (M81ΔZR) served as a negative control. Please also see S1, S2 and S3 Figs.
Fig 2
Fig 2. The deletion of BART miRNAs enhances virus production in infected B cells.
(A) This figure shows a western blot analysis performed a different time points on B cells from the same donor transformed with M81, M81/ΔAll or ΔZR with antibodies specific for gp350 and actin. The upper picture shows expression of gp350 and of its alternative spliced form gp220 in these LCLs. The relative intensity of the signals was quantified using the ImageJ software and is depicted in a graph of bars. (B) We generated LCLs by exposing B cells from 6 different donors to M81 or M81/ΔAll. These cells were immunostained with antibodies specific for gp350 as exemplified in the top pictures. The adjacent scatter plot shows the percentage of gp350-positive cells, including cells producing gp350 and B cells covered by virions, in these LCLs at different days post infection. The figure also shows the p values obtained from paired t tests performed with the two types of LCLs. (C) We quantified the EBV DNA load in supernatants from three couple of LCLs obtained by infection with M81 or M81/ΔAll by qPCR and show the results in this scatterplot. The p values of paired t tests performed with the different types of supernatants are indicated. (D) This graph gives the result of B-cell transformation assays that were performed by exposing primary B cells to supernatants from three different LCLs obtained with M81 or M81/ΔAll virions.
Fig 3
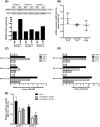
Fig 3. The miR-BART control expression of DICER and recruit BZLF1 mRNAs to the RISC.
(A) LCLs generated with B cells from independent donors exposed to M81 and M81/ΔAll were subjected to western blot analysis with an antibody specific for DICER. Actin was used as a loading control. The intensity of the observed signals was quantified with the ImageJ software. The results of this assay are shown in a graph of bars and are given relative to the expression in LCLs transformed by wild type M81. (B) We used stem loop qPCR to gauge the expression levels of cellular miRNAs in LCLs transformed by M81 or M81/ΔAll. (C and D) RISC immunoprecipitation in LCLs generated with M81 and M81/ΔAll. We measured the expression levels of the GADPH, HPRT, BZLF1, LMP1 and IPO7 mRNAs in untreated cells or after immunoprecipitation with an anti-Ago2 antibody or with a BrdU-specific antibody. The expression of HPRT, BZLF1, LMP1 and IPO7 mRNAs were first normalized to GADPH levels. Fig 3C shows the ratio of the values obtained after immunoprecipitation with the anti-Ago2 antibody with those obtained with a BrdU-specific antibody in three experiments and Fig 3D show the values of the same experiment normalized to the mRNA expression levels in untreated total mRNAs. (E) Luciferase activity assays were performed in triplicate for 2 sets of independent LCLs generated with M81 or M81/ΔAll. We cotransfected a plasmid that encodes the rat-CD2 protein together with luciferase expression plasmids. The latter included the unmodified luciferase vector (Luc2) or a luciferase expression plasmid fused with the 3’UTR of BZLF1 (Luc2-BZLF1 3UTR) or BALF5 (Luc2-BALF5 3’UTR). We performed luciferase assays 48 hours post-electroporation and the recorded values were normalized to the percentage of CD2-positive cells that had been determined by immunofluorescence staining. The graph shows the ratios of luciferase activity between M81 and M81/ΔAll LCLs for each transfected plasmid. Error bars indicate standard deviation for the values obtained in the three technical replicates. We show the results of statistical analyses performed by two-tailed student t-test (* indicates p<0.05 and ** indicates p<0.01).
Fig 4
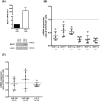
Fig 4. Replicating cells produce lower levels of EBV viral miRNAs than non-replicating counterparts.
(A) CD2-positive cells were isolated from LCLs generated with a M81 mutant that expresses a truncated form of rat CD2 behind an EA-D-responsive promoter. CD2-positive or CD2-negative cell populations were submitted to RT-qPCR to assess BZLF1 mRNA expression (top graph) and to a western blot analysis with a BZLF1-specific antibody (Bottom picture). (B) The scatter plot shows expression of 6 viral microRNAs extracted from CD2-positive or CD2-negative cell populations obtained from 6 different LCLs generated with the CD2-expressing virus. (C) The experiment described in (B) was repeated with 3 cellular miRNAs expressed in EBV-transformed B cells. P values lower than 0.05, 0.01, 0.001, and 0.0001 obtained after paired t-student tests are indicated as *, **, ***, and **** in the figure.
Fig 5
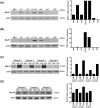
Fig 5. The miRNA subcluster1 is mainly but not exclusively responsible for the control of BZLF1 expression.
The figure shows Western blot analyses of LCLs generated with M81, M81/ΔAll, M81/ΔC1, M81/ΔC2, M81/ΔC1C2, M81/Δb2, M81/ΔZR with a BZLF1-specific antibody. The LCLs were stained at 42 (A) and 101 (B) days post-infection. The relative intensity of the signals were quantified using the ImageJ software and are also displayed as a graph of bars. One more sample is shown in S5 Fig. (C) and (D) We determined BALF5 expression level in multiple LCLs transformed with M81 and M81/ΔAll (C) and M81/Δb2 by western blot (D), and depict the results as a graph of bars after Image J quantification. All LCLs shown in (C) and (D) were investigated between 40–43 days post infection.
Fig 6
Fig 6. Deletion of the BART miRNAs enhances spontaneous lytic replication and tumor progression in the humanized mice model.
Viral titers in peripheral blood of infected mice were determined by quantitative PCR at (A) 5 weeks post-infection. (B) The pictures show tumors that developed in the spleen. Continuous tissue sections were stained with hematoxylin and eosin (H&E), immunostained with antibodies specific for BZLF1, gp350, LMP1, EBNA2, or subjected to an in situ hybridization with an EBER-specific probe. Among five M81-Wt-infected mice, 3 mice (referred to as group I) had very few whilst the other 2 mice (referred to as group II) exhibited a higher percentage of BZLF1-positive cells. (C) The number of EBER positive cells per 0.04μm2 (surface of the field at high magnification) is given in this boxplot. (D-G) The boxplots display the ratio between (D) BZLF1-, (E) gp350-, (F) LMP1-, or (G) EBNA2-positive cells versus EBER-positive cells. The data collected from the mice euthanized at week 5 are shown as open squares. (H) This graph shows the tumor incidence for humanized mice investigated in this study. We used a one-tailed Chi-square analysis in figure H and two-tailed unpaired student t test for all other results.
Fig 7
Fig 7. B cells infected by viruses that lack the BART miRNAs express higher levels of caspase 3 and LMP1 and are more resistant to drugs that induce mitochondria-mediated apoptosis.
(A) LCLs transformed by M81 or M81/ΔAll from 4 independent donors were subjected to immunoblotting with antibodies specific to viral latent proteins (EBNA3A, 3B, 3C, EBNA2, LMP1 and LMP2A), viral lytic proteins (BZLF1), caspase 3, and actin. The levels of expression of these proteins are also represented in a bar chart. (B and C) Apoptosis was induced in five pairs of LCLs transformed by M81 or M81/ΔAll. Scatter plots represent the percentage of apoptotic cells as determined by TUNEL assays (B) or by immunostaining with antibodies directed against cleaved caspase 3 (C). DMSO or ethanol-treated samples were used as controls. P values lower than 0.05 obtained after paired t-student tests are indicated. Please also refer to S7 and S8 Figs.

Similar articles

Cited by

References

    1. Kieff ED, Rickinson AB (2007) Epstein-Barr Virus and its replication In: Knipe DM HP, Griffin DE, Lamb RA, Martin MA, Roizman B, Straus SE, editor. Field Virology. Philadelphia: Lippincott Williams & Wilkins; pp. 2603–2654.
    1. Rickinson AB, Kieff E (2007) Epstein-Barr virus In: Knipe DM, Howley PM, Griffin DE, Lamb RA, Martin MA et al., editors. Fields Virology. 5th Edition ed. Philadelphia: Lippincott Williams & Wilkins; pp. 2655–2700.
    1. Pfeffer S, Zavolan M, Grasser FA, Chien M, Russo JJ, et al. (2004) Identification of virus-encoded microRNAs. Science 304: 734–736. - PubMed
    1. Grundhoff A, Sullivan CS, Ganem D (2006) A combined computational and microarray-based approach identifies novel microRNAs encoded by human gamma-herpesviruses. RNA 12: 733–750. - PMC - PubMed
    1. Cai X, Schafer A, Lu S, Bilello JP, Desrosiers RC, et al. (2006) Epstein-Barr virus microRNAs are evolutionarily conserved and differentially expressed. PLoS Pathog 2: e23 - PMC - PubMed

Publication types

Grants and funding

The study was funded by the German Cancer Research Center (DKFZ) and Inserm. XL is supported by a stipend from the Chinese Scientific council. The funders had no role in study design, data collection and analysis, decision to publish, or preparation of the manuscript.