. 2016 Feb 23;7(8):8809-22.
doi: 10.18632/oncotarget.6604.

TGF-β/Smad3 signalling regulates the transition of bone marrow-derived macrophages into myofibroblasts during tissue fibrosis

Affiliations

TGF-β/Smad3 signalling regulates the transition of bone marrow-derived macrophages into myofibroblasts during tissue fibrosis

Shuang Wang et al. Oncotarget. .

Abstract

Myofibroblasts are a main cell-type of collagen-producing cells during tissue fibrosis, but their origins remains controversial. While bone marrow-derived myofibroblasts in renal fibrosis has been reported, the cell origin and mechanisms regulating their transition into myofibroblasts remain undefined. In the present study, cell lineage tracing studies by adoptive transfer of GFP+ or dye-labelled macrophages identified that monocyte/macrophages from bone marrow can give rise to myofibroblasts via the process of macrophage-myofibroblast transition (MMT) in a mouse model of unilateral ureteric obstruction. The MMT cells were a major source of collagen-producing fibroblasts in the fibrosing kidney, accounting for more than 60% of α-SMA+ myofibroblasts. The MMT process occurred predominantly within M2-type macrophages and was regulated by TGF-β/Smad3 signalling as deletion of Smad3 in the bone marrow compartment of GFP+ chimeric mice prevented the M2 macrophage transition into the MMT cells and progressive renal fibrosis. In vitro studies in Smad3 null bone marrow macrophages also showed that Smad3 was required for TGF-β1-induced MMT and collagen production. In conclusion, we have demonstrated that bone marrow-derived fibroblasts originate from the monocyte/macrophage population via a process of MMT. This process contributes to progressive renal tissue fibrosis and is regulated by TGF-β/Smad3 signalling.

Keywords: Smad3; TGF-beta; lineage tracing; macrophage-myofibroblast transition (MMT); renal fibrosis.


Conflict of interest statement

CONFLICTS OF INTEREST

All authors declare no potential conflicts of interest.

Figures

Figure 1
Figure 1. Bone marrow-derived myofibroblasts express macrophage markers in the UUO model
(A-C) Lethally irradiated mice were reconstituted with GFP+ bone marrow cells, and 8 weeks later underwent a 7 day UUO. (A) Confocal microscopy of the contralateral control kidney shows α-SMA expression in an arteriole (red), the presence of GFP+ cells (green), and F4/80+ macrophages (blue). Note, most F4/80+ resident macrophages within the control right kidney lack GFP. (B) The obstructed kidney contains many interstitial α-SMA+ cells (red) that co-express GFP (green), and F4/80 (blue). An inset illustrating triple labelled GFP+α-SMA+F4/80+ cells are clearly shown. (C) Quantification of the cell populations in the UUO kidney based on confocal microscopy. (D) Three-color flow cytometric analysis of cells isolated from the UUO kidney showing that the majority of α-SMA+ myofibroblasts co-express the F4/80 macrophage antigen (+α-SMA+F4/80+ cells), and most of these cells also express GFP indicating a bone marrow origin. Data represent results from groups of 6 animals and each bar resents mean ± SEM. Scale bar, 20 μM.
Figure 2
Figure 2. Z-stack analysis of a single F4/80+ α-SMA+ cell undergoing the MMT process in the fibrotic kidney of UUO by confocal microscope
Z-stack analysis shows a sequence of 9 slices of the image in the Z-plane illustrating a MMT cell undergoing the MMT process by co-expressing F4/80 (green) and α-SMA (red) antigens in the UUO kidney, which is further illustrated by a video image in the Supplementary file.
Figure 3
Figure 3. Adoptive transfer identifies bone marrow macrophages as myofibroblast precursors during renal fibrosis
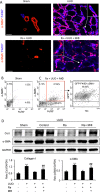
Mice underwent lethal irradiation 3 days before UUO surgery, with groups of mice either given no cells (radiation only - Ra) or receiving GFP+ bone marrow-derived macrophages (GFP+F4/80+) 1 hr after UUO surgery (radiation plus bone marrow macrophage transfer - BMT) and killed 7 days later. (A) Confocal imaging shows that bone marrow depletion by lethal irradiation prevents F4/80+ macrophage infiltration and reduces α-SMA+ myofibroblast accumulation (Ra+UUO) when compared to the UUO kidney, which is partially restored by GFP+ bone marrow macrophage transfer. An example of a GFP+α-SMA+ cell is shown in the insert. (B, C) Flow cytometry shows α-SMA and F4/80 double staining in cells isolated form sham (B) and the UUO kidney following irradiation and transfer of GFP+F4/80+ bone marrow macrophages (C). Many α-SMA+F4/80+ cells in the UUO kidney express GFP. (D) Western blotting shows increased levels of collagen I and α-SMA proteins in the UUO kidney which is reduced by lethal irradiation but partially restored by transfer of bone marrow macrophages. Graphs show quantification of Western blotting for collage I and α-SMA. Data represent results from groups of 6 animals and each bar resents mean ± SEM. *P < 0.05, compared to sham-operated mice or control cells.***P < 0.001 compared with UUO mice with irradiation. Scale bar, 20 μM.
Figure 4
Figure 4. Bone marrow macrophages that transition into myofibroblasts display a predominant M2 phenotype in the UUO kidney
Mice underwent lethal irradiation and 3 days later underwent UUO or sham surgery plus adoptive transfer of GFP+F4/80+ bone marrow cells and were killed 7 days later. (A) Flow cytometry of GFP+ cells isolated from the day 7 UUO kidney shows that most GFP+CD68+ cells express the M2 marker, CD206, while a minority express the M1 marker, CX3CR1. In contrast, few GFP+ cells were detectable in the sham-operated kidney. (B) Analysis of α-SMA+ myofibroblasts from the UUO kidney shows 80% of GFP+α-SMA+F4/80+ cells express CD206 while a small population expresses CX3CR1. (C) Analysis of collagen I producing cells from the UUO kidney shows more than 65% of collagen I+F4/80+ cells expressed CD206 while a minority expressed CX3CR1. Data represent results from 5 animals and each bar resents mean ± SEM. ***P < 0.001 as compared to controls; ***P < 0.001 versus CX3CR1+ macrophages.
Figure 5
Figure 5. Myofibroblast transition of adoptively transferred bone marrow macrophages in the UUO kidney
Dye-labelled CD11b+ bone marrow cells were transferred into mice on day 2 following UUO surgery which then were killed on day 7. (A) Confocal microscopy shows a dye-labeled macrophage cell (green) in the UUO kidney with co-expression of α-SMA (red). (B) Dye-labeled cells were isolated from day 7 UUO kidneys by fluorescence-activated cell sorting and analysed for fibrotic gene expression by real-time PCR in comparison to dye-labelled CD11b+ bone marrow cells before transfer (control). (C) A similar study using adoptive transfer of dye-labelled cells showed that bone marrow-derived macrophages following a 6 day culture with M-CSF can also home to the UUO kidney and up-regulate the same panel of myofibroblast markers. Data are from 3 groups of mice in which dye-labelled cells were isolated from 2 pooled UUO kidneys. Data are mean ± SD. *P < 0.05, **P < 0.01, ***P < 0.001 compared to control cells. Scale bar, 20 μM.
Figure 6
Figure 6. Smad3 is required for macrophage to myofibroblast transition during renal fibrosis
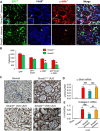
(A) Wild type mice were lethally irradiated, reconstituted with GFP+Smad3−/− or GFP+Smad3+/+ bone marrow cells and 8 weeks later underwent UUO and were killed 7 days later. Confocal microscopy showing GFP+ cells (green), α-SMA+ (red, myofibroblasts) and F4/80+ (blue, macrophages). GFP+Smad3+/+ reconstituted mice show numerous infiltrating GFP+ cells in the UUO kidney, many of which co-express F4/80 and α-SMA (example in inset). While many GFP+ and F4/80+ cells are seen in the UUO kidney in mice reconstituted with GFP+Smad3−/− bone marrow, there is a marked reduction in GFP+α-SMA+F4/80+ cells. (B) Quantification of confocal microscopy analysis in the UUO kidney (n = 6). (C) Collagen I immunohistochemistry staining of kidney sections. (D and E) Real time PCR analysis is shown for; (D) α-SMA, and (E) collagen I, mRNA levels. Bars represent mean ± SEM for 6 mice. *P < 0.05, **P < 0.01, ***P < 0.001 versus sham-control; *P < 0.05, **P < 0.01, ***P < 0.001 as indicated. Scale bar, 50 μM.
Figure 7
Figure 7. Smad3 is required for macrophage to myofibroblast transition in vitro
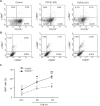
(A) F4/80+ cells were isolated from the bone marrow of wild type (S3WT) or Smad3−/− (S3KO) mice by fluorescence-activated cell sorting and cultured with M-CSF (50 ng/ml) for 3 or 7 days in the presence or absence of TGF-β1 (5 ng/ml) to induce transition. Immunofluorescence staining for CD68 (green) and α-SMA (red) with nuclear DAPI (blue) counterstain identified CD68+α-SMA+ cells following TGF-β1 stimulation, which is prominent in S3WT cells but not in S3KO cells. A high power view of a Smad3 WT bone marrow macrophage in transition is shown. A graph shows quantification of the immunofluorescence staining. (B) Two-color flow cytometry identified a time-dependent increase in the percentage of F4/80+α-SMA+ cells following TGF-β1 stimulation in Smad3+/+ bone marrow macrophages which is substantially reduced in Smad3−/− macrophages. A graph shows quantification of the flow cytometry analysis. Data represent results from 4 independent in vitro experiments and each bar resents mean ± SEM. **P < 0.01, ***P < 0.001 compared to control cells (CTL); *P < 0.05, ***P < 0.01, ***P < 0.001 versus Smad3 WT macrophages. Scale bar, 50 mM.
Figure 8
Figure 8. Smad3 is Required for Collagen Production by Transformed Macrophages in vitro
(A) F4/80+ cells were isolated from the bone marrow of wild type (S3WT) or Smad3−/− (S3KO) mice and cultured with M-CSF (50ng/ml) for 3 or 7 days in the presence or absence of TGF-β1 (5 ng/ml) to induce transition. Two-colour immunostaining showed collagen I (red) producing macrophages (CD68+, green) following TGF-β1 stimulation were much more prominent in Smad3+/+ cells compared to Smad3−/− cells. A graph shows quantification of the immunofluorescence staining. (B) An example of a collagen-producing macrophage identified by three-color confocal microscopy featuring polarization with de novo peripheral α-SMA+ actin localization and characteristic head-end, back-end formation. Data represent results from 4 independent in vitro experiments and each bar resents mean ± SEM. ***P < 0.001 compared to control cells (CTL); ***P < 0.01, ***P < 0.001 versus Smad3 WT macrophages. Scale bar, 50 μM.
Figure 9
Figure 9. In vitro bone marrow macrophages undergoing myofibroblast transition have a predominant M2 phenotype
F4/80+ cells were isolated from bone marrow and cultured with M-CSF (50 ng/ml) in the presence or absence of TGF-β1 (5 ng/ml) for 3 or 7 days. Flow cytometry identified de novo expression of α-SMA in a subset of cultured F4/80+ macrophages. The majority of α-SMA+ macrophages co-expressed the M2 marker CD206 (> 70%), with a minority expressing the M1 marker, CX3CR1. Data represent results from 5 animals or 4 independent in vitro experiments and each bar resents mean ± SEM. **P < 0.01, ***P < 0.001 as compared to control cells (CTL); **P < 0.01,***P < 0.001 versus CX3CR1+ macrophages.
Figure 10
Figure 10. Schematic Diagram of Macrophage-Myofibroblast Transition (MMT) in Tissue Fibrosis
Hematopoietic stem cells (HSC) can differentiate into monocytes in the bone marrow. Blood monocytes entering the injured tissue can differentiate into an M2 pro-fibrotic phenotype, either directly or via an M1 pro-inflammatory phenotype. TGF-β/Smad3 signalling then drives macrophage transition into collagen-producing α-SMA+ myofibroblasts via the process of MMT.

Similar articles

Cited by

References

    1. Meng XM, Nikolic-Paterson DJ, Lan HY. Inflammatory processes in renal fibrosis. Nat Rev Nephrol. 2014;10:493–503. - PubMed
    1. Hewitson TD. Renal tubulointerstitial fibrosis: common but never simple. Am J Physiol Renal Physiol. 2009;296:F1239–1244. - PubMed
    1. Klingberg F, Hinz B, White ES. The myofibroblast matrix: implications for tissue repair and fibrosis. J Pathol. 2013;229:298–309. - PMC - PubMed
    1. Mack M, Yanagita M. Origin of myofibroblasts and cellular events triggering fibrosis. Kidney Int. 2015;87:297–307. - PubMed
    1. Jinde K, Nikolic-Paterson DJ, Huang XR, Sakai H, Kurokawa K, Atkins RC, Lan HY. Tubular phenotypic change in progressive tubulointerstitial fibrosis in human glomerulonephritis. Am J Kid Dis. 2001;38:761–769. - PubMed

Publication types

MeSH terms