

Immunological evidence and regulatory potential for cell-penetrating antibodies in intravenous immunoglobulin
- PMID: 26682050
- PMCID: PMC4673440
- DOI: 10.1038/cti.2015.18
Immunological evidence and regulatory potential for cell-penetrating antibodies in intravenous immunoglobulin
Abstract
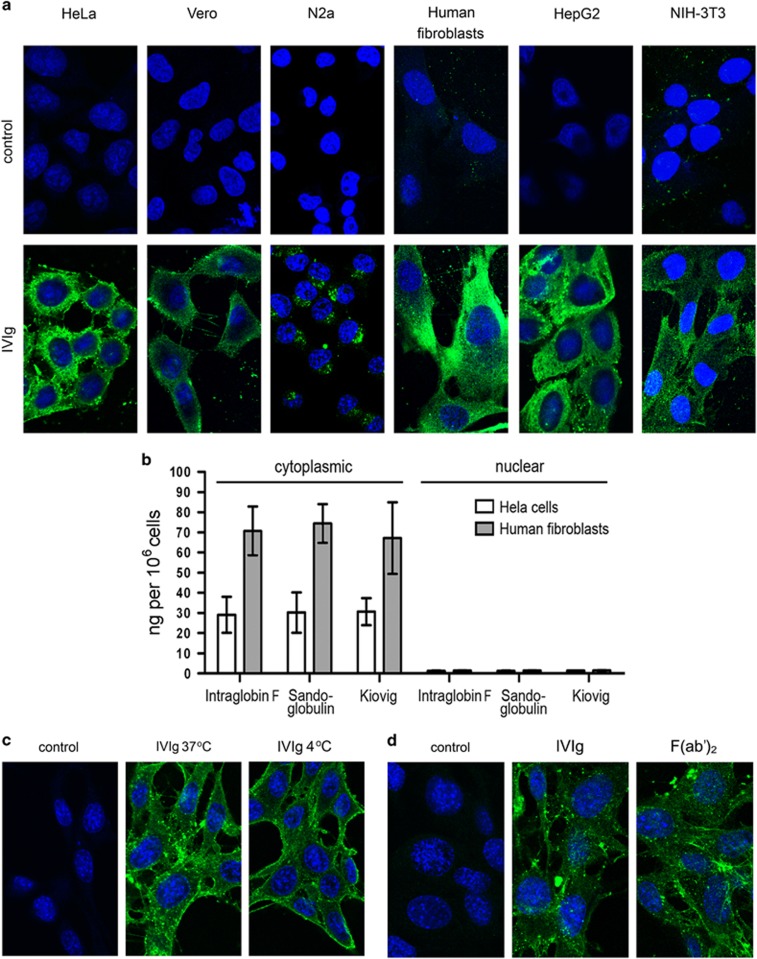
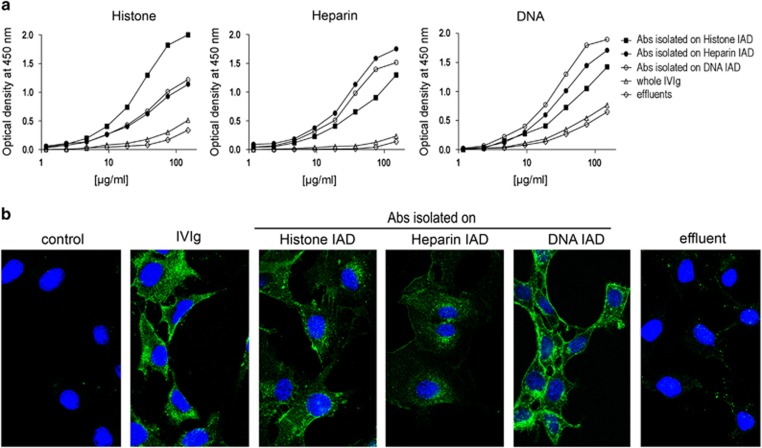
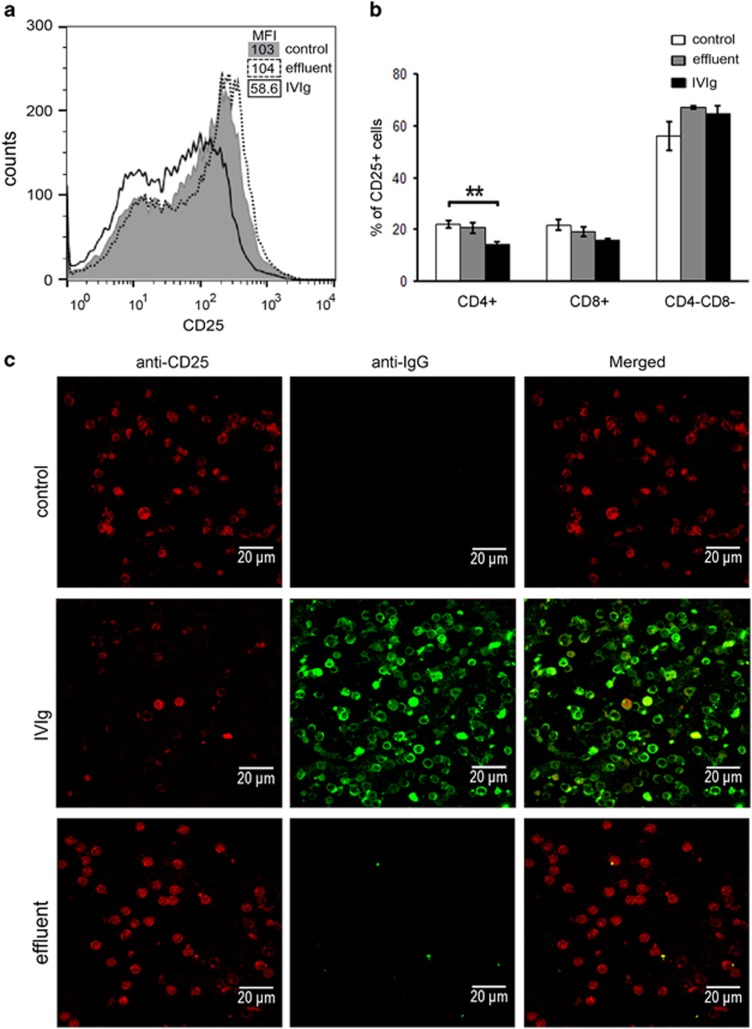
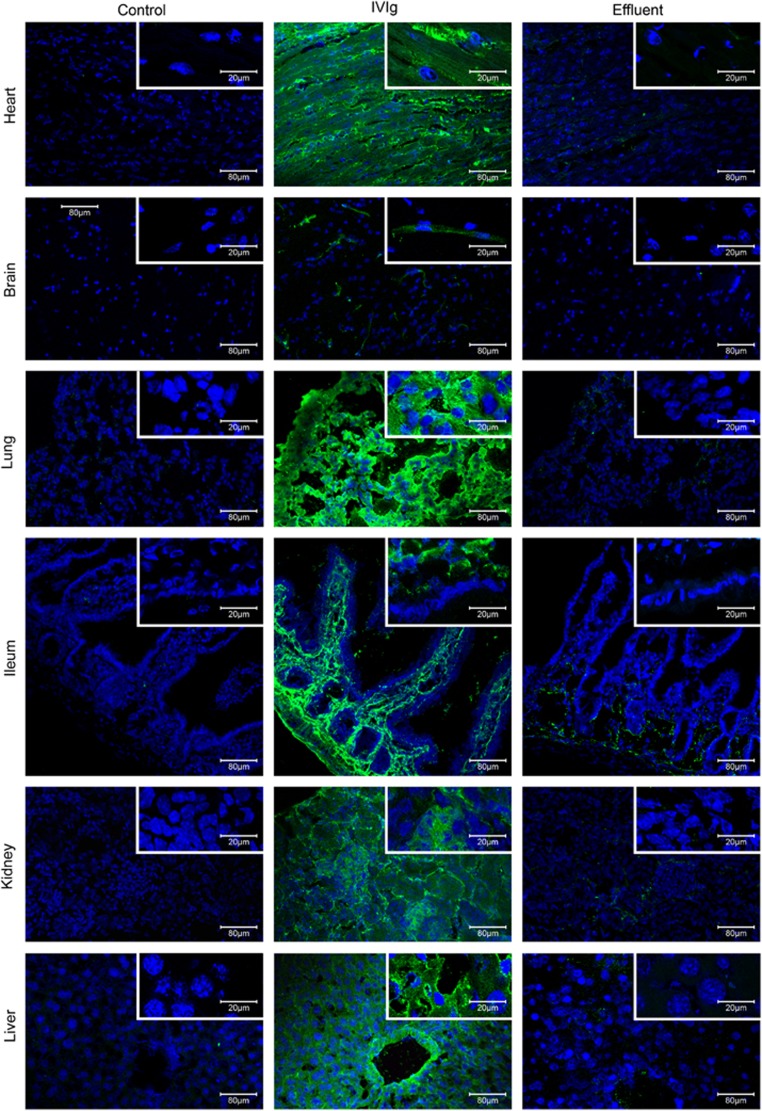
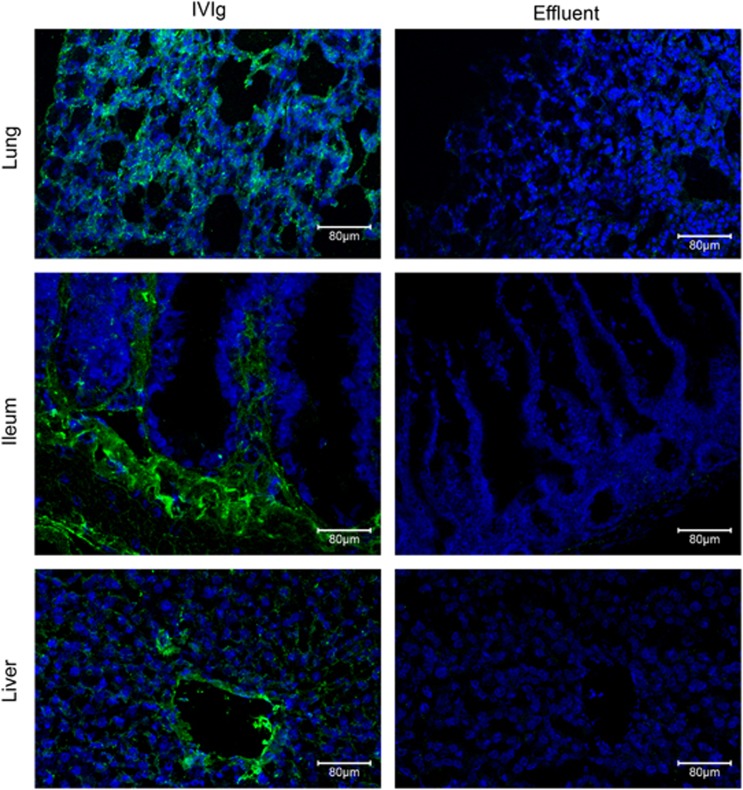
Anti-DNA cell-penetrating autoantibodies have been extensively studied in autoimmune but not in normal sera. We investigated herein the presence and properties of cell-penetrating antibodies (CPAbs) in intravenous immunoglobulin (IVIg), a blood product of pooled normal human IgG. IVIg cell penetration was observed into various cell lines, as well as cells from several organs of mice injected intravenously with IVIg therapeutic dose. In all cell types examined in vitro and in vivo, intracellular IgG localized in the cytoplasm, in contrast to the nuclear accumulation of disease-related CPAbs. IVIg was found to rapidly enter cells via an energy-independent mode. The CPAb-fraction was isolated and found to be polyreactive to nuclear and cytoplasmic components; although it corresponded to ~2% of IVIg, it accounted for its inhibitory effect on splenocyte activation. Investigation of IVIg cell penetration capacity provides insight into its mechanisms of action and may account for some of its beneficial effects in numerous diseases.
Figures
Similar articles
-
DNA-histone complexes as ligands amplify cell penetration and nuclear targeting of anti-DNA antibodies via energy-independent mechanisms.Immunology. 2016 Jan;147(1):73-81. doi: 10.1111/imm.12542. Epub 2015 Nov 24. Immunology. 2016. PMID: 26447818 Free PMC article.
-
Facing the enigma of immunomodulatory effects of intravenous immunoglobulin.Clin Rev Allergy Immunol. 2005 Dec;29(3):185-99. doi: 10.1385/CRIAI:29:3:185. Clin Rev Allergy Immunol. 2005. PMID: 16391393 Review.
-
Novel cross-reactive anti-idiotype antibodies with properties close to the human intravenous immunoglobulin (IVIg).Hybridoma. 1999 Jun;18(3):263-72. doi: 10.1089/027245799315925. Hybridoma. 1999. PMID: 10475241
-
Antiidiotypes against autoantibodies in pooled normal human polyspecific Ig.J Immunol. 1989 Dec 15;143(12):4104-9. J Immunol. 1989. PMID: 2592768
-
Normal polyspecific immunoglobulin G (IVIg) in the treatment of autoimmune diseases.J Autoimmun. 1993 Dec;6(6):675-81. doi: 10.1006/jaut.1993.1056. J Autoimmun. 1993. PMID: 8155249 Review.
Cited by
-
Allergen-specific IgG as a mediator of allergy inhibition: Lessons from mother to child.Hum Vaccin Immunother. 2017 Mar 4;13(3):507-513. doi: 10.1080/21645515.2016.1244592. Epub 2016 Nov 3. Hum Vaccin Immunother. 2017. PMID: 27808600 Free PMC article. Review.
-
Elevated Autoantibodies in Subacute Human Spinal Cord Injury Are Naturally Occurring Antibodies.Front Immunol. 2018 Oct 11;9:2365. doi: 10.3389/fimmu.2018.02365. eCollection 2018. Front Immunol. 2018. PMID: 30364218 Free PMC article.
-
Unconventional Role of Caspase-6 in Spinal Microglia Activation and Chronic Pain.Mediators Inflamm. 2017;2017:9383184. doi: 10.1155/2017/9383184. Epub 2017 Feb 7. Mediators Inflamm. 2017. PMID: 28270702 Free PMC article. Review.
-
Low doses of IgG from atopic individuals can modulate in vitro IFN-γ production by human intra-thymic TCD4 and TCD8 cells: An IVIg comparative approach.Hum Vaccin Immunother. 2017 Jul 3;13(7):1563-1572. doi: 10.1080/21645515.2017.1299299. Epub 2017 Apr 25. Hum Vaccin Immunother. 2017. PMID: 28441069 Free PMC article.
-
Distinct variations of antibody secreting cells and memory B cells during the course of Kawasaki disease.BMC Immunol. 2019 Jun 3;20(1):16. doi: 10.1186/s12865-019-0299-7. BMC Immunol. 2019. PMID: 31159728 Free PMC article.
References
-
- 2Golan TD, Gharavi AE, Elkon KB. Penetration of autoantibodies into living epithelial cells. J Invest Dermatol 1993; 100: 316–322. - PubMed
-
- 4Vlahakos D, Foster MH, Ucci AA, Barrett KJ, Datta SK, Madaio MP. Murine monoclonal anti-DNA antibodies penetrate cells, bind to nuclei, and induce glomerular proliferation and proteinuria in vivo. J Am Soc Nephrol 1992; 2: 1345–1354. - PubMed
-
- 5Ruiz-Arguelles A, Alarcon-Segovia D. Penetration of autoantibodies into living cells, 2000. Isr Med Assoc J 2001; 3: 121–126. - PubMed
LinkOut - more resources
Full Text Sources
Other Literature Sources