. 2015 Dec 16;90(5):2403-17.
doi: 10.1128/JVI.02749-15.

Hemagglutinin of Influenza A Virus Antagonizes Type I Interferon (IFN) Responses by Inducing Degradation of Type I IFN Receptor 1

Affiliations

Hemagglutinin of Influenza A Virus Antagonizes Type I Interferon (IFN) Responses by Inducing Degradation of Type I IFN Receptor 1

Chuan Xia et al. J Virol. .

Abstract

Influenza A virus (IAV) employs diverse strategies to circumvent type I interferon (IFN) responses, particularly by inhibiting the synthesis of type I IFNs. However, it is poorly understood if and how IAV regulates the type I IFN receptor (IFNAR)-mediated signaling mode. In this study, we demonstrate that IAV induces the degradation of IFNAR subunit 1 (IFNAR1) to attenuate the type I IFN-induced antiviral signaling pathway. Following infection, the level of IFNAR1 protein, but not mRNA, decreased. Indeed, IFNAR1 was phosphorylated and ubiquitinated by IAV infection, which resulted in IFNAR1 elimination. The transiently overexpressed IFNAR1 displayed antiviral activity by inhibiting virus replication. Importantly, the hemagglutinin (HA) protein of IAV was proved to trigger the ubiquitination of IFNAR1, diminishing the levels of IFNAR1. Further, influenza A viral HA1 subunit, but not HA2 subunit, downregulated IFNAR1. However, viral HA-mediated degradation of IFNAR1 was not caused by the endoplasmic reticulum (ER) stress response. IAV HA robustly reduced cellular sensitivity to type I IFNs, suppressing the activation of STAT1/STAT2 and induction of IFN-stimulated antiviral proteins. Taken together, our findings suggest that IAV HA causes IFNAR1 degradation, which in turn helps the virus escape the powerful innate immune system. Thus, the research elucidated an influenza viral mechanism for eluding the IFNAR signaling pathway, which could provide new insights into the interplay between influenza virus and host innate immunity.

Importance: Influenza A virus (IAV) infection causes significant morbidity and mortality worldwide and remains a major health concern. When triggered by influenza viral infection, host cells produce type I interferon (IFN) to block viral replication. Although IAV was shown to have diverse strategies to evade this powerful, IFN-mediated antiviral response, it is not well-defined if IAV manipulates the IFN receptor-mediated signaling pathway. Here, we uncovered that influenza viral hemagglutinin (HA) protein causes the degradation of type I IFN receptor subunit 1 (IFNAR1). HA promoted phosphorylation and polyubiquitination of IFNAR1, which facilitated the degradation of this receptor. The HA-mediated elimination of IFNAR1 notably decreased the cells' sensitivities to type I IFNs, as demonstrated by the diminished expression of IFN-induced antiviral genes. This discovery could help us understand how IAV regulates the host innate immune response to create an environment optimized for viral survival in host cells.


Figures

FIG 1
FIG 1
IAV induces the degradation of IFNAR1. (A to E) HEK293 cells (A), A549 cells (B), Vero cells (C), human DCs (D), and MEF cells (E) were uninfected (Mock) or infected with influenza A/WSN/33 (H1N1) virus (IAV) at an MOI of 1 for the indicated times. The levels of IFNAR1, viral NP, and viral NS1 were analyzed by Western blotting. The levels of GAPDH were used as an internal loading control. The relative intensities for each band of IFNAR1 were determined based on the GAPDH levels by densitometry and depicted below each blot. The relative levels of IFNAR1 from uninfected samples were set as 1.0. MW, molecular weights in thousands. (F) HEK293 cells were either left uninfected (shaded area) or infected with IAV at an MOI of 1. At 12 hpi (dashed line) or 24 hpi (solid line), cells were left unstained (dotted line) or stained with PE-conjugated antibody against IFNAR1. The surface expression levels of IFNAR1 were assessed by flow cytometry. The mean fluorescence intensity (MFI) of each sample is shown. Similar results were obtained from three independent experiments. (G) HEK293 cells were left uninfected or infected with IAV at an MOI of 1. The relative mRNA levels of IFNAR1 and viral NP were analyzed by real-time qPCR at 8 and 24 hpi. Error bars represent means ± standard deviations calculated from three reactions per sample. ns, not significant. (H) HEK293 cells were uninfected or infected with IAV at an MOI of 1. At 8 hpi, the cells were treated with solvent or cycloheximide (CHX, 50 μg/ml) for 0 to 4 h as indicated. The levels of IFNAR1, viral NS1, and GAPDH were analyzed by Western blotting. The relative intensities for each band of IFNAR1 are shown.
FIG 2
FIG 2
IAV infection induces the phosphorylation and ubiquitination of IFNAR1. (A) HEK293 cells were transfected with FLAG-tagged IFNAR1 (FLAG-IFNAR1) or control vector and HA-tagged ubiquitin (tHA-Ub). At 24 h posttransfection, cells were left uninfected or infected with IAV at an MOI of 1 as indicated for an additional 18 h. Cell lysates were subjected to a denatured IP experiment. The phosphorylation and ubiquitination of immunoprecipitated FLAG-IFNAR1 were analyzed by Western blotting using anti-HA tag (tHA) and anti-pIFNAR1 (S535/539) antibodies. The levels of tHA-Ub, viral HA, and GAPDH in the whole-cell lysates were also analyzed (lower panels). (B) HEK293 cells were transfected with the indicated plasmids encoding FLAG-IFNAR1 or HA-tagged wild-type (WT) ubiquitin (tHA-Ub) or ubiquitin mutants (tHA-Ub-K48 or tHA-Ub-K63). The infection and IP followed by Western blotting were performed as described for panel A to detect the ubiquitination and basal levels of FLAG-IFNAR1. The expressions of ubiquitin in the whole-cell lysates are shown in the lower panel. (C) HEK293 cells were transfected with plasmids encoding either IFNAR1-WT or IFNAR1-S535/539A, which is the phosphorylation-incompetent mutant. At 24 h posttransfection, cells were uninfected or infected with IAV at an MOI of 1 for 24 h. The expression levels of IFNAR1, influenza viral NP, and GAPDH were assessed by Western blotting. MW, molecular weights in thousands.
FIG 3
FIG 3
Rescuing IFNAR1 expression inhibits IAV replication. (A) HEK293 cells were infected with IAV at an MOI of 1 and cultured in the presence or absence of MG132. At 24 hpi, the levels of IFNAR1, viral M2, and GAPDH were analyzed by Western blotting. (B to D) HEK293 cells were transfected with control vector (−) or plasmid encoding FLAG-IFNAR1. At 24 h posttransfection, cells were infected with IAV at an MOI of 1. Western blot analysis was performed at 12 hpi to analyze the expression levels of NS1, NP, IFNAR1, and GAPDH (B). At 24 hpi, the infectious IAV production in the supernatant of the culture was assessed by using plaque assay on MDCK cells (C) (n = 3/group; **, P ≤ 0.01). The expression of pSTAT1, STAT1, pSTAT2, STAT2, ISG56, OAS1, and GAPDH was analyzed at 24 hpi (D). (E) HEK293 cells were transfected with a control vector (CTR) or plasmids encoding FLAG-tagged IFNAR1-WT or IFNAR1-S535/539A. At 24 h posttransfection, cells were infected with IAV at an MOI of 0.02. Western blot analysis was performed at 60 hpi to analyze the expression levels of NS1, NP, IFNAR1, and GAPDH. (F) HEK293 cells were transfected with control vector (CTR) or plasmid encoding FLAG-tagged IFNAR1-WT or IFNAR1-S535/539A. At 48 h posttransfection, cells were infected with IAV at an MOI of 0.1. The titer of infectious IAV in the supernatants of the culture was assessed by plaque assay on MDCK cells at 60 hpi (n = 4/group; *, P ≤ 0.05; **, P ≤ 0.01; ****, P ≤ 0.0001). MW, molecular weights in thousands.
FIG 4
FIG 4
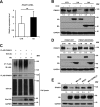
Influenza viral HA negatively regulates IFNAR1 expression. (A) HEK293 cells were transfected with a control vector (CTR) or plasmids encoding NS1 of influenza A/Puerto Rico/8/34 (H1N1) virus, HA of influenza A/New Caledonia/20/99 (H1N1) virus, which was used for the majority of HA transient expression experiments unless indicated otherwise, or NA of influenza A/Thailand/1(KAN-1)/2004 (H5N1) virus. At 24 h posttransfection, the levels of IFNAR1, NS1, HA, NA, and GAPDH were analyzed by Western blotting. (B) HEK293 cells were transfected with a control vector (CTR) or increasing doses of HA-encoding plasmids (125, 250, 500, or 1,000 ng/ml). Twenty-four hours posttransfection, Western blot analysis was performed to detect the levels of IFNAR1, HA, and GAPDH. (C) HEK293 cells were transfected with a control plasmid (CTR) (shaded area) or plasmids encoding HA (solid line), NA (short dashed line), or NS1 (long dashed line). At 24 h posttransfection, cells were left unstained (dotted line) or stained with PE-conjugated antibody against IFNAR1. The levels of IFNAR1 on the surface of cells were assessed by flow cytometry. The MFIs are shown. (D) MEF cells were transfected with a control vector (CTR), HA (0.5 or 1.0 μg/ml), or NA (1.0 μg/ml). Twenty-four hours later, Western blot analysis was conducted to detect IFNAR1, HA, NA, and GAPDH proteins. The experiment was repeated three times with similar results. (E) HEK293 cells were transfected with a control vector (CTR) or plasmids encoding HA proteins from different strains of IAV (as indicated in the bottom panel, no. 1 to 3). The levels of IFNAR1, HA, and GAPDH were analyzed 24 h after transfection by Western blotting. The relative intensities for each band of IFNAR1 were determined based on the GAPDH level by densitometry and are depicted below each blot. The relative level of IFNAR1 protein from the control vector transfected sample was set as 1.0. (F) HEK293 cells were transfected with control vector (CTR) or plasmids encoding Myc-tagged HA1 or Myc-tagged HA2. The levels of IFNAR1, Myc-HA1, Myc-HA2, and GAPDH were analyzed by Western blotting. MW, molecular weights in thousands.
FIG 5
FIG 5
Influenza HA targets IFNAR1 for degradation. (A) HEK293 cells were transfected with a control vector (CTR) or HA. The mRNA levels of IFNAR1 were analyzed by real-time qPCR at 24 h posttransfection. Error bars represent standard deviations assessed from three independent experiments. (B) HEK293 cells were transfected with a control vector (CTR), HA, or NA as indicated. At 16 h posttransfection, cells were treated with solvent or CHX at a concentration of 50 μg/ml for 3 h. The levels of IFNAR1, HA, NA, and GAPDH were analyzed by Western blotting. The relative intensities for each band of IFNAR1 were determined based on the GAPDH levels by densitometry and are depicted below each blot. (C) HEK293 cells were transfected with FLAG-IFNAR1 or control vector and tHA-Ub. At 24 h after transfection, cells were transfected with either a control vector (CTR) or two doses (250 and 500 ng/ml) of HA as indicated. Cells were incubated for an additional 16 h. The levels of ubiquitination of FLAG-IFNAR1 were analyzed by IP followed by Western blotting with anti-tHA antibody. The whole-cell lysates were analyzed to measure the levels of IFNAR1, tHA-Ub viral HA, and GAPDH, which are shown in the lower panels. (D) HEK293 cells were transfected with HA or NA and plasmids encoding either IFNAR1-WT or IFNAR1-S535/539A. At 24 h posttransfection, the whole-cell lysates from each sample were analyzed by Western blotting to detect IFNAR1, HA, NA, and GAPDH. The relative intensities for each band of IFNAR1 were determined based on the GAPDH level and are depicted below each blot. (E) HEK293 cells were transfected with a control vector (CTR) or HA as indicated. At 18 h posttransfection, cells were treated with the indicated inhibitor(s) or solvent (dimethyl sulfoxide [DMSO]) for an additional 6 h. The levels of IFNAR1, HA, and GAPDH were evaluated by Western blotting. The relative intensities for each band of IFNAR1 were determined based on the GAPDH level by densitometry. MW, molecular weights in thousands.
FIG 6
FIG 6
HA does not interact with IFNAR1 and causes no activation of the ER stress response for IFNAR1 degradation. (A) HEK293 cells were transfected with Myc-tagged HA and either a control vector (−) or FLAG-tagged IFNAR1 (FLAG-IFNAR1). Co-IP was conducted by using anti-FLAG affinity resin, and anti-TYK2 and anti-Myc antibodies were used to detect endogenous TYK2 and Myc-tagged HA, respectively. The levels of Myc-HA, TYK2, and GAPDH in the whole-cell lysates were also detected by Western blotting (lower panel). (B) HEK293 cells were transfected with a control vector (CTR) or increasing doses of HA-encoding plasmids (250, 500, or 1,000 ng/ml). At 24 h posttransfection, cells were harvested to detect the levels of IFNAR1, HA, pelF2α, elF2α, and GAPDH by Western blotting. (C, D) HEK293 cells were transfected with a control vector (CTR) or HA. The mRNA expression levels of GADD34 (C) and CHOP (D) were analyzed by real-time qPCR at 24 h posttransfection. Error bars represent standard deviations calculated from three reactions per sample. ns, not significant. (E) HEK293 cells were transfected with control plasmid (CTR) or HA. At 3, 6, 12, and 24 h posttransfection, cells were harvested to assess the levels of IFNAR1, pERK, ERK, p-p38, p38, HA, and GAPDH by Western blotting. MW, molecular weights in thousands.
FIG 7
FIG 7
Influenza viral HA makes cells less responsive to type I IFNs. (A) HEK293 cells were transfected with a control vector (CTR) or HA as indicated. At 18 h posttransfection, cells were treated with solvent (DMSO) or MG132/NH4Cl as indicated for an additional 6 h. Cells were then left untreated or treated with recombinant human IFN-α (rIFN-α, 100 U/ml) for the indicated time. The levels of pSTAT1, pSTAT2, STAT1, STAT2, IFNAR1, HA, and GAPDH were analyzed by Western blotting. The relative intensities for each band of pSTAT1 and pSTAT2 were determined based on the GAPDH level by densitometry. The level of pSTAT1 and pSTAT2 from the control vector-transfected sample with the treatment of rIFN-α for 60 min was set as 1.0. (B) HEK293 cells were cotransfected with ISRE promoter-luciferase reporter plasmid, Renilla luciferase plasmid, and either a control vector (CTR) or plasmid encoding HA. At 24 h posttransfection, cells were left untreated (−) or treated with rIFN-α (20 U/ml or 100 U/ml) for 24 h. Cells were then analyzed for the relative luciferase activity (Luc. Act.). Error bars represent standard deviations derived from three samples per group (***, P ≤ 0.001; ****, P ≤ 0.0001). (C, D, E, and F) HEK293 cells were transfected with control vector (CTR) or plasmids encoding HA of influenza A/Thailand/1(KAN-1)/2004 (H5N1) virus. At 24 h posttransfection, cells were left untreated (−) or treated with rIFN-α at a concentration of 1,000 U/ml. The relative mRNA expression levels of ISG15 (C), ISG56 (D), Mx1 (E), and OAS1 (F) were analyzed by real-time qPCR at 24 h posttreatment. Error bars represent standard deviations derived from three reactions per sample. (G) HEK293 cells were transfected with a control vector (CTR) or HA as indicated. At 24 h posttransfection, cells were left untreated or treated with rIFN-α at the indicated concentrations for the following 24 h. The protein levels of ISG56, ISG15, IFNAR1, HA, and GAPDH were assessed by Western blotting. (H) HEK293 cells were transfected with a control vector (CTR) or plasmids encoding HA of influenza A/Thailand/1(KAN-1)/2004 (H5N1) virus as indicated. At 24 h posttransfection, cells were left untreated or treated with rIFN-α at the indicated concentrations for the following 24 h. The protein levels of ISG56, IFNAR1, HA, and GAPDH were assessed by Western blotting. (I) HEK293 cells were supplied with rIFN-β in the presence or absence of HA. The expression of ISG56, IFNAR1, HA, and GAPDH was analyzed as described for panel H. MW, molecular weights in thousands.

Similar articles

Cited by

References

    1. D'Mello T, Brammer L, Blanton L, Kniss K, Smith S, Mustaquim D, Steffens C, Dhara R, Cohen J, Chaves SS, Finelli L, Bresee J, Wallis T, Xu X, Abd Elal AI, Gubareva L, Wentworth D, Villanueva J, Katz J, Jernigan D, Centers for Disease Control and Prevention. 2015. Update: influenza activity—United States, September 28, 2014-February 21, 2015. MMWR Morb Mortal Wkly Rep 64:206–212. - PMC - PubMed
    1. Claas EC, Osterhaus AD, van Beek R, De Jong JC, Rimmelzwaan GF, Senne DA, Krauss S, Shortridge KF, Webster RG. 1998. Human influenza A H5N1 virus related to a highly pathogenic avian influenza virus. Lancet 351:472–477. doi:10.1016/S0140-6736(97)11212-0. - DOI - PubMed
    1. Chen H, Deng G, Li Z, Tian G, Li Y, Jiao P, Zhang L, Liu Z, Webster RG, Yu K. 2004. The evolution of H5N1 influenza viruses in ducks in southern China. Proc Natl Acad Sci U S A 101:10452–10457. doi:10.1073/pnas.0403212101. - DOI - PMC - PubMed
    1. Cowling BJ, Jin L, Lau EH, Liao Q, Wu P, Jiang H, Tsang TK, Zheng J, Fang VJ, Chang Z, Ni MY, Zhang Q, Ip DK, Yu J, Li Y, Wang L, Tu W, Meng L, Wu JT, Luo H, Li Q, Shu Y, Li Z, Feng Z, Yang W, Wang Y, Leung GM, Yu H. 2013. Comparative epidemiology of human infections with avian influenza A H7N9 and H5N1 viruses in China: a population-based study of laboratory-confirmed cases. Lancet 382:129–137. doi:10.1016/S0140-6736(13)61171-X. - DOI - PMC - PubMed
    1. Bouvier NM, Palese P. 2008. The biology of influenza viruses. Vaccine 26(Suppl 4):D49–D53. doi:10.1016/j.vaccine.2008.07.039. - DOI - PMC - PubMed

Publication types

Substances

LinkOut - more resources