. 2016 Jan 15;76(2):440-52.
doi: 10.1158/0008-5472.CAN-15-1640-T. Epub 2015 Dec 16.

Treatment of Triple-Negative Breast Cancer with TORC1/2 Inhibitors Sustains a Drug-Resistant and Notch-Dependent Cancer Stem Cell Population

Affiliations

Treatment of Triple-Negative Breast Cancer with TORC1/2 Inhibitors Sustains a Drug-Resistant and Notch-Dependent Cancer Stem Cell Population

Neil E Bhola et al. Cancer Res. .

Erratum in

Abstract

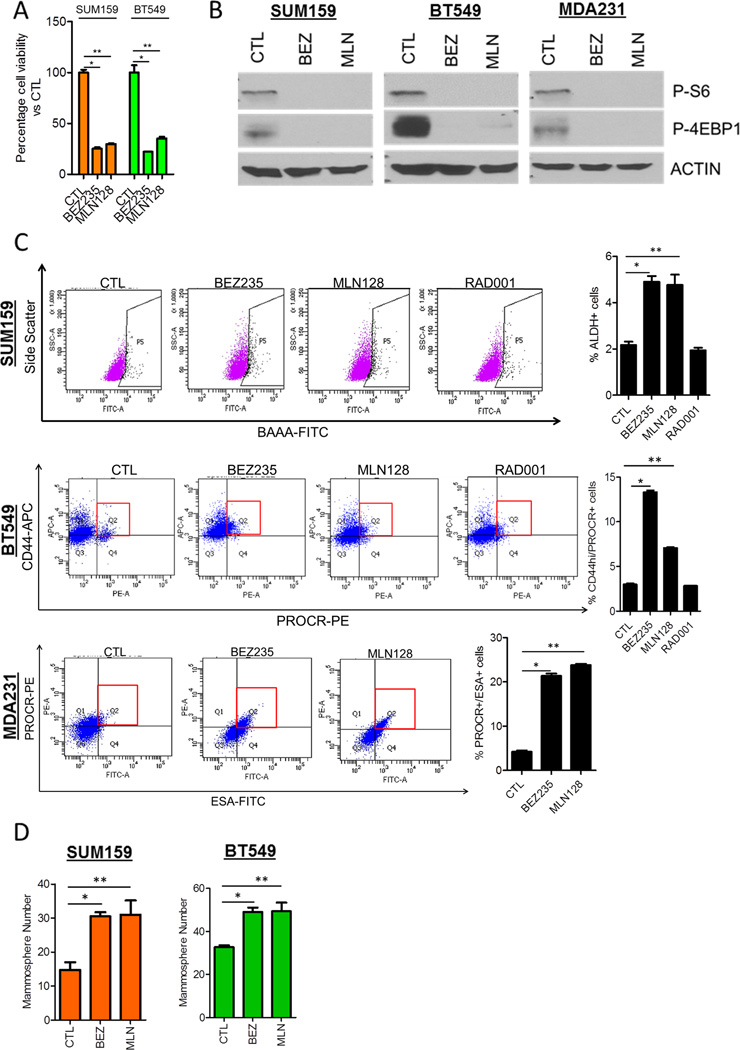
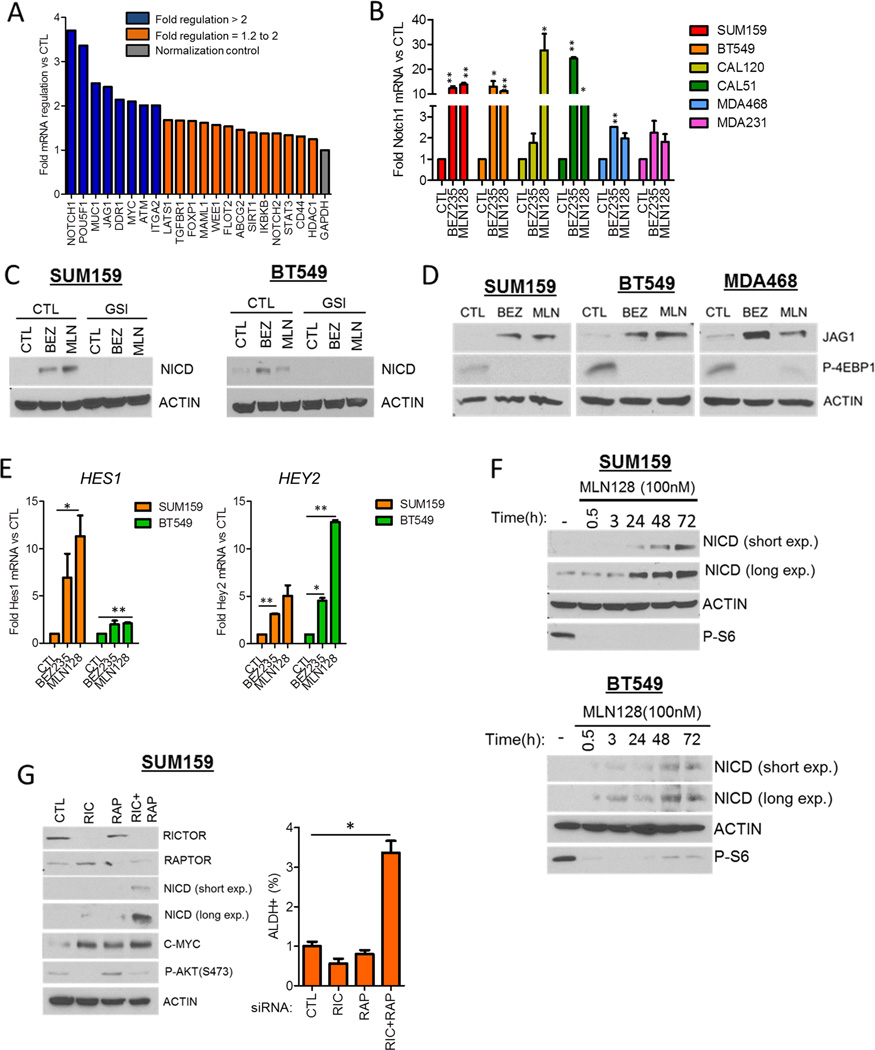
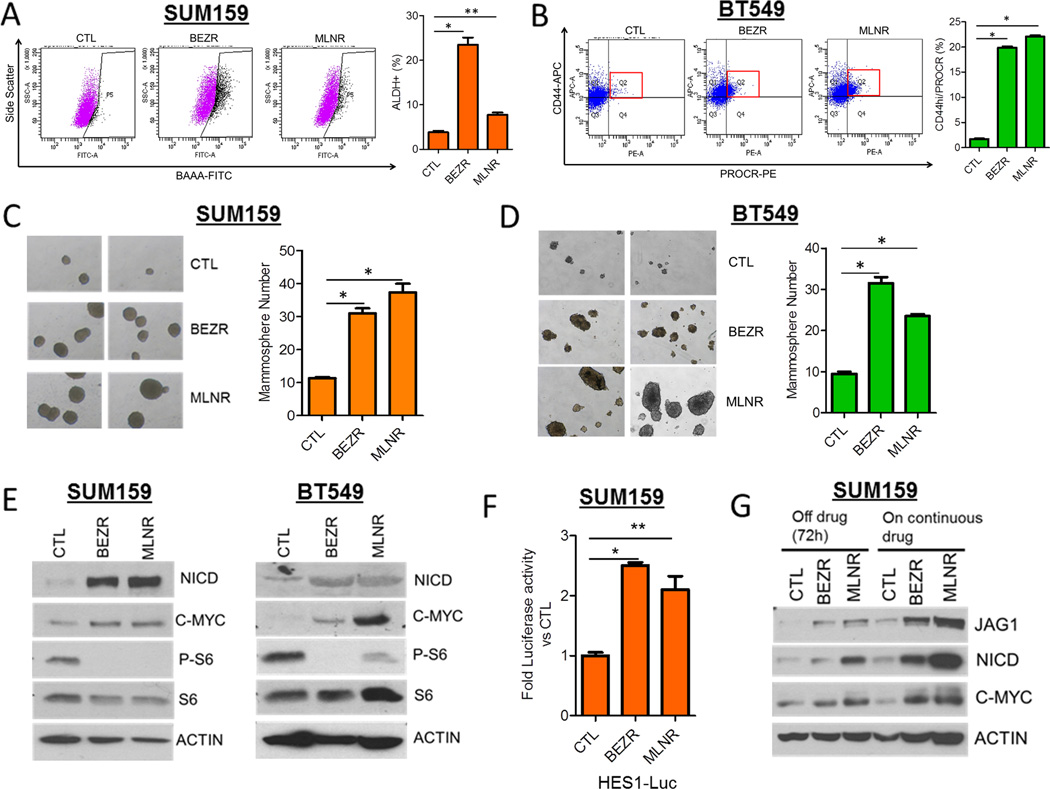
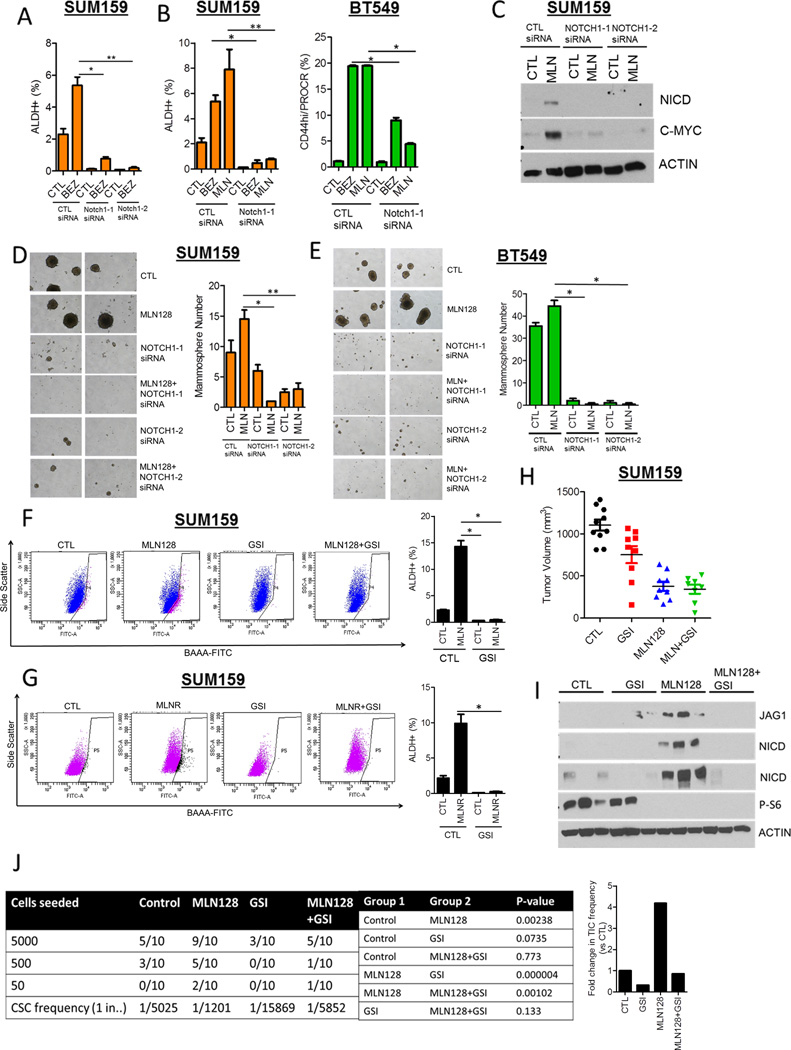
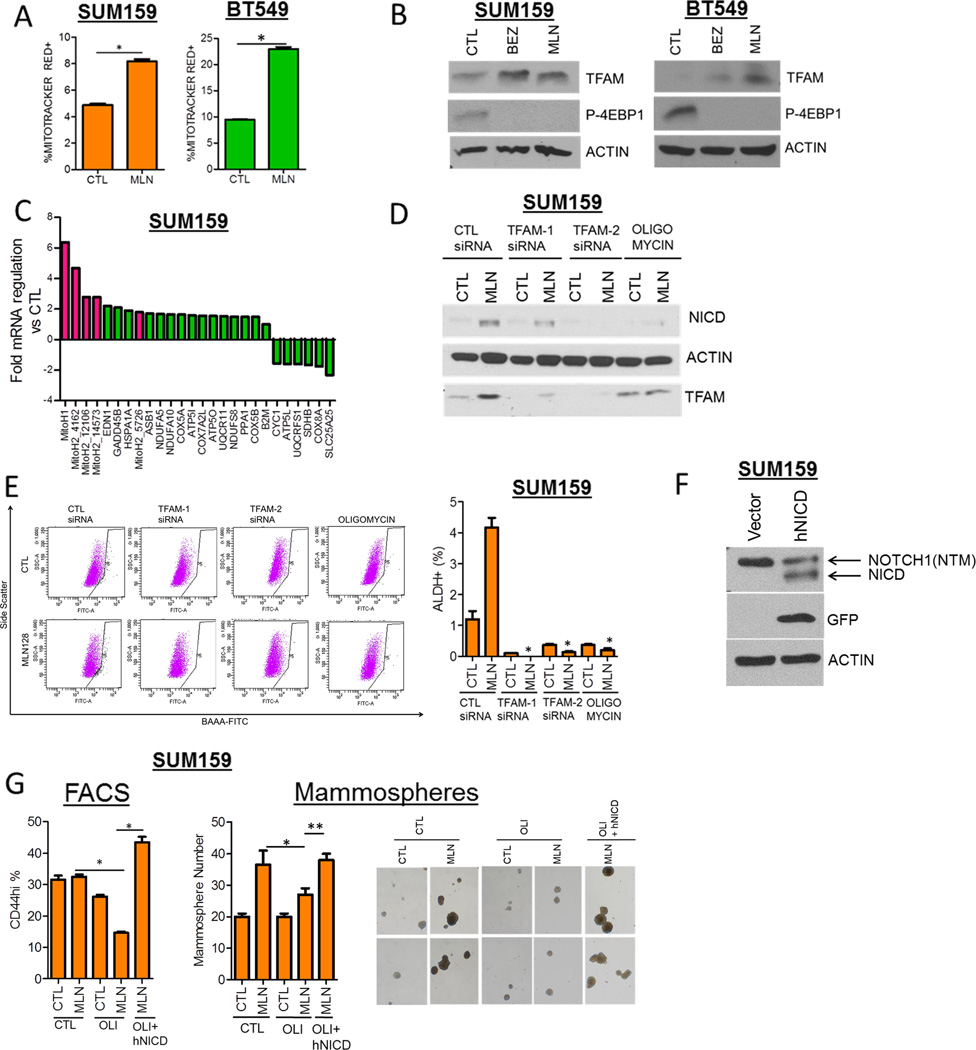
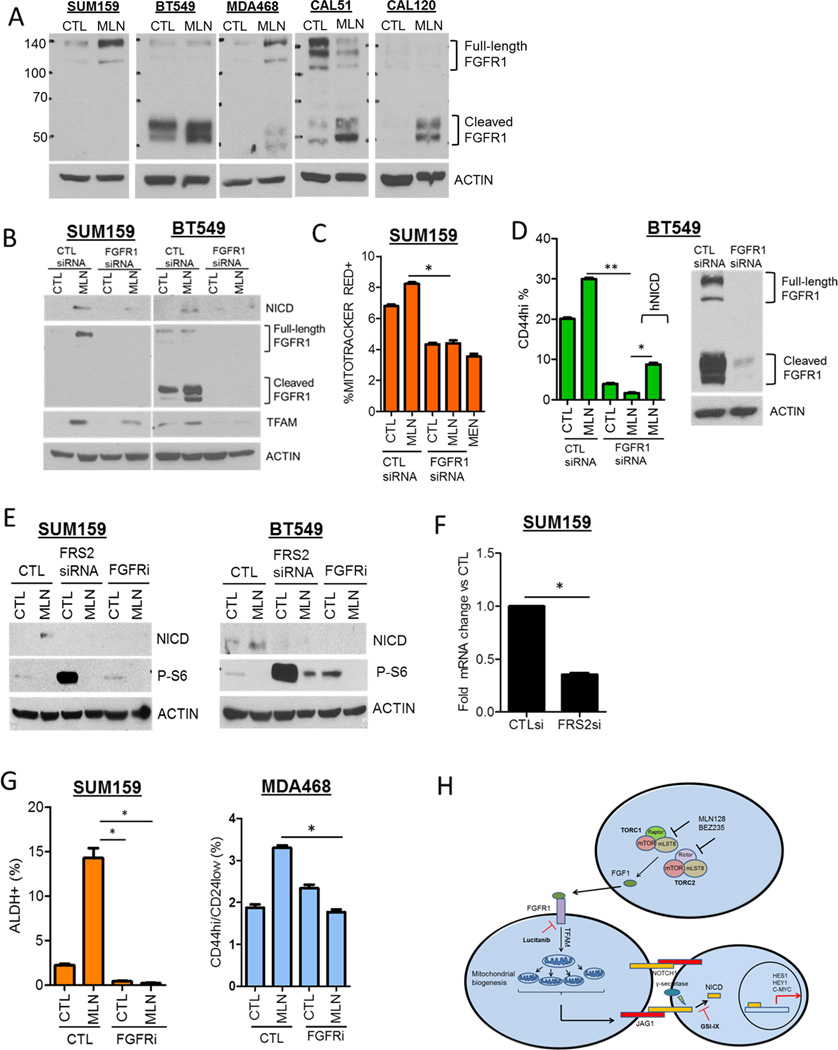
Approximately 30% of triple-negative breast cancers (TNBC) harbor molecular alterations in PI3K/mTOR signaling, but therapeutic inhibition of this pathway has not been effective. We hypothesized that intrinsic resistance to TORC1/2 inhibition is driven by cancer stem cell (CSC)-like populations that could be targeted to enhance the antitumor action of these drugs. Therefore, we investigated the molecular mechanisms by which PI3K/mTOR inhibitors affect the stem-like properties of TNBC cells. Treatment of established TNBC cell lines with a PI3K/mTOR inhibitor or a TORC1/2 inhibitor increased the expression of CSC markers and mammosphere formation. A CSC-specific PCR array revealed that inhibition of TORC1/2 increased FGF1 and Notch1 expression. Notch1 activity was also induced in TNBC cells treated with TORC1/2 inhibitors and associated with increased mitochondrial metabolism and FGFR1 signaling. Notably, genetic and pharmacologic blockade of Notch1 abrogated the increase in CSC markers, mammosphere formation, and in vivo tumor-initiating capacity induced by TORC1/2 inhibition. These results suggest that targeting the FGFR-mitochondrial metabolism-Notch1 axis prevents resistance to TORC1/2 inhibitors by eradicating drug-resistant CSCs in TNBC, and may thus represent an attractive therapeutic strategy to improve drug responsiveness and efficacy.


Conflict of interest statement

The authors in this manuscript have no conflicts of interest to declare.

Figures

Figure 1
Figure 1. PI3K/mTOR and TORC1/2 inhibitors enrich for a CSC population in TNBC cell lines
(A) SUM159 and BT549 cells were treated with 250 nM BEZ235 or 100 nM MLN128 for 72h. Cell viability was determined by the Alamar Blue viability assay (*P<0.009, **P<0.02). (B) SUM159, BT549 and MDA231 cells treated for 72 h were analyzed for phosphorylated S6 and 4EBP1 by immunoblot analysis. (C) SUM159, BT549 and MDA231 cells were treated with 250 nM BEZ235, 100 nM MLN128 or 100 nM RAD001 for 72 h. FACS analysis for CSC markers (SUM159-ALDH+, BT549-CD44hi/PROCR+, MDA231-PROCR+/ESA+) was performed. Propidium iodide or 7-AAD exclusion was used to select viable cells for analysis (*P<0.002, **P<0.03). (D) SUM159 and BT549 cells were treated with BEZ235 or MLN128 for 72 h and seeded in ultra-low adherent plates as mammospheres. Mammosphere number was determined after 10 days using GelCount (SUM159:*P=0.002; **P=0.02. BT549: *P=0.007; **P=0.048). Error bars represent mean ± SEM.
Figure 2
Figure 2. TORC1/2 inhibition increases Notch1 expression and activity in TNBC cell lines
(A) SUM159 cells were treated with control or 100 nM MLN128 for 48 h. RNA was extracted and used in the Cancer Stem Cell-specific PCR Array. Fold regulation of gene expression changes in MLN128-treated cells vs CTL was determined using the SA Biosciences PCR Array Software. (B) SUM159, BT549, CAL120, CAL51, MDA468 and MDA231 cells were treated with 250 nM BEZ235 or 100 nM MLN128 for 72 h. Q-PCR analysis was performed for NOTCH1 (*P<0.05; **P<0.005). (C) SUM159 and BT549 cells were treated with 250 nM BEZ235 and 100 nM MLN128 in the presence and absence of 10 µM GSI-IX for 72 h. Immunoblot analysis for the intracellular domain of Notch1 (NICD) and actin was performed. (D) SUM159, BT549, and MDA468 cells were treated with 250 nM BEZ235 and 100 nM MLN128 for 72 h. Immunoblot analysis for Jagged1 (JAG1), phospho-4EBP1 and Actin expression was performed. (E) Q-PCR for Notch1 targets HES1 and HEY2 was performed for SUM159 and BT549 cells treated with BEZ235 and MLN128 (*P<0.04, **P<0.01). (F) SUM159 and BT549 cells were treated with 100n M MLN128 for 0.5, 3, 24, 48 and 72 h followed by immunoblot analysis for NICD, Actin and phospho-S6. (G) SUM159 cells were transfected with control, Rictor, Raptor, or both Rictor and Raptor siRNAs for 72 h. Immunoblot analysis was performed using the indicated antibodies. FACS analysis for ALDH positivity was also performed at the same timepoint as shown to the right (*P=0.008). Error bars represent mean ± SEM.
Figure 3
Figure 3. Persistent TORC1/2 inhibition drives Notch1 signaling and a CSC-like phenotype
(A) SUM159 and (B) BT549 cells were treated with progressively higher concentrations (5–300 nM) of BEZ235 (BEZR) and MLN128 (MLNR) over a period of 8 weeks. FACS analysis for the CSC markers were quantified (SUM159: *P=0.0002, **P=0.002; BT549: *P<0.03). (C) SUM159 and (D) BT549 cells were treated as described in (A,B) and seeded as mammospheres; mammosphere number was determined after 7 days using GelCount (SUM159:*P<0.01; BT549:*P<0.02). Two representative images of mammospheres from each treatment are shown (magnification = 40×). (E) Immunoblot analysis of SUM159 and BT549 BEZR and MLNR cells was performed using the indicated antibodies. (F) SUM159 BEZR and MLNR cells were transfected with the HES1-Firefly Luciferase and CMV-Renilla constructs. The Dual Luciferase Assay was performed after 48 h as described in Experimental Procedures (*P<0.0001, **P=0.03). (G) SUM159 CTL, BEZR and MLNR cells were cultured in the continuous presence of vehicle or their respective inhibitor or taken off drug selection for 72 h, followed by immunoblot analysis for NICD, C-MYC and JAG1. Error bars represent mean ± SEM.
Figure 4
Figure 4. Notch1 downmodulation decreases the induction of CSCs upon inhibition of TORC1/2
(A) SUM159 cells were transfected with two different Notch1 siRNAs ± 250 nM BEZ235 for 72 h. FACS analysis for ALDH+ cells was performed (*P<0.03; **P<0.001). (B) SUM159 and BT549 cells were transfected with Notch1 siRNA ± 250 nM BEZ235 or 100 nM MLN128. After 72 h, FACS analysis for ALDH+ or CD44hi/PROCR+ expression was performed (*P< 0.03; **P<0.001). (C) SUM159 cells were transfected with 2 Notch1 siRNAs ± 100 nM MLN128. After 72 h, immunoblot analysis for NICD, C-MYC and Actin expression was performed. (D) SUM159 and (E) BT549 cells were transfected with Notch1siRNAs ± 100nM MLN128 for 48 h. Cells were trypsinized and seeded as mammospheres. After 7 days, mammosphere number was determined (*P< 0.03; **P<0.001). (F) SUM159 cells were treated with 100 nM MLN128 and/or 5 µM GSI-IX for 72 h, followed by FACS analysis for ALDH positivity (*P<0.01). (G) SUM159 CTL and MLNR cells were treated with 5 µM GSI-IX for 72 h, followed by FACS analysis for ALDH positivity (*P<0.01). (H) SUM159 xenografts were divided into 4 treatment groups (n=10): vehicle, MLN128 (1 mg/kg ×3/week, p.o.), GSI-IX (10 mg/kg, 3 days on, 4 days off, i.p.), MLN128 + GSI-IX. Tumor volumes of individual xenografts at day 28 are represented. (I) Lysates from xenografts in each treatment group were analyzed for NICD, JAG1, phospho-S6 and Actin. (J) In vivo limiting dilution experiment to determine tumor incidence from SUM159 xenografts treated with vehicle, MLN128, GSI-IX and MLN128 + GSI-IX. P-values for pairwise statistical analysis of treatment groups was determined by ELDA (Extreme Limiting dilution Analysis) and displayed. Fold change in tumor-initiating frequency is represented by the bar graph (right). Error bars represent mean ± SEM.
Figure 5
Figure 5. Induction of NICD and CSCs following TORC1/2 inhibition is dependent on mitochondrial metabolism
(A) SUM159 and BT549 cells were treated with control or 100 nM MLN128 for 48 h. Cells were stained with a marker for mitochondrial membrane potential Mitotracker Red-CMXRos and analyzed by flow cytometry. Percentage of Mitotracker Red-positive cells was determined (*P<0.0008). (B) SUM159 and BT549 cells were treated with vehicle, 250 nM BEZ235 or 100 nM MLN128 for 72 h. Immunoblot analysis for TFAM, phospho-4EBP1, and Actin was performed. (C) SUM159 cells were treated with vehicle or 100 nM MLN128 for 48 h. RNA was extracted, transcribed to cDNA and applied to a Mitochondrial Metabolism PCR Array. Genes displaying fold changes greater or lower than 1.5 compared to vehicle-treated cells were illustrated. Red highlighted bars indicate mitochondrial polycistronic transcripts. (D) Immunoblot analysis of SUM159 cells transfected with control or TFAM siRNA, treated with 500 nM Oligomycin ± 100 nM MLN128 for 72 h. (E) SUM159 cells were transfected with control or 2 TFAM siRNAs or treated with 500 nM Oligomycin A (OLI) ± 100 nM MLN128 for 72 h. FACS analysis for ALDH+ cells was performed (*P<0.006) (F) SUM159 cells transfected with empty vector and hNICD vector was analyzed by immunoblotting (NTM – Notch transmembrane). (G) SUM159 cells were transfected with control vector or human NICD (hNICD) followed by treatment with vehicle or MLN128 ± 500 nM Oligomycin (OLI). After 72 h, the CD44hi cells were identified by FACS (*P<0.003) or seeded as mammospheres and cultured for 10 days. Mammosphere number was determined using Gelcount (*P=0.01; **P=0.001). Two representative images of mammospheres from each treatment group are illustrated (magnification = 40×). Error bars represent mean ± SEM.
Figure 6
Figure 6. Induction of Notch1 and CSCs upon inhibition of TORC1/2 is FGFR-dependent
(A) SUM159, BT549, MDA468, CAL51, and CAL120 cells were treated with 100 nM MLN128 for 72 h. Immunoblot analysis for FGFR1 and actin was performed. (B) SUM159 and BT549 cells were transfected with control or FGFR1siRNA ± 100 nM MLN128 for 72 h. Immunoblot analysis for NICD, FGFR1, TFAM and Actin was performed. (C) SUM159 cells were transfected with control or FGFR1siRNA ± 100 nM MLN128 for 48 h. FACS analysis for Mitotracker Red was performed. Cells were treated with 5 µM menadione as a positive control (*P=0.003). (D) BT549 cells were transfected with control vector or GFP-hNICD followed by transfection with CTL or FGFR1 siRNA ± MLN128. After 72 h, FACS analysis for CD44hi cells was performed (*P=0.002;**P<0.001). (E) SUM159 and BT549 cells were transiently transfected with CTL and FRS2 siRNA or treated with 2 µM lucitanib for 72 h. Immunoblot analysis for NICD, phospho-S6 and Actin expression was performed. (F) SUM159 cells were transfected with CTL and FRS2 siRNA for 48 h followed by qPCR analysis for FRS2 expression (*P=0.0003). (G) SUM159 and MDA468 cells were treated with 100 nM MLN128 and/or 2 µM lucitanib for 72 h. FACS analysis for CSC markers was performed (*P< 0.02). Error bars represent mean ± SEM. (H) Proposed mechanistic model of NICD and CSC induction following TORC1/2 inhibition in TNBC.

Similar articles

Cited by

References

    1. Bertucci F, Finetti P, Cervera N, Esterni B, Hermitte F, Viens P, et al. How basal are triple-negative breast cancers? International Journal of Cancer. 2008;123:236–240. - PubMed
    1. Liedtke C, Mazouni C, Hess K, Andre F, Tordai A, Mejia J, et al. Response to neoadjuvant therapy and long-term survival in patients with triple-negative breast cancer. J Clin Oncol. 2008;26:1275–1281. - PubMed
    1. Banerji S, Cibulskis K, Rangel-Escareno C, Brown KK, Carter SL, Frederick AM, et al. Sequence analysis of mutations and translocations across breast cancer subtypes. Nature. 2012;486:405–409. - PMC - PubMed
    1. Lehmann BD, Bauer JA, Chen X, Sanders ME, Chakravarthy AB, Shyr Y, et al. Identification of human triple-negative breast cancer subtypes and preclinical models for selection of targeted therapies. The Journal of Clinical Investigation. 2011;121:2750–2767. - PMC - PubMed
    1. Shah S, Morin R, Khattra J, Prentice L, Pugh T, Burleigh A, et al. Mutational evolution in a lobular breast tumour profiled at single nucleotide resolution. Nature. 2009;461:809–813. - PubMed

Publication types

MeSH terms

Substances