Administration of interleukin-7 increases CD4 T cells in idiopathic CD4 lymphocytopenia
- PMID: 26675348
- PMCID: PMC4768432
- DOI: 10.1182/blood-2015-05-645077
Administration of interleukin-7 increases CD4 T cells in idiopathic CD4 lymphocytopenia
Abstract
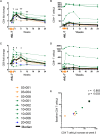
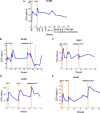
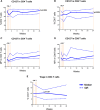
Idiopathic CD4 lymphopenia (ICL) is a rare syndrome defined by low CD4 T-cell counts (<300/µL) without evidence of HIV infection or other known cause of immunodeficiency. ICL confers an increased risk of opportunistic infections and has no established treatment. Interleukin-7 (IL-7) is fundamental for thymopoiesis, T-cell homeostasis, and survival of mature T cells, which provides a rationale for its potential use as an immunotherapeutic agent for ICL. We performed an open-label phase 1/2A dose-escalation trial of 3 subcutaneous doses of recombinant human IL-7 (rhIL-7) per week in patients with ICL who were at risk of disease progression. The primary objectives of the study were to assess safety and the immunomodulatory effects of rhIL-7 in ICL patients. Injection site reactions were the most frequently reported adverse events. One patient experienced a hypersensitivity reaction and developed non-neutralizing anti-IL-7 antibodies. Patients with autoimmune diseases that required systemic therapy at screening were excluded from the study; however, 1 participant developed systemic lupus erythematosus while on study and was excluded from further rhIL-7 dosing. Quantitatively, rhIL-7 led to an increase in the number of circulating CD4 and CD8 T cells and tissue-resident CD3 T cells in the gut mucosa and bone marrow. Functionally, these T cells were capable of producing cytokines after mitogenic stimulation. rhIL-7 was well tolerated at biologically active doses and may represent a promising therapeutic intervention in ICL. This trial was registered at www.clinicaltrials.gov as #NCT00839436.
Figures


Similar articles
-
IL-7 administration drives T cell-cycle entry and expansion in HIV-1 infection.Blood. 2009 Jun 18;113(25):6304-14. doi: 10.1182/blood-2008-10-186601. Epub 2009 Apr 20. Blood. 2009. PMID: 19380868 Free PMC article. Clinical Trial.
-
Effects of recombinant human interleukin 7 on T-cell recovery and thymic output in HIV-infected patients receiving antiretroviral therapy: results of a phase I/IIa randomized, placebo-controlled, multicenter study.Clin Infect Dis. 2012 Jul;55(2):291-300. doi: 10.1093/cid/cis383. Epub 2012 May 1. Clin Infect Dis. 2012. PMID: 22550117 Free PMC article. Clinical Trial.
-
Altered responses to homeostatic cytokines in patients with idiopathic CD4 lymphocytopenia.PLoS One. 2013;8(1):e55570. doi: 10.1371/journal.pone.0055570. Epub 2013 Jan 30. PLoS One. 2013. PMID: 23383227 Free PMC article.
-
Idiopathic CD4 lymphocytopenia: a case of missing, wandering or ineffective T cells.Arthritis Res Ther. 2012 Aug 31;14(4):222. doi: 10.1186/ar4027. Arthritis Res Ther. 2012. PMID: 22971990 Free PMC article. Review.
-
Idiopathic CD4 lymphocytopenia and opportunistic infection--an update.FEMS Immunol Med Microbiol. 2008 Dec;54(3):283-9. doi: 10.1111/j.1574-695X.2008.00490.x. FEMS Immunol Med Microbiol. 2008. PMID: 19049641 Review.
Cited by
-
Autologous Graft-versus-Tumor Effect: Reality or Fiction?Adv Hematol. 2016;2016:5385972. doi: 10.1155/2016/5385972. Epub 2016 Aug 22. Adv Hematol. 2016. PMID: 27635143 Free PMC article. Review.
-
An Update on the Use of Immunomodulators in Primary Immunodeficiencies.Clin Rev Allergy Immunol. 2017 Apr;52(2):287-303. doi: 10.1007/s12016-016-8591-2. Clin Rev Allergy Immunol. 2017. PMID: 27873163 Review.
-
Clinical presentation of idiopathic CD4 lymphocytopenia.BMJ Case Rep. 2023 Jul 6;16(7):e254746. doi: 10.1136/bcr-2023-254746. BMJ Case Rep. 2023. PMID: 37419499
-
Interleukin-7 and Immunosenescence.J Immunol Res. 2017;2017:4807853. doi: 10.1155/2017/4807853. Epub 2017 Apr 6. J Immunol Res. 2017. PMID: 28484723 Free PMC article. Review.
-
Pre-transplant Thymic Function Predicts Is Associated With Patient Death After Kidney Transplantation.Front Immunol. 2020 Jul 31;11:1653. doi: 10.3389/fimmu.2020.01653. eCollection 2020. Front Immunol. 2020. PMID: 32903778 Free PMC article.
References
-
- Smith DK, Neal JJ, Holmberg SD. Unexplained opportunistic infections and CD4+ T-lymphocytopenia without HIV infection. An investigation of cases in the United States. The Centers for Disease Control Idiopathic CD4+ T-lymphocytopenia Task Force. N Engl J Med. 1993;328(6):373–379. - PubMed
-
- Fry TJ, Mackall CL. Interleukin-7: from bench to clinic. Blood. 2002;99(11):3892–3904. - PubMed
-
- Mazzucchelli R, Durum SK. Interleukin-7 receptor expression: intelligent design. Nat Rev Immunol. 2007;7(2):144–154. - PubMed
Publication types
MeSH terms
Substances
Associated data
Grants and funding
LinkOut - more resources
Full Text Sources
Other Literature Sources
Research Materials

