. 2016 Aug;36(8):1357-73.
doi: 10.1177/0271678X15608388. Epub 2015 Oct 13.

Microvascular basis for growth of small infarcts following occlusion of single penetrating arterioles in mouse cortex

Affiliations

Microvascular basis for growth of small infarcts following occlusion of single penetrating arterioles in mouse cortex

Zachary J Taylor et al. J Cereb Blood Flow Metab. 2016 Aug.

Abstract

Small cerebral infarcts, i.e. microinfarcts, are common in the aging brain and linked to vascular cognitive impairment. However, little is known about the acute growth of these minute lesions and their effect on blood flow in surrounding tissues. We modeled microinfarcts in the mouse cortex by inducing photothrombotic clots in single penetrating arterioles. The resultant hemodynamic changes in tissues surrounding the occluded vessel were then studied using in vivo two-photon microscopy. We were able to generate a spectrum of infarct volumes by occluding arterioles that carried a range of blood fluxes. Those resulting from occlusion of high-flux penetrating arterioles (flux of 2 nL/s or higher) exhibited a radial outgrowth that encompassed unusually large tissue volumes. The gradual expansion of these infarcts was propagated by an evolving insufficiency in capillary flow that encroached on territories of neighboring penetrating arterioles, leading to the stagnation and recruitment of their perfusion domains into the final infarct volume. Our results suggest that local collapse of microvascular function contributes to tissue damage incurred by single penetrating arteriole occlusions in mice, and that a similar mechanism may add to pathophysiology induced by microinfarcts of the human brain.

Keywords: Ischemia; cerebral blood flow; microcirculation; two-photon microscopy; venous thrombosis.


Figures

Figure 1.
Figure 1.
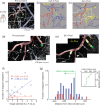
In vivo vasodynamics of individual penetrating vessels in mouse cortex. (a) In vivo two-photon image of cortical pial vasculature. Arterioles are pseudocolored in red and venules in blue. The image is composed of a montage of maximally projected stacks spanning a depth of 75 µm from the pial surface. Subsurface capillaries within this imaging depth are shown in white, as are dural vessels. The point of entry for a single penetrating arteriole (PA) into the cortical parenchyma is marked with a red circle and the exit of a single penetrating venule (PV) from the parenchyma is marked with a blue circle. (b) 3-D rendering of an in vivo image stack providing a side view of a PA and PV. This stack was taken in vivo following removal of the overlying skull to show penetrating vessels at depth. (c) Scatter plot and histograms of centerline RBC velocity, v(0), plotted as a function of lumen diameter, d, for individual penetrating vessels. The crossbars show mean ± SEM for all data points in each vessel group. (d) Histogram showing the distribution of RBC volume flux, F, for PAs and PVs. A vertical line marks the average flux for each vessel type and the range for SEM is shaded.
Figure 2.
Figure 2.
A spectrum of cortical infarct volumes induced by targeted photothrombotic occlusion of single penetrating arterioles. (a) Schematics depicting the placement of the green laser focus for occlusions of cortical penetrating arterioles (on-target; right) or control irradiations (off-target; left). (b) In vivo two-photon images of the pial surface before and after targeted irradiation. Non-flowing vascular segments are colored in yellow. Only the pre-occlusion image is shown for the off-target irradiation because no loss of pial vessel flow was observed. (c) NeuN immunohistology to quantify the volume of tissue infarct resulting from single penetrating arteriole occlusions or off-target irradiations. The white matter of the external capsule is labeled, wm, to show the base of the cortex. (d to f) Scatter plot of infarct diameter, depth and volume versus the pre-occlusion RBC volume flux of individual penetrating arterioles. Infarct diameter and volume, but not depth, were significantly correlated with flux (n = 18). Off-target irradiations generated infarcts volumes over an order of magnitude smaller than penetrating arteriole occlusions (p < 0.001, Mann-Whitney test). Since no penetrating vessel was occluded with off-target irradiation, there is no associated flux to report. The crossbars show mean ± SEM for all data points in each irradiation group. Regression analyses of penetrating arteriole occlusion data were performed on log10-transformed values. (g) Schematic showing relative infarct size between off-target irradiations and on-target occlusions, based on average values from panels (d) to (f).
Figure 3.
Figure 3.
Radial expansion of infarcts generated by occlusion of high-flux penetrating arterioles. (a) Repeated T2-weighted (T2W) MRI to track infarct growth. Two penetrating arterioles, one with flux of 2.3 nL/s (high-flux) and the other with 0.3 nL/s (low flux) were occluded within a single imaging window. MRI was then performed in a plane tangential to the cortical surface at various times post-occlusion. (b) Coronal view of infarcts (green arrowhead) resulting from occlusion of the low flux (top) and high-flux (bottom) arterioles at 24 h post-occlusion. (c, d) Time course showing change in mean diffusivity of water (MD, upper row) and T2W signal (lower row) following occlusion of a single high-flux penetrating arteriole (1.8 nL/s). Note that a homogeneous region of reduced MD was present before detectable T2W hyperintensity at 3 h post-occlusion. (e) Area and diameter of affected tissues, as quantified from MD and T2W images, plotted as a function of post-occlusion time (n = 6 high-flux penetrating arteriole occlusions). Data provided as mean ± SEM. MD and T2W curves are statistically different (p < 0.001, Friedman’s two-way ANOVA), and pairwise comparisons at each time-point revealed a significant difference at the 3 h post-occlusion time-point (*p < 0.05, Mann-Whitney test adjusted for multiple comparison across time with the Dunn-Sidak post hoc test). Note that the term “infarct” was used for consistency with other figures, but MRI signal change does not necessarily report the region of true tissue infarction. (f) Representative images of immunohistochemical staining for tissue infarction and vascular leakage in mice sacrificed at various times post-occlusion. The boundary of each infarct was delineated by the interface between the presence and absence of NeuN-stained neuronal nuclei (red). Note that retention of circulating FITC-dextran dye in the tissue (green), which corresponds to regions of capillary BBB leakage, occurs in visually normal tissues outside the delineated infarct boundary.
Figure 4.
Figure 4.
Evolution of acute capillary pathology in tissues surrounding an occluded penetrating arteriole. (a) Wide-field two-photon image showing the location of high-resolution imaging (cyan square) relative to an occluded penetrating arteriole (green circle; target). The approximate border of the resulting infarct, as measured using histology 24 h post-occlusion, is demarcated with a dotted line. Note that three other penetrating arterioles exist within this boundary (yellow arrowheads). (b) Projections of high-resolution image stacks, spanning 150 µm in depth from the pia, collected at various times post-occlusion. Vessels with the absence of flowing RBCs are pseudocolored in yellow. (c to f) Each capillary segment, defined as a length of capillary extending between two branchpoints, was visually examined for features of pathology. The observed pathology was categorized into four groups: constriction, dilation, obstruction and BBB leak. Further, each capillary received a binary measure of flow or no-flow, based on the presence of streaks caused by moving blood cells within the lumen. Examples for each scenario are shown. Regions of constriction and dilation are marked with yellow arrowheads. Obstructing objects and puncta of plasma leakage are marked with yellow arrows. Note the presence of streaks in vessels of pre-occlusion images formed by the movement of RBCs while the image was scanned. (g) Matrices showing occurrence of each pathological feature for all capillaries examined as a function of post-occlusion time. The matrices were first sorted along the y-axis to highlight constrictive or dilatory events with respect to the time of first emergence and duration (left panel, purple and red). All other panels were sorted with the same capillary index as defined in the left panel, to show subsequent loss of flow (black), lumen obstruction (blue) and BBB leak (green). This data comprises 199 capillary segments repeatedly sampled from four separate infarcts from four mice. (h) Overall evolution of capillary constriction (red curve), dilation (purple curve), obstruction (blue curve) and BBB breakdown (green curve) in the vascular beds of the stroke periphery. Data are shown as a proportion of total capillaries examined with 0.95 confidence intervals at each time-point. (i) Constricted capillary segments detected in an early phase (2 to 4 h post-occlusion) of stroke were significantly more likely to be non-flowing (left) or obstructed (right) in the later phase of stroke (4 to 6 h post-occlusion). (j) Dilation of capillaries in early phase did not affect the likelihood of loss of flow or lumen obstruction in the late phase. Data for panels (i) and (j) are provided as proportion of total capillaries with 0.95 confidence intervals.
Figure 5.
Figure 5.
Capillary flow impedance associated with a growing infarct stagnates flow of neighboring penetrating arterioles and venules. (a) Wide-field image collected by two-photon microscopy showing the location of an occluded penetrating arteriole (green circle). High-resolution movies were collected within this larger field to assess RBC flow in pial vessels (inset, see panel d). (b, c) Vessel tracing of the imaged region in panel a with non-flowing vascular segments highlighted in yellow. Note the marked increase in non-flowing neighboring penetrating venules and arterioles at 24 h post-occlusion. (d, e) Montages from high-resolution movies showing the extent of flow loss in the pial vascular network. In panel (e), a surface arteriole coursing through the imaging field remains patent, while two neighboring penetrating arterioles (arrows) that are sourced by the arteriole no longer support flow. A neighboring penetrating venule completely collapses and is no longer visible at 24 h (arrowhead). This is consistent with an increase in capillary resistance that prevents the influx and efflux of blood from the cortical parenchyma. (f) Scatter plot of the number of stagnant neighboring penetrating venules and arterioles as a function of the pre-occlusion RBC flux of a targeted penetrating arteriole (n = 12 separate occlusions). (g) Distance of stagnant neighboring penetrating vessels relative to the border of the infarct, as demarcated by loss of NeuN staining in post hoc histology. An inset shows the cumulative distribution plot of infarct radius size.
Figure 6.
Figure 6.
Occlusion of a single penetrating venule is sufficient to stagnate neighboring penetrating arterioles. (a) Schematic depicting the placement of the green laser focus for occlusion of single cortical penetrating venules. (b) Wide-field image collected by two-photon microscopy showing the location of an occluded penetrating venule (green circle). (c, d) Vessel tracings from the region imaged in panel (b) with non-flowing vascular segments highlighted in yellow. Note the loss of flow in two neighboring penetrating arterioles at 24 h post-occlusion (white arrows). (e) Scatter plot of the number of stagnant neighboring penetrating arterioles and venules as a function of the pre-occlusion RBC flux of a targeted penetrating venule (n = 11 separate occlusions). (f) Distance of stagnant neighboring penetrating vessels relative to the border of the infarct, as demarcated by loss of NeuN staining in post hoc histology. Inset shows cumulative distribution plot of infarct radius size. (G) Left panel, scatter plot of the infarct volume versus the pre-occlusion RBC volume flux of individual penetrating venules. Venule occlusions that resulted in secondary stagnation of neighboring penetrating arterioles are shown as solid circles, while those that did not are shown as open circles. Infarct volume was not correlated with pre-occlusion flux (n = 10). The crossbars show mean ± SEM for all data points. Right panel, infarcts that involved stagnation of a neighboring arteriole resulted in significantly larger infarcts (*p = 0.02, Mann-Whitney test).
Figure 7.
Figure 7.
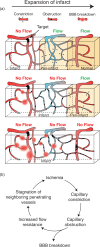
Schematic depicting the evolution of microvascular changes in the periphery of a growing microinfarct. (a) Three snapshots in time depicting the progression of microvascular pathology relative to the infarct core and its consequence on flow in neighboring vessels. Capillary constriction is an early event in the periphery of the growing infarct (upper panel). This constriction increases the likelihood of obstruction by blood elements leading to loss of flow in cortical domains perfused by neighboring penetrating venules (middle panel). The walls of capillaries degrade and leak closer to the infarct core, while those more distant to the core begin to constrict. The expansion of the infarct involves stagnation of neighboring, independently sourced penetrating arterioles, which rely on penetrating venules for blood efflux (bottom panel). (b) Cycle of vascular events leading to growth of the infarct core.

Similar articles

Cited by

References

    1. Kövari E, Gold G, Herrmann FR, et al. Cortical microinfarcts and demyelination significantly affect cognition in brain aging. Stroke 2004; 35: 410–414. - PubMed
    1. Smith EE, Schneider JA, Wardlaw JM, et al. Cerebral microinfarcts: the invisible lesions. Lancet Neurol 2012; 11: 272–82. - PMC - PubMed
    1. Westover MB, Bianchi MT, Yang C, et al. Estimating cerebral microinfarct burden from autopsy samples. Neurology 2013; 80: 1365–1369. - PMC - PubMed
    1. Gorelick PB, Scuteri A, Black SE, et al. Vascular contributions to cognitive impairment and dementia: a statement for healthcare professionals from the American Heart Association/American Stroke Association. Stroke 2011; 42: 2672–2713. - PMC - PubMed
    1. van Veluw, Zwanenburg SJ, Engelene-LJ JJ, et al. In vivo detection of cerebral cortical microinfarcts with high-resolution 7T MRI. J Cereb Blood Flow Metab. 2012; 33: 322–329. - PMC - PubMed

Publication types

MeSH terms

LinkOut - more resources