

Podocyte injury in diabetic nephropathy: implications of angiotensin II-dependent activation of TRPC channels
- PMID: 26656101
- PMCID: PMC4674698
- DOI: 10.1038/srep17637
Podocyte injury in diabetic nephropathy: implications of angiotensin II-dependent activation of TRPC channels
Abstract
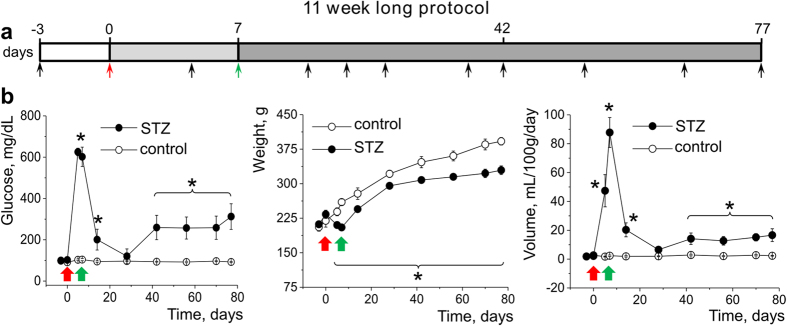
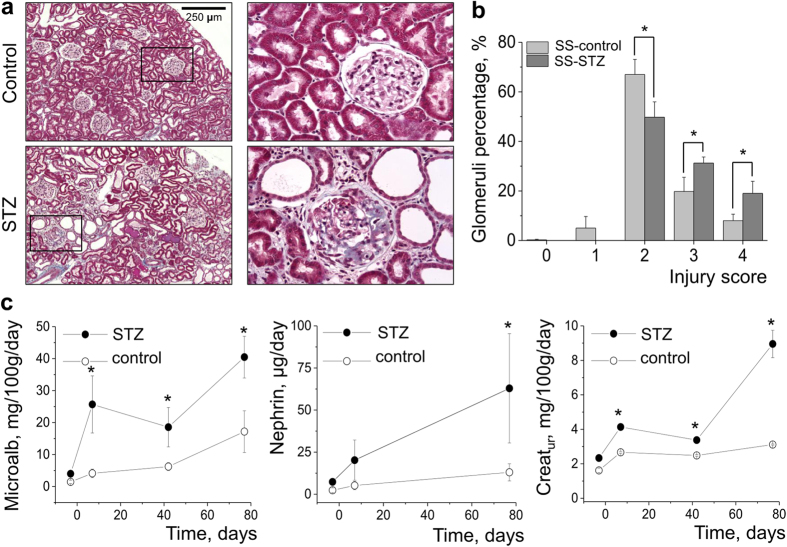
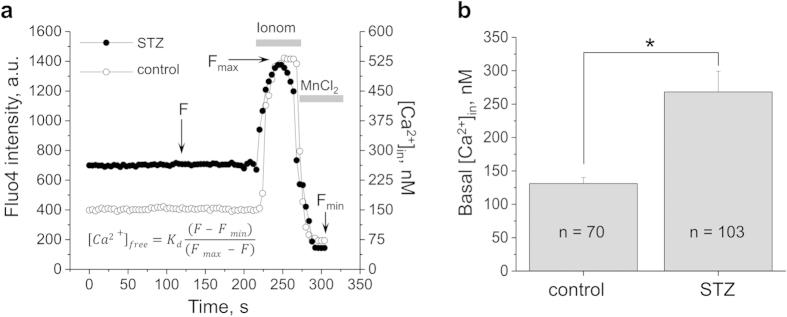
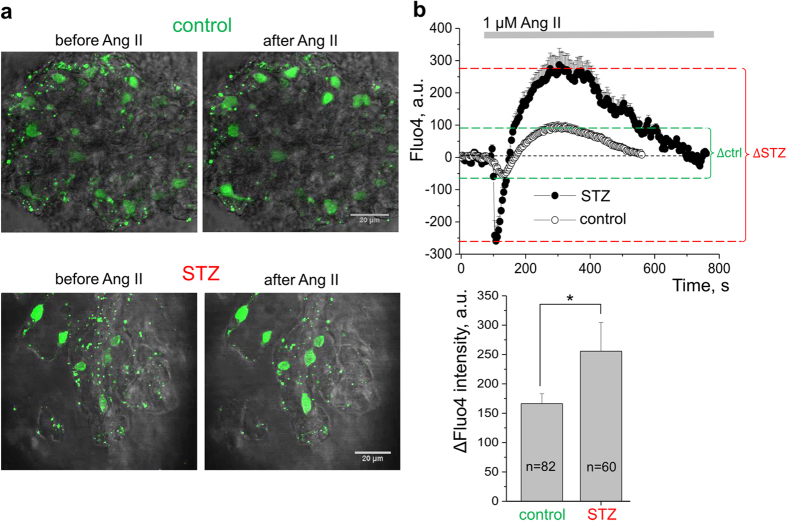
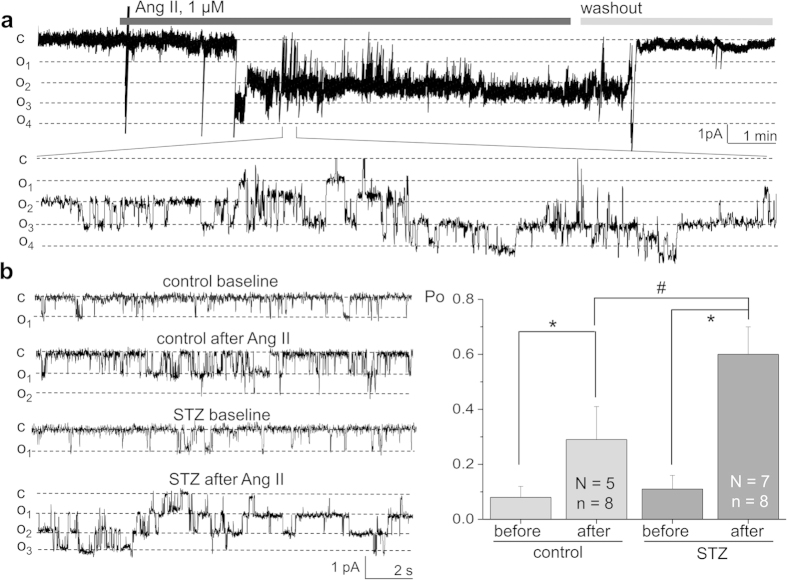
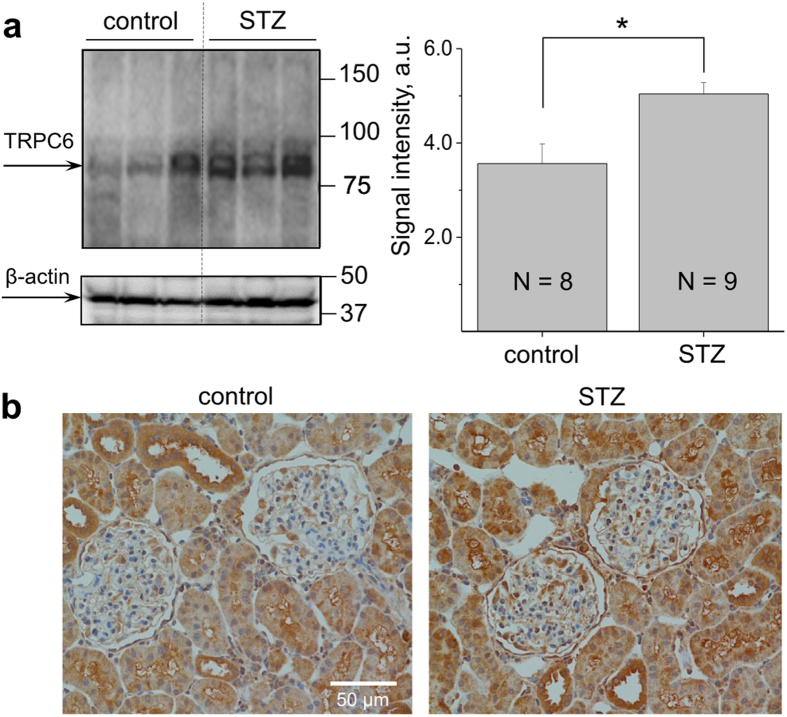
Injury to podocytes is considered a major contributor to diabetic kidney disease: their loss causes proteinuria and progressive glomerulosclerosis. Podocyte depletion may result from improper calcium handling due to abnormal activation of the calcium permeant TRPC (Transient Receptor Potential Canonical) channels. Angiotensin II (Ang II) levels are found to be elevated in diabetes; furthermore, it was reported that Ang II causes activation of TRPC6 in podocytes. We hypothesized here that Ang II-mediated calcium influx is aggravated in the podocytes under the conditions of type 1 diabetic nephropathy (DN). Diabetes was induced in the Dahl Salt-Sensitive rats by an injection of streptozotocin (STZ-SS). Eleven weeks post treatment was sufficient for the animals to develop hyperglycemia, excessive urination, weight loss, microalbuminuria, nephrinuria and display renal histological lesions typical for patients with DN. Patch-clamp electrophysiology performed on podocytes of the freshly isolated glomeruli showed enhanced basal TRPC channel activity in the STZ-SS rats, and increased response to Ang II; total calcium influx triggered by Ang II application was also augmented in podocytes of these rats. Our studies have a strong potential for advancing the understanding of TRPC-mediated effects on podocytopenia in DN initiation.
Figures
Similar articles
-
A NOX4/TRPC6 Pathway in Podocyte Calcium Regulation and Renal Damage in Diabetic Kidney Disease.J Am Soc Nephrol. 2018 Jul;29(7):1917-1927. doi: 10.1681/ASN.2018030280. Epub 2018 May 23. J Am Soc Nephrol. 2018. PMID: 29793963 Free PMC article.
-
Glucose specifically regulates TRPC6 expression in the podocyte in an AngII-dependent manner.Am J Pathol. 2014 Jun;184(6):1715-26. doi: 10.1016/j.ajpath.2014.02.008. Epub 2014 Apr 13. Am J Pathol. 2014. PMID: 24731445
-
TRPC6 channel as an emerging determinant of the podocyte injury susceptibility in kidney diseases.Am J Physiol Renal Physiol. 2015 Sep 1;309(5):F393-7. doi: 10.1152/ajprenal.00186.2015. Epub 2015 Jun 17. Am J Physiol Renal Physiol. 2015. PMID: 26084930 Free PMC article. Review.
-
Protective role of Trpc6 knockout in the progression of diabetic kidney disease.Am J Physiol Renal Physiol. 2018 Oct 1;315(4):F1091-F1097. doi: 10.1152/ajprenal.00155.2018. Epub 2018 Jun 20. Am J Physiol Renal Physiol. 2018. PMID: 29923767 Free PMC article.
-
Regulation of TRPC6 ion channels in podocytes - Implications for focal segmental glomerulosclerosis and acquired forms of proteinuric diseases.Acta Physiol Hung. 2015 Sep;102(3):241-51. doi: 10.1556/036.102.2015.3.2. Acta Physiol Hung. 2015. PMID: 26551740 Review.
Cited by
-
A Putative Role for TRPC6 in Immune-Mediated Kidney Injury.Int J Mol Sci. 2023 Nov 16;24(22):16419. doi: 10.3390/ijms242216419. Int J Mol Sci. 2023. PMID: 38003608 Free PMC article. Review.
-
Proteinuric Kidney Diseases: A Podocyte's Slit Diaphragm and Cytoskeleton Approach.Front Med (Lausanne). 2018 Sep 11;5:221. doi: 10.3389/fmed.2018.00221. eCollection 2018. Front Med (Lausanne). 2018. PMID: 30255020 Free PMC article. Review.
-
Recent advances in molecular mechanisms of acute kidney injury in patients with diabetes mellitus.Front Endocrinol (Lausanne). 2023 Jan 5;13:903970. doi: 10.3389/fendo.2022.903970. eCollection 2022. Front Endocrinol (Lausanne). 2023. PMID: 36686462 Free PMC article. Review.
-
Inactivation of p66Shc Decreases Afferent Arteriolar KATP Channel Activity and Decreases Renal Damage in Diabetic Dahl SS Rats.Diabetes. 2018 Nov;67(11):2206-2212. doi: 10.2337/db18-0308. Epub 2018 Aug 21. Diabetes. 2018. PMID: 30131395 Free PMC article.
-
Ischemia-Modified Albumin: Origins and Clinical Implications.Dis Markers. 2021 Jul 19;2021:9945424. doi: 10.1155/2021/9945424. eCollection 2021. Dis Markers. 2021. PMID: 34336009 Free PMC article. Review.
References
-
- Zhang P. et al. Global healthcare expenditure on diabetes for 2010 and 2030. Diabetes Res. Clin. Pract. 87, 293–301 (2010). - PubMed
-
- Tervaert T. W. et al. Pathologic classification of diabetic nephropathy. J. Am. Soc. Nephrol. 21, 556–563 (2010). - PubMed
-
- Wolf G., Chen S. & Ziyadeh F. N. From the periphery of the glomerular capillary wall toward the center of disease: podocyte injury comes of age in diabetic nephropathy. Diabetes 54, 1626–1634 (2005). - PubMed
Publication types
MeSH terms
Substances
Grants and funding
LinkOut - more resources
Full Text Sources
Other Literature Sources
Medical
Miscellaneous
