. 2016 Feb;18(2):202-12.
doi: 10.1038/ncb3289. Epub 2015 Dec 14.

Site-specific proteasome phosphorylation controls cell proliferation and tumorigenesis

Affiliations

Site-specific proteasome phosphorylation controls cell proliferation and tumorigenesis

Xing Guo et al. Nat Cell Biol. 2016 Feb.

Abstract

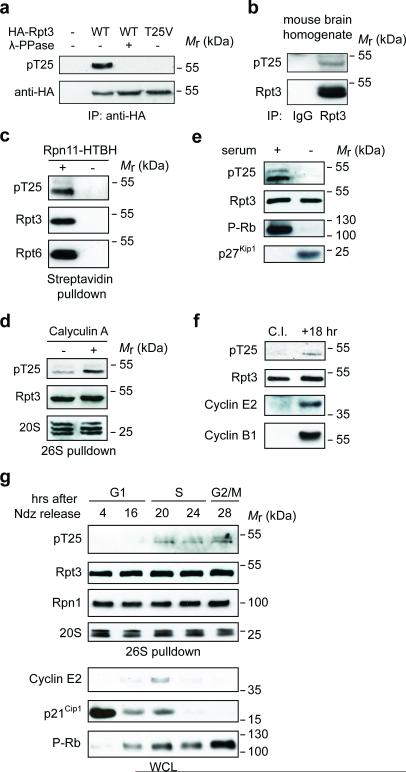
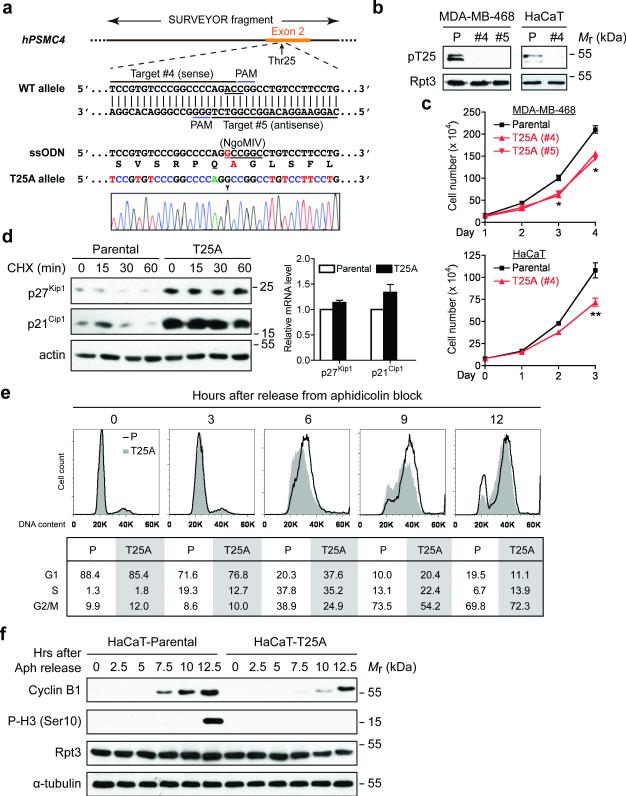
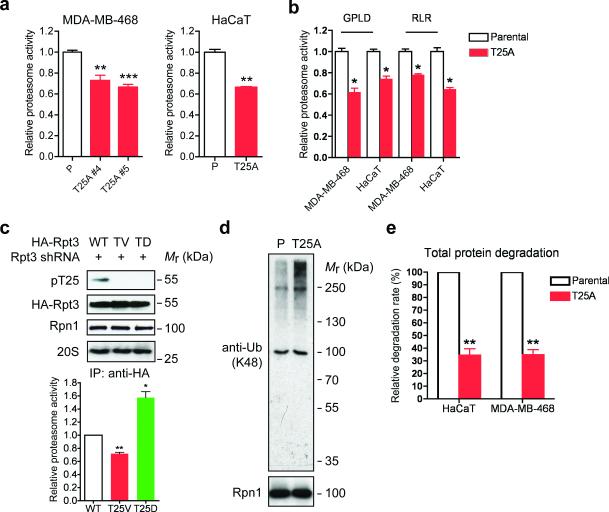
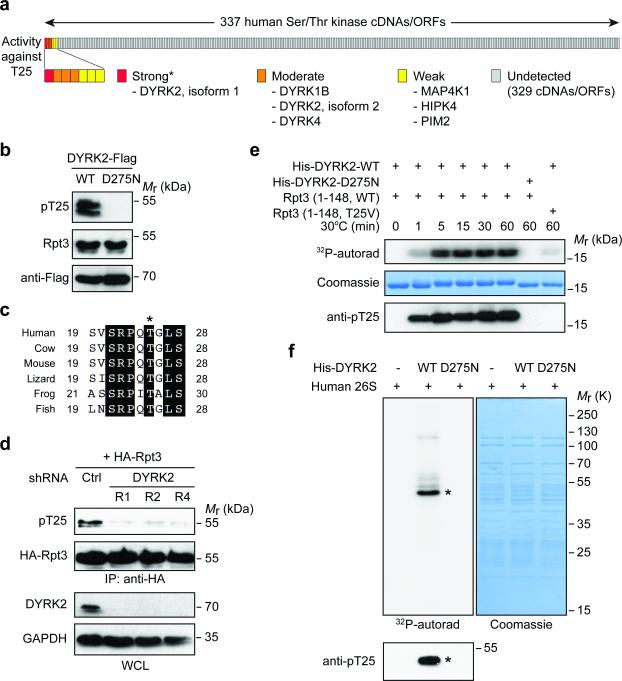
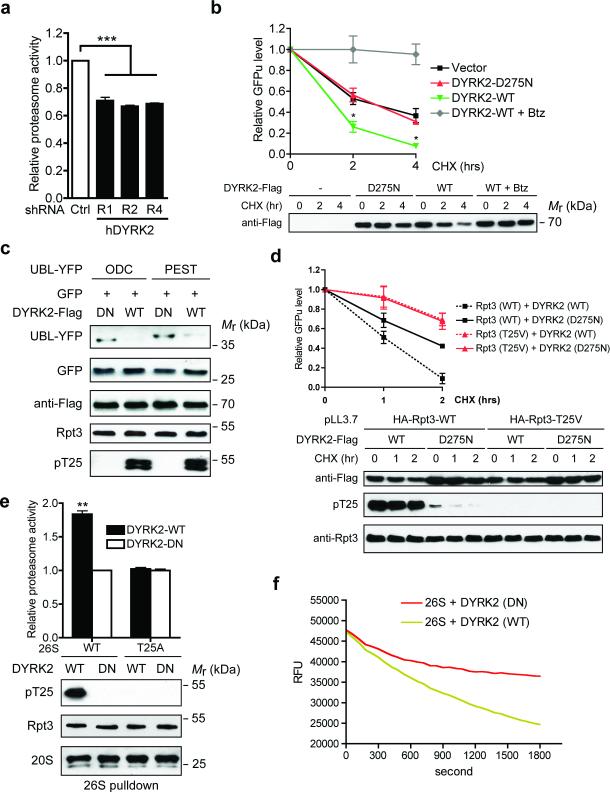
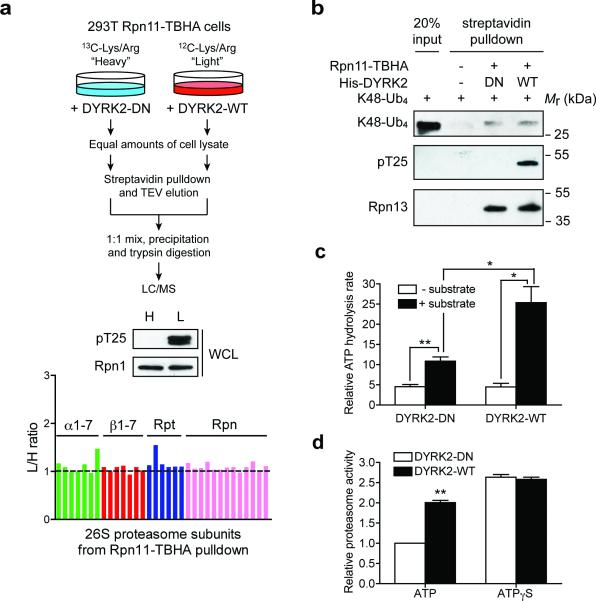
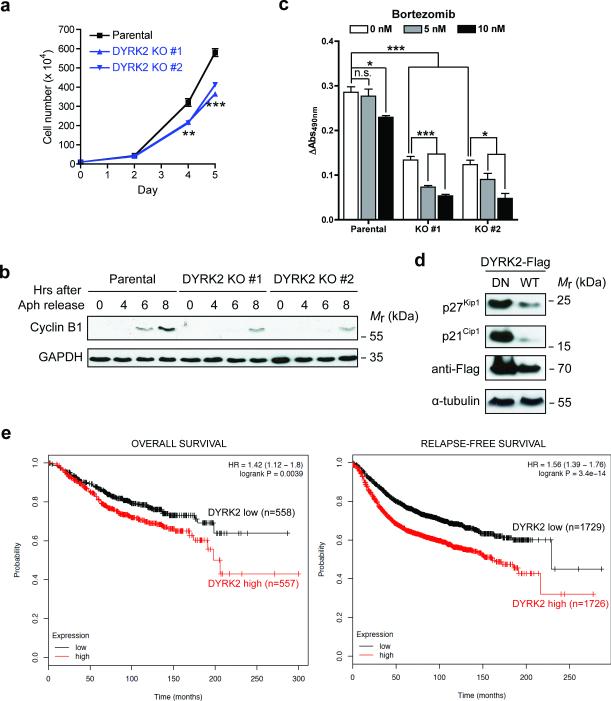
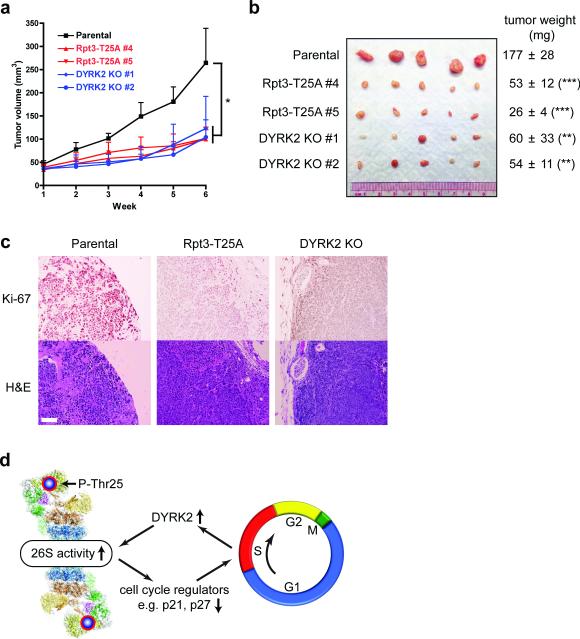
Despite the fundamental importance of proteasomal degradation in cells, little is known about whether and how the 26S proteasome itself is regulated in coordination with various physiological processes. Here we show that the proteasome is dynamically phosphorylated during the cell cycle at Thr 25 of the 19S subunit Rpt3. CRISPR/Cas9-mediated genome editing, RNA interference and biochemical studies demonstrate that blocking Rpt3-Thr25 phosphorylation markedly impairs proteasome activity and impedes cell proliferation. Through a kinome-wide screen, we have identified dual-specificity tyrosine-regulated kinase 2 (DYRK2) as the primary kinase that phosphorylates Rpt3-Thr25, leading to enhanced substrate translocation and degradation. Importantly, loss of the single phosphorylation of Rpt3-Thr25 or knockout of DYRK2 significantly inhibits tumour formation by proteasome-addicted human breast cancer cells in mice. These findings define an important mechanism for proteasome regulation and demonstrate the biological significance of proteasome phosphorylation in regulating cell proliferation and tumorigenesis.


Figures

Figure 1
Figure 1. Rpt3-T25 is dynamically phosphorylated during cell cycle
(a) Validation of anti-pT25 phospho-specific antibody. 293T cells transfected with a vector control (−) or HA-Rpt3 (WT or T25V) were subjected to anti-HA immunoprecipitation (IP). Samples were then treated with or without λ-phosphatase and analyzed by western blot. (b) In vivo phosphorylation of Rpt3-T25. Whole brain from E12.5 mouse embryos was homogenized and subjected to immunoprecipitation (IP) with normal IgG or anti-Rpt3 antibody. T25 phosphorylation was determined by western blot. (c) Phospho-T25 was detected from the purified 26S proteasome. Lysates from 293T cells stably expressing Rpn11-HTBH (for proteasome purification) or the HTBH tag only (“−”, negative control) were subjected to streptavidin pulldown. T25 phosphorylation was determined by western blot. (d) Reversible phosphorylation of Rpt3-T25. 293T Rpn11-TBHA cells were either untreated (−) or pretreated with 25 nM Calyculin A for 10 min before harvest. The 26S proteasome was purified and pT25 was determined by western blot. (e) HaCaT cells were either untreated (“+” serum) or serum-starved (“−”) for 48 hours. Cell lysates were probed with the indicated antibodies. (f) Contact inhibition reduces Rpt3-T25 phosphorylation. WT MEFs expressing Rpn11-TBHA were grown to 100% confluence and contact-inhibited (C. I.) in the presence of serum for 48 hrs. Half of the cells were frozen immediately (in G1 phase) while the other half were allowed to resume growth at a lower density for 18 hrs. The proteasomes were purified from both samples at the same time and phospho-T25 was probed. (g) Cell cycle-regulated Rpt3-T25 phosphorylation. HaCaT Rpn11-TBHA cells enriched in M phase with nocodazole (Ndz) were collected by mitotic shake-off and released. At the indicated time points. proteasomes from each sample were affinity-purified by streptavidin pulldown, and phospho-T25 and proteasome subunits were probed. Cell cycle proteins from whole cell lysate (WCL) were also probed to show progression along cell cycle.
Figure 2
Figure 2. Blockade of Rpt3-T25 phosphorylation impedes cell proliferation
(a) Guide RNA design and sequencing verification of Rpt3-T25A knock-in using CRISPR/Cas9. The codon of Thr25 (ACC) is underlined in the WT allele. The single point mutation (A→G) is marked by an arrowhead in the sequencing result, and the resulting Ala25 is highlighted in red. (b) T25A knock-in abolishes T25 phosphorylation. Parental (P) and T25A knock-in clones of MDA-MB-468 cells and HaCaT cells were engineered to stably express Rpn11-TBHA (not shown). After affinity purification, proteasome-associated T25 phosphorylation was probed. (c) Growth curves of the indicated parental and T25A knock-in cells. Results are mean ± s.e.m. from n=3 independent experiments. **p<0.01, *p<0.05, Student's T-test (paired two-tailed test). (d) Stabilization of p27Kip1 and p21Cip1 by T25A knock-in. HaCaT cells were enriched at early S phase with 0.4 mM hydroxyurea (HU) treatment then released into regular medium containing cycloheximide for the indicated lengths of time. Protein levels of p27Kip1 and p21Cip1 were determined from total cell extracts (left). No significant difference in their mRNA levels was seen between the parental and T25A cells at the end of HU treatment. Results are mean ± s.e.m. from n=3 independent experiments (right). (e) Cell cycle analysis of HaCaT cells. After synchronization at G1/S boundary, cells were released and harvested at the indicated time points, stained with propidium iodide and analyzed by FACS. The percentage of cells in G1, S and G2/M phases are shown at the bottom. (f) HaCaT cells were synchronized and released as in (e). Cell lysates collected at each time point were analyzed by western blot. Source data for c and e can be found in Supplementary Table 3.
Figure 3
Figure 3. Loss of Rpt3-T25 phosphorylation downregulates 26S proteasome activity
(a) Proteasome activity in total cell lysates from the indicated MDA-MB-468 and HaCaT cells was measured with Suc-LLVY-AMC. **p<0.01, ***p<0.001 (compared to parental line, two-tailed paired Student's t-test, mean ± s.e.m from n=3 independent experiments). (b) Proteasome activity was measured as in (a) with Ac-GPLD-AMC (caspase-like activity) or Ac-RLR-AMC (trypsin-like activity) as substrate. *p<0.05, two-tailed paired Student's t-test, mean ± s.e.m from n=3 independent experiments. (c) 26S proteasomes were isolated by anti-HA IP from the indicated HA-Rpt3-expressing 293T cells. Proteasome components were shown by western blot (top) and proteasome activity from the immunoprecipitates was determined by Suc-LLVY-AMC cleavage (bottom). **p<0.01, *p<0.05 (compared to WT, two-tailed paired Student's t-test, mean ± s.e.m from n=3 independent experiments). (d) Accumulation of ubiquitinated proteins in T25A cells. Parental and T25A HaCaT cells were enriched at early S phase with 0.4 mM HU treatment, and whole cell extracts were probed for K48-linked ubiquitination. Rpn1 is shown as a loading control. (e) Total protein degradation rate in parental and T25A knock-in cells was determined by 3H-Phe pulse-chase assay. The protein degradation rates were calculated from n=3 independent experiments and presented as the percentage of that observed in each parental line. **p<0.01 (two-tailed paired Student's t-test, mean ± s.e.m from n=3 independent experiments). Source data for a, b and c can be found in Supplementary Table 3.
Figure 4
Figure 4. DYRK2 is the primary Rpt3-T25 kinase
(a) Summary of the Rpt3-T25 kinase screen. Each vertical bar represents an individual kinase cDNA/open reading frame (ORF). The activity of each kinase towards endogenous Rpt3-T25 in 293T cells is marked as strong (red), moderate (orange), weak (yellow) or undetected (gray). *DYRK3 cDNA from the kinase library failed to express properly, although the kinase could strongly phosphorylate T25 when overexpressed (see Supplementary Fig. 4a). (b) 293T cells were transfected with WT DYRK2 or the catalytically inactive mutant, D275N. T25 phosphorylation of endogenous Rpt3 is blotted from whole cell lysates. (c) An alignment of vertebrate Rpt3 protein sequences surrounding Thr25 (asterisk). The sequences shown are NP_006494 (human), NP_001030255 (cow), NP_036004 (mouse), XP_008119139 (lizard), NP_001008010 (frog) and NP_956044 (fish). (d) DYRK2 knockdown decreases T25 phosphorylation. HA-Rpt3 (WT) was transfected into 293T cells stably expressing control or three independent DYRK2 shRNAs. Following anti-HA IP, T25 phosphorylation was determined by western blot. (e) Time-dependent phosphorylation of recombinant human Rpt3 (aa 1-148) by bacterially expressed DYRK2 (aa 74-479), indicated by 32P-phosphate incorporation (top), gel shift (middle) and anti-pT25 western blot (bottom). (f) In vitro kinase assay with DYRK2 and purified human 26S proteasome. Asterisk indicates the most strongly phosphorylated band, which matched with the anti-pT25 blot (bottom).
Figure 5
Figure 5. DYRK2 is a positive regulator of proteasome activity
(a) Proteasome activity in total cell lysates from 293T cells stably expressing control or DYRK2 shRNAs was measured using Suc-LLVY-AMC as substrate. ***p<0.001 (One-way ANOVA, mean ± s.e.m from n=3 independent experiments).. (b) DYRK2 promotes GFPu degradation. 293T cells were co-transfected with vector control, DYRK2-WT or DYRK2-D275N and GFPu. After 1-hour pre-treatment of DMSO or 1 μM Bortezomib (Btz), cycloheximide (CHX, 50 μg/ml) was added for 0, 2 or 4 hours. GFP fluorescence in cell lysates was determined at each time point, background-subtracted and normalized to the starting level at time 0. *p<0.05 (DYRK2-WT vs. Vector or DYRK2-DN, One-way ANOVA, mean ± s.e.m from n=3 independent experiments). Expression of the DYRK2-3xFlag-V5 constructs was determined by anti-Flag western blot. (c) DYRK2 promotes the degradation of additional proteasome reporters. 293T cells were co-transfected with the indicated constructs as in (b) and cell lysates were analyzed by western blot. (d) DYRK2 promotes GFPu degradation in a T25-dependent manner. 293T cells stably expressing HA-Rpt3-WT or T25V was transfected and treated with CHX as in (b). GFPu levels are shown as mean ± s.e.m from n=3 independent experiments (top). DYKR2 expression and T25 phosphorylation were confirmed by western blot (bottom). Note that no T25 phosphorylation was detected in 293T pLL3.7-HA-Rpt3-T25V cells even in the presence of overexpressed DYRK2-WT, indicating a complete switch from endogenous WT Rpt3 to HA-Rpt3-T25V. (e) DYRK2 activates wild-type proteasome in vitro via T25 phosphorylation. 26S proteasomes were purified from parental and T25A MDA-MB-468 cells in the absence of phosphatase inhibitors, followed by in vitro phosphorylation with DYRK2. After removal of DYRK2, proteasome activity was measured with Suc-LLVY-AMC (top, **p<0.01, two-tailed paired Student's T-test, mean ± s.e.m from n=3 independent experiments). Total Rpt3, T25 phosphorylation and 20S subunits from the pulldown are shown by western blot (bottom). (f) In vitro degradation of polyubiquitinated GFP-titinV15P-cyclin-PY fusion protein by proteasomes treated with DYRK2-WT or D275N (in triplicates). RFU, relative fluorescence units. Source data for a, b, d and e can be found in Supplementary Table 3.
Figure 6
Figure 6. Mechanisms by which DYRK2 regulates the proteasome
(a) DYRK2 does not affect 26S proteasome assembly. 293T Rpn11-TBHA cells labeled with “heavy (H)” or “light (L)” isotopes were transfected with inactive or WT DYRK2, respectively. Proteasomes were isolated from these cells and analyzed by quantitative mass spectrometry (top). DYRK2-WT strongly phosphorylated Rpt3-T25 (middle), without affecting the relative abundance of each subunit in the purified 26S proteasomes (bottom). (b) In vitro binding of K48-linked tetraubiquitin (K48-Ub4) to the proteasome. Control 293T cells and 293T Rpn11-TBHA cells were subjected to streptavidin pulldown. The purified proteasome was treated with DYRK2-WT or DN in vitro and then incubated with K48-Ub4. Proteasome-bound K48-Ub4 was probed with anti-ubiquitin antibody. Western blot of the ubiquitin receptor Rpn13/ADRM1 shows equal amounts of proteasome in the DYRK2-treated samples. (c) Affinity-purified 26S proteasomes (~ 1 μg) was treated with DYRK2-WT or D275N in vitro. ATPase activity was monitored at 37°C using the malachite green method in the absence or presence of a proteasome substrate, UBL-YFP-ODC (1 μg). **p<0.01, *p<0.05 (two-tailed paired Student's t-test, mean ± s.e.m from n=3 independent experiments). (d) 26S proteasomes from 293T cells overexpressing WT or DN DYRK2 were immobilized on streptavidin beads, washed extensively with reaction buffer containing 1 mM ATP or 1 mM ATPγS, and assayed for Suc-LLVY-AMC cleavage in the same buffers. Reaction was carried out for 10 min at 37°C. **p<0.01 (two-tailed paired Student's t-test, mean ± s.e.m from n=3 independent experiments). Source data for c and d can be found in Supplementary Table 3.
Figure 7
Figure 7. DYRK2 positively regulates cell growth
(a) Growth curves of MDA-MB-468 parental and DYRK2 KO cells. **p<0.01, ***p<0.001 (One-way ANOVA, mean ± s.e.m from n=3 independent experiments) (b) MDA-MB-468 parental and DYRK2 KO cells were synchronized by aphidicolin and released. Cell lysates collected at each time point were analyzed by western blot. (c) MTS assay of MDA-MB-468 parental and DYRK2 KO cells. Equal number of cells (2.0 × 10⁴/well) were plated in triplicates in a 96-well plate. MTS activity was measured before and after DMSO or low-dose Bortezomib treatment for 24 hours. Data are presented as the increase of MTS activity from Day 1 to Day 2. *p<0.05, ***p<0.001 (two-tailed non-paired Student's T-test, mean ± s.e.m from n=3 independent experiments). n.s., non-significant. (d) DYRK2 downregulates p27Kip1 and p21Cip1. Cells were transiently transfected with DYRK2 (WT or D275N). Whole cell lysates were probed with the indicated antibodies. (e) Kaplan-Meier curves of overall survival (left) and relapse-free survival (right) of breast cancer patients with differential levels of DYRK2 mRNA. Source data for b and c can be found in Supplementary Table 3
Figure 8
Figure 8. Rpt3-T25 phosphorylation is required for tumor growth in vivo
(a) Tumor xenograft studies with parental and genome-edited MDA-MB-468 cells injected subcutaneously into nude mice. Tumor volumes at each time point after injection are shown (mean ± s.e.m). *p<0.05 (n = 5 mice, One-way ANOVA). (b) Xenograft tumors from (a) were resected at 6 weeks post-injection and imaged. Tumor weights are shown on the right as mean ± SEM. **p<0.01, ***p<0.001 (n =5 mice, compared to parental line, two-tailed non-paired Student's T-test). (c) Histological examination of consecutive sections of the tumors with Ki-67 and hematoxylin/eosin staining. Scale bar = 100 μm. (d) A model of reversible phospho-regulation of the 26S proteasome (adapted from ref.53). The approximate position of Rpt3-T25 in the 26S proteasome complex is highlighted. Cell cycle-dependent Rpt3-T25 phosphorylation regulated by DYRK2 facilitates the degradation of key proteins such as p21 and p27, which in turn promotes cell cycle transition. Pharmacological intervention of this process by targeting proteasome kinases can have therapeutic potentials.

Comment in

Similar articles

Cited by

References

    1. Coux O, Tanaka K, Goldberg AL. Structure and Functions of the 20S and 26S Proteasomes. Annual Review of Biochemistry. 1996;65:801–847. - PubMed
    1. Tai HC, Schuman EM. Ubiquitin, the proteasome and protein degradation in neuronal function and dysfunction. Nature reviews. Neuroscience. 2008;9:826–838. - PubMed
    1. López-Otín C, Blasco MA, Partridge L, Serrano M, Kroemer G. The Hallmarks of Aging. Cell. 2013;153:1194–1217. - PMC - PubMed
    1. Hoeller D, Dikic I. Targeting the ubiquitin system in cancer therapy. Nature. 2009;458:438–444. - PubMed
    1. Orlowski RZ, Kuhn DJ. Proteasome inhibitors in cancer therapy: lessons from the first decade. Clin Cancer Res. 2008;14:1649–1657. - PubMed

Publication types

MeSH terms

Substances