. 2016 Mar;115(3):1170-82.
doi: 10.1152/jn.00926.2015. Epub 2015 Dec 9.

Hyperpolarization-independent maturation and refinement of GABA/glycinergic connections in the auditory brain stem

Affiliations

Hyperpolarization-independent maturation and refinement of GABA/glycinergic connections in the auditory brain stem

Hanmi Lee et al. J Neurophysiol. 2016 Mar.

Abstract

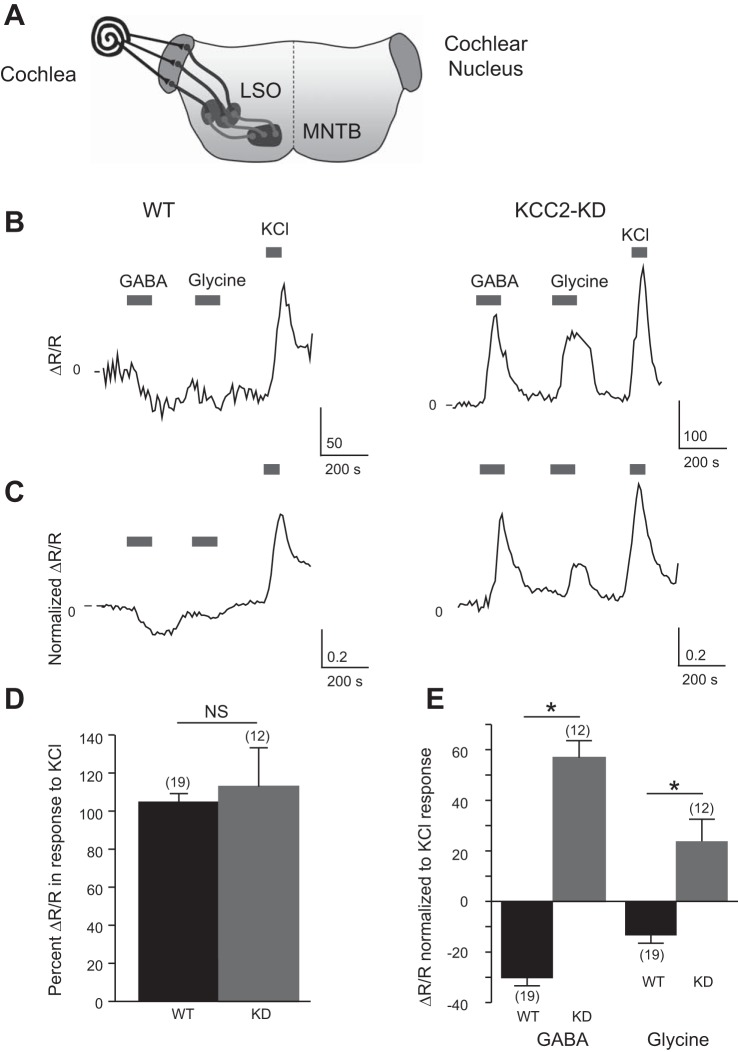
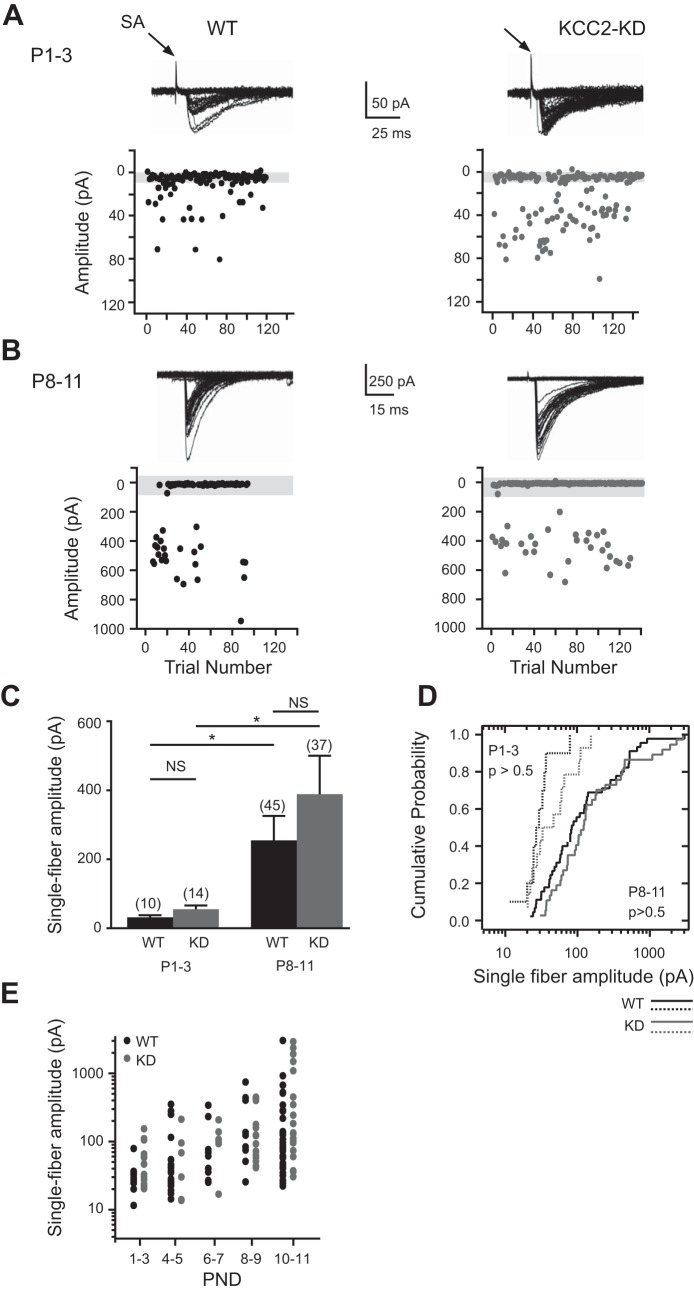
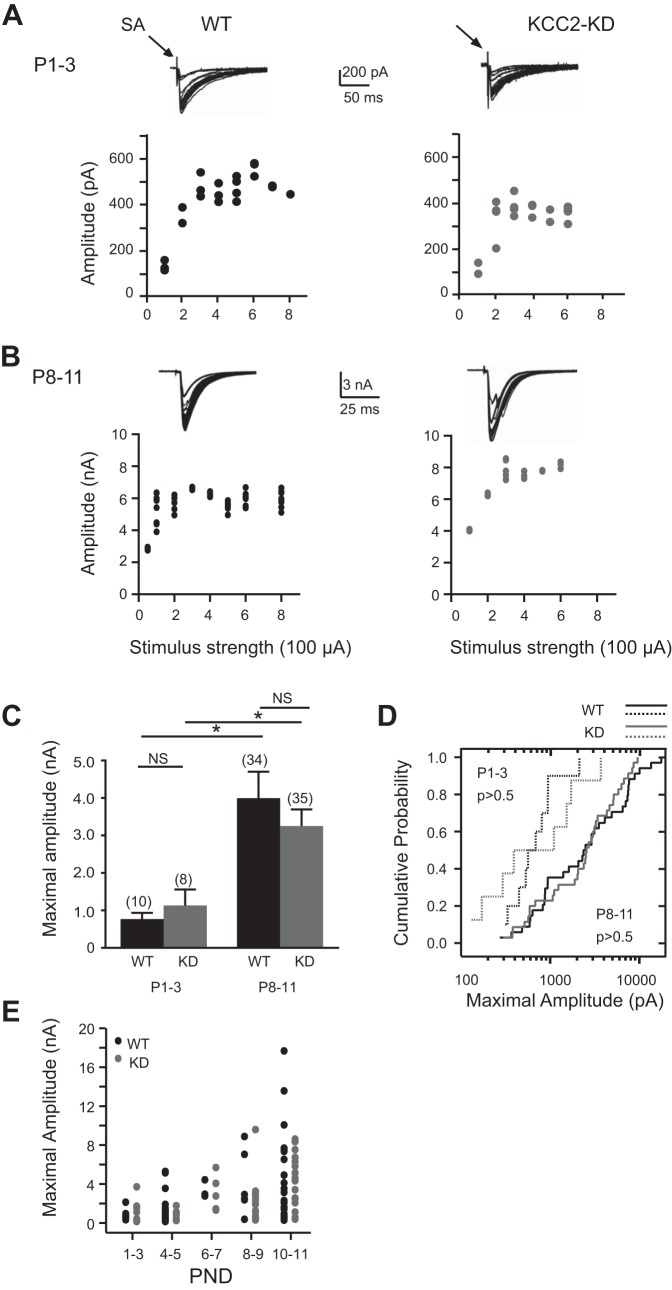
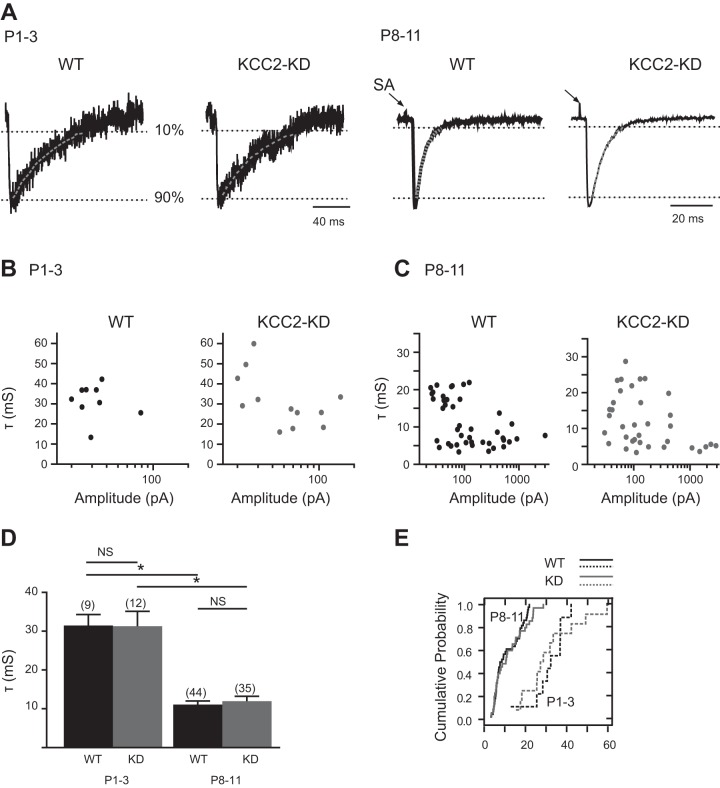
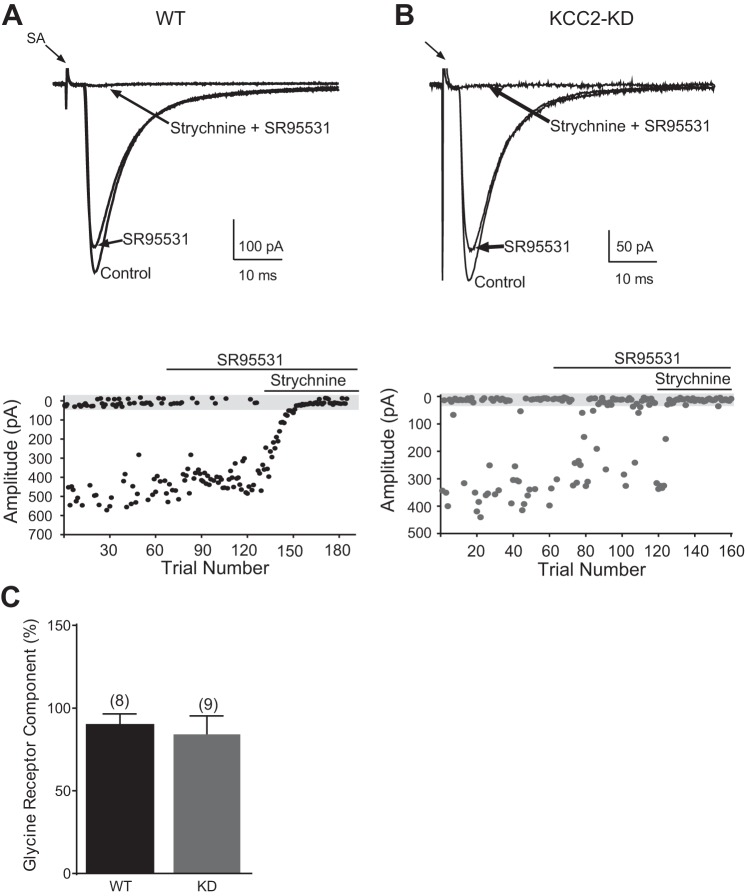
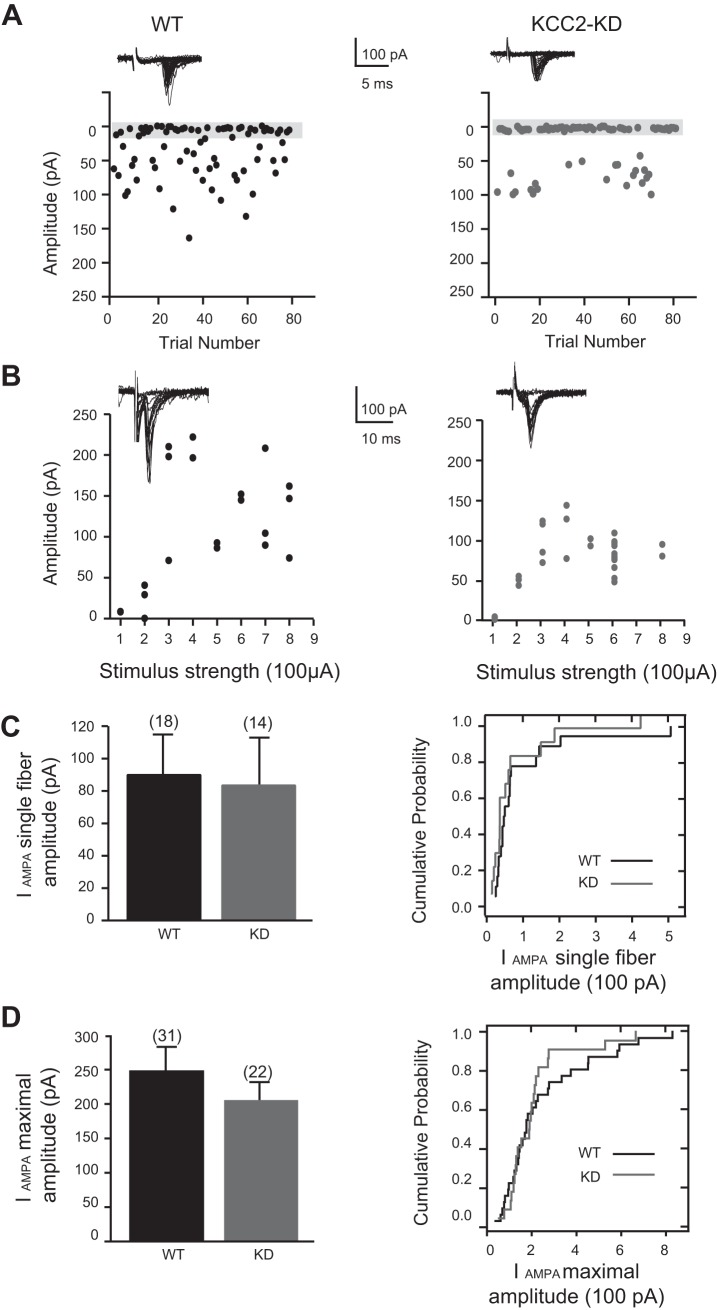
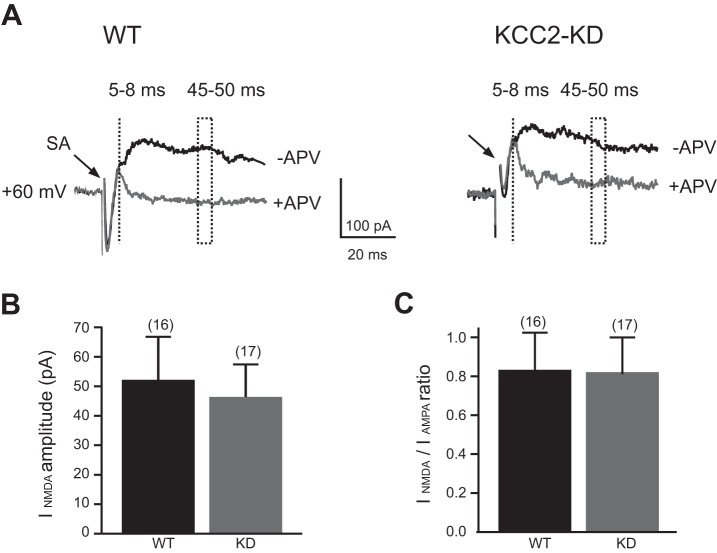
During development GABA and glycine synapses are initially excitatory before they gradually become inhibitory. This transition is due to a developmental increase in the activity of neuronal potassium-chloride cotransporter 2 (KCC2), which shifts the chloride equilibrium potential (ECl) to values more negative than the resting membrane potential. While the role of early GABA and glycine depolarizations in neuronal development has become increasingly clear, the role of the transition to hyperpolarization in synapse maturation and circuit refinement has remained an open question. Here we investigated this question by examining the maturation and developmental refinement of GABA/glycinergic and glutamatergic synapses in the lateral superior olive (LSO), a binaural auditory brain stem nucleus, in KCC2-knockdown mice, in which GABA and glycine remain depolarizing. We found that many key events in the development of synaptic inputs to the LSO, such as changes in neurotransmitter phenotype, strengthening and elimination of GABA/glycinergic connection, and maturation of glutamatergic synapses, occur undisturbed in KCC2-knockdown mice compared with wild-type mice. These results indicate that maturation of inhibitory and excitatory synapses in the LSO is independent of the GABA and glycine depolarization-to-hyperpolarization transition.

Keywords: auditory brain stem development; inhibitory plasticity; potassium-chloride cotransporter.


Figures

Fig. 1.
Fig. 1.
GABA and glycine remain excitatory and increase intracellular calcium concentration ([Ca2+]i) in lateral superior olive (LSO) neurons of KCC2-knockdown (KCC2-KD) mice at P8-11. A: diagram of the auditory brain stem circuitry. LSO neurons receive excitatory glutamatergic synaptic inputs from the cochlear nucleus (CN) and inhibitory synaptic inputs from the medial nucleus of the trapezoid body (MNTB). B: representative traces of the 340 nm-to-380 nm fluorescence ratio (R) change (ΔR/R) of a LSO neuron in wild-type (WT; left) and KCC2-KD (right) mice in response to bath application of GABA (2 mM), glycine (2 mM), and KCl (60 mM). C: average ΔR/R trace of all recorded LSO neurons (normalized to KCl responses) from WT (n = 19, left) and KCC2-KD (n = 12, right) mice. D: % change of ΔR/R in response to KCl (normalized to average ΔR/R KCl response of WT mice) in WT and KCC2-KD mice (n = 19 for WT, n = 12 for KCC2-KD). E: peak ΔR/R in response to GABA and glycine normalized to each cell's KCl response in WT (n = 19) and KCC2-KD (n = 12) mice. *P < 0.05, Mann-Whitney U-test. NS, not significant.
Fig. 2.
Fig. 2.
Developmental increase of single-fiber MNTB-LSO responses elicited by minimal stimulation is similar in WT and KCC2-KD mice. A and B, top: representative traces showing MNTB-LSO single-fiber responses recorded at a holding potential of −70 mV in WT (left) and KCC2-KD (right) mice at P1-3 (A) and P8-11 (B). Bottom: single-fiber response amplitudes as a function of stimulation trial number. Stimulus artifacts (SA) are truncated. C: average single-fiber response amplitudes of WT and KCC2-KD mice at P1-3 (n = 10 for WT, n = 14 for KCC2-KD) and P8-11 (n = 45 for WT, n = 37 for KCC2-KD). *P < 0.05, Mann-Whitney U-test. D: cumulative probability histogram of single-fiber amplitudes from LSO neurons shown in C of WT and KCC2-KD mice at P1-3 (dashed line) and P8-11 (solid line). There was no significant difference between genotypes (P > 0.05, Kolmogorov-Smirnov test). E: developmental time course of single-fiber amplitudes in WT and KCC2-KD mice as a function of postnatal day (PND).
Fig. 3.
Fig. 3.
Developmental increase of maximal MNTB-LSO responses is similar in WT and KCC2-KD. A and B: representative example of the stimulus-response relationship of the maximal MNTB fiber input onto to a single LSO neurons in WT (left) and KCC2-KD (right) mice at P1-3 (A; n = 10 for WT, n = 8 for KCC2-KD) and P8-11 (B; n = 34 for WT, n = 35 for KCC2-KD). Stimulus artifacts are truncated. Maximal amplitude values were derived from the average of at least 10 responses at stimulus strengths with plateaued amplitudes. C: maximal input at P1-3 and P8-11 for WT and KCC2-KD mice. *P < 0.05 (Mann-Whitney U-test). D: cumulative probability histogram of maximal responses in WT and KCC2-KD mice at P1-3 (dashed line) and P8-11 (solid line). Kolmogorov-Smirnov tests indicate no differences between genotypes at the same age group. E: developmental time course of maximal fiber input in WT and KCC2-KD mice as a function of postnatal day.
Fig. 4.
Fig. 4.
Decay time constants (τ) of single-fiber MNTB-LSO inputs decrease to a similar degree in WT and KCC2-KD mice. A: representative example of decay time (τ) analysis from single-fiber MNTB-LSO inputs in P1-3 and P8-11 in WT (left) and KCC2-KD (right) mice. Dotted lines indicate 10% and 90% of peak amplitude. Stimulus artifacts are truncated. B: decay time constants of single-fiber responses as a function of their amplitudes in LSO neurons at P1-3 in WT (left) and KCC2-KD (right) mice. C: same as B but at P8-11. D: average τs of single-fiber responses at P1-3 (n = 9 for WT and n = 12 for KCC2-KD) and at P8-11 (n = 44 for WT and n = 35 for KCC2-KD). *P < 0.05 (Mann-Whitney U-test). E: cumulative probability histograms for τs of single-fiber LSO responses at P1-3 (dashed line) and P8-11 (solid line) in WT and KCC2-KD mice. Cumulative probability distributions were analyzed with a Kolmogorov-Smirnov test.
Fig. 5.
Fig. 5.
Developmental shift from GABA to glycine transmission in the MNTB-LSO pathway is undisturbed in KCC2-KD mice. A and B, top: example traces of single-fiber LSO neuron responses before and after application of the GABAA receptor antagonist SR95531 (10 μM) and the glycine receptor antagonist strychnine (1 μM) in WT (A) and KCC2-KD (B) mice at P8-11. Stimulus artifacts are truncated. Bottom: amplitudes of single-fiber responses for WT (A) and KCC2-KD (B) mice. Gray bar indicates amplitudes considered failures. C: average glycine receptor component in WT (n = 8) and KCC2-KD (n = 9) mice.
Fig. 6.
Fig. 6.
Similar AMPA receptor-mediated CN-LSO responses in WT and KCC2-KD mice. A: representative example of single-fiber CN-LSO currents elicited by minimal stimulations at a holding potential of −80 mV in the presence of bicuculline (10 μM) and strychnine (1 μM). Insets: example traces from a LSO neuron in WT (left) and KCC2-KD (right) mice plotted as a function of stimulus trial number. Gray bar indicates failures. B: representative examples of stimulus-response relationship of the CN synaptic inputs onto a single LSO neuron. Experimental conditions as in A. Maximal amplitude values were derived from the average of at least 10 responses at stimulus strengths with plateaued amplitudes. C: average CN(AMPA) single-fiber current (IAMPA) amplitudes (left) and cumulative probability histograms of single-fiber amplitudes (right) of neurons from WT (n = 18) and KCC2-KD (n = 14) mice. D: average CN(AMPA) maximal fiber current amplitudes (left) and cumulative probability histograms of maximal fiber current amplitudes (right) for neurons from WT (n = 31) and KCC2-KD (n = 22) mice. For C and D, there was no significant difference between genotypes (unpaired Student's t-test and Kolmogorov-Smirnov test).
Fig. 7.
Fig. 7.
NMDA receptor-mediated CN-LSO responses were not different between WT and KCC2-KD mice at P9-12. A: representative traces of CN-LSO responses recorded at holding potential of +60 mV in the presence of bicuculline (10 μM) and strychnine (1 μM) in control conditions (−APV) and in the presence of APV (50 μM; +APV). At 45–50 ms after stimulus, responses were purely mediated by NMDA receptors. Stimulus artifacts are truncated. B: average maximal CN(NMDA) current (INMDA) amplitudes from neurons of WT (n = 16) and KCC2-KD (n = 17) mice. C: average CN(NMDA/AMPA) ratios for WT and KCC2-KD mice. There was no significant difference between genotypes (unpaired Student's t-test).

Similar articles

Cited by

References

    1. Akerman CJ, Cline HT. Depolarizing GABAergic conductances regulate the balance of excitation to inhibition in the developing retinotectal circuit in vivo. J Neurosci 26: 5117–5130, 2006. - PMC - PubMed
    1. Alamilla J, Gillespie DC. Glutamatergic inputs and glutamate-releasing immature inhibitory inputs activate a shared postsynaptic receptor population in lateral superior olive. Neuroscience 196: 285–296, 2011. - PMC - PubMed
    1. Alamilla J, Gillespie DC. Maturation of calcium-dependent GABA, glycine, and glutamate release in the glycinergic MNTB-LSO pathway. PLoS One 8: e75688, 2013. - PMC - PubMed
    1. Awatramani GB, Turecek R, Trussell LO. Staggered development of GABAergic and glycinergic transmission in the MNTB. J Neurophysiol 93: 819–828, 2005. - PubMed
    1. Balakrishnan V, Becker M, Lohrke S, Nothwang HG, Guresir E, Friauf E. Expression and function of chloride transporters during development of inhibitory neurotransmission in the auditory brainstem. J Neurosci 23: 4134–4145, 2003. - PMC - PubMed

Publication types

LinkOut - more resources