Meta-Analysis
. 2015 Dec 9;18(6):723-35.
doi: 10.1016/j.chom.2015.11.002.

Meta- and Orthogonal Integration of Influenza "OMICs" Data Defines a Role for UBR4 in Virus Budding

Affiliations
Meta-Analysis

Meta- and Orthogonal Integration of Influenza "OMICs" Data Defines a Role for UBR4 in Virus Budding

Shashank Tripathi et al. Cell Host Microbe. .

Abstract

Several systems-level datasets designed to dissect host-pathogen interactions during influenza A infection have been reported. However, apparent discordance among these data has hampered their full utility toward advancing mechanistic and therapeutic knowledge. To collectively reconcile these datasets, we performed a meta-analysis of data from eight published RNAi screens and integrated these data with three protein interaction datasets, including one generated within the context of this study. Further integration of these data with global virus-host interaction analyses revealed a functionally validated biochemical landscape of the influenza-host interface, which can be queried through a simplified and customizable web portal (http://www.metascape.org/IAV). Follow-up studies revealed that the putative ubiquitin ligase UBR4 associates with the viral M2 protein and promotes apical transport of viral proteins. Taken together, the integrative analysis of influenza OMICs datasets illuminates a viral-host network of high-confidence human proteins that are essential for influenza A virus replication.


Figures

Figure 1
Figure 1. Meta-analysis of Systems-Level Influenza A Datasets
(A–D) Circos visualization (Krzywinski et al., 2009) of pro-viral (A, B, and C) or anti-viral (D) cellular factors supported by reported RNAi data. In addition to depicting the overlap of cellular genes confirmed by multiple studies (A), the visualization was extended to include host genes that were supported by raw data in primary screen sets (Z score of ≤ −2; B and C). Host factors that participate in common pathways or biochemical complex/networks are shown in (C): inter-screen inter-gene connectors display proteins from screens predicted to interact with each other based on protein-protein interaction databases (PPI) and genes sharing the same statistically enriched gene ontology (GO) functional groups. (D) Gene overlaps for antiviral (restriction) cellular proteins based on both reported confirmed genes and raw data (Z score ≤ −2). Each wedge of the Circos plots depicts data from one of eight screens (pro-viral, A) or six screens (anti-viral, D), respectively, denoted by the outermost colored line. The length of each circle segment corresponds to the number of confirmed or significant (Z-score ≤ −2) factors found in each screen. The innermost circle categorizes the cellular factors into the respective gene status: (1) gene was confirmed in the indicated screen and at least one additional screen (red); (2) gene reported confirmed in only the indicated screen (orange), (3) gene was not reported confirmed in any screen, but displays a high activity (Z score ≤ −2) in the raw datasets of the indicated screen (transparent white). The four blue circles display the calculated Z scores of each host factor (A, B, and C) or restriction factors (D) within four primary raw screen datasets, respectively (from outside to inside: Brass et al., 2009; Karlas et al., 2010; König et al., 2007; Ward et al., 2012). Intensity from white to blue indicates increasing significance of activity (lower Z score). Connecting lines denote the overlap of genes shared either by multiple screens (directly in A, B, and D or through networks/pathways in C). The color of the line indicates the category of the inter-screen gene links: (1) both genes are confirmed (purple), (2) one gene is confirmed and the other displays a high Z score of ≤ −2 (black), (3) both genes display high Z scores of ≤ −2 in their source screens (green). See also Figure S1 and Tables S1 and S2.
Figure 2
Figure 2. Validation of Host Protein Activities Called in Multiple Screens
(A) Left: individual and composite Z scores derived from raw screening data of indicated screens. Middle: confirmation status of indicated genes across published screens. Right: 48 hr following siRNA-mediated gene knockdown A549 cells were infected with A/WSN/33 (MOI = 0.01) for 24 hr and supernatants were titered. Shown are virus titers (PFU) in percentage relative to siScr. (B) At 48 hr following siRNA-mediated gene knockdown, WI38-GFP1–10 cells were infected with A/WSN/33:PB2-GFP11 (MOI = 0.1), and GFP counts were measured every 4 hr over a 44-hr period. Shown is the mean AUC of two experiments (triplicates). (C) Raw data from published screens were analyzed for IAV restriction factors. Individual and composite Z scores from raw data of published screens are depicted (left). siRNAs targeting ISGs with significant composite Z scores were transfected into A549 cells. Cells (+/− INF) were challenged for 24 hr with A/Vietnam/1203/2004 HALo virus (MOI = 0.5). Mean fluorescence values from triplicate experiments are depicted as a fraction of replication in INF-treated versus INF-untreated cells. Also see Figure S2 and Table S3.
Figure 3
Figure 3. The Functionally Validated Landscape of IAV-Host Protein Interactions
An interaction network (Cytoscape) between host and influenza proteins was generated. Three IAV interactomes were integrated: (1) Yeast-two-hybrid data from Shapira et al. (2009), (2) APMS data confirmed by RNAi from Watanabe et al. (2014), (3) APMS data generated in this study with a MIST score cutoff of ≥0.7 or a top 5% ComPASS score (see Experimental Procedures). Viral proteins are depicted as yellow nodes. Displayed host nodes constitute proteins that were reported confirmed as host dependency or restriction factors in one (light red, light blue) or two or more RNAi screens (dark red, dark blue) and interact with no more than three IAV proteins. Blue nodes reflect host proteins additionally identified through the analysis of raw datasets (Z-RSA ≤ −2). Protein-protein interactions that were reported by a single proteomics dataset or by both Watanabe et al. (2014) and this publication are highlighted as blue or red edges, respectively. Selected complexes and overrepresented biological processes are displayed as colored clouds, and the enriched functions are denoted. Human-human based interactions are only depicted inside the colored clouds. The resulting network contained 398 virus-host edges, connecting 264 confirmed host cellular factors and 11 IAV proteins. See also Figures S3 and S4 and Tables S4, S5, S6, S7, and S8.
Figure 4
Figure 4. UBR4 Interacts with the M2 Ion Channel and Is Required for IAV Replication
(A) A549 cells were infected with A/WSN/33 (MOI = 2) for 24 hr and lysed in IP buffer. Lysates were subjected to immunoprecipitation using antibodies against M2 and UBR4. Immunoprecipitated protein samples and 5% input were subjected to SDS-PAGE/western blotting using indicated antibodies. (B) N-terminal GST-tagged deletion constructs of A/WSN/33 M2 (top) were transfected in HEK293T cells. At 48 hr later, cells were lysed and subjected to immunoprecipitation with anti-GST antibody. Immunoprecipitated samples and 10% input were subjected to SDS-PAGE/western blotting (bottom). (C) A549 cells were infected with A/WSN/33 (MOI = 2), and cells were fixed at indicated time points for immunostaining. Nuclei are depicted in blue, M2 in green, and UBR4 in red. Arrows allocate M2-UBR4 co-localization. Images of three representative independent experiments are shown. Scale bar represents 10 μm. (D) A549 cells were transfected with siNP, siUBR4, or siScr; 48 hr later, cell viability and UBR4 expression levels were determined. Alternatively, cells were infected with A/WSN/33 (MOI = 0.01) for 24 hr, and supernatants were titered. Shown is one of two independent duplicate experiments ± SD. (E) UBR4 stable knockdown or control A549 cells were infected with IAV luciferase (MOI = 0.2), Dengue Luciferase, or Herpes 1 luciferase reporter virus (MOI = 0.1); 48 hr later cells were lysed, and luciferase activity was measured. The mean luminescence values ± SD of three independent experiments relative to control were plotted. * and # indicate p values compared with control and Scr shRNA, respectively. See also Figures S4 and S5.
Figure 5
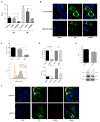
Figure 5. UBR4 Facilitates M2 Translocation to the Cell Membrane
(A) UBR4 stable knockdown or control A549 cells were infected with A/WSN/33 (MOI = 2). Supernatants were titered at 12- and 18-hr post-infection. (B) UBR4 stable knockdown or control A549 cells were infected with A/WSN/33 (MOI = 2) for 24 hr and subjected to immunostaining. Nuclei are depicted in blue and M2 in green. Arrows allocate M2 localization. Scale bar represents 10 μm. Shown are representative images of three independent experiments. (C) UBR4 stable knockdown, scrambled, and control A549 cells were infected with A/WSN/33 (MOI = 2) for 24 hr. Cells were harvested, and M2 expressed on the non-permeabilized cell surface was measured by flow cytometry. Top shows the percentage of cells positive for M2 surface expression relative to control. Lower shows corresponding histograms. (D) UBR4 WT or UBR4 KO HEK293T cells were infected with A/WSN/33 (MOI = 2) for 20 hr. Cells were harvested and M2 surface expression in non-permeabilized cells, and total M2 expression in permeabilized cells was measured by flow cytometry. Top shows the percentage of cells positive for M2 surface expression relative to control. Lower shows the corresponding M2 geometric mean intensity. (E) UBR4 WT or UBR4 KO HEK293T cells were infected with A/WSN/33 (MOI = 2). At 20-hr post-infection, supernatants were titered (top). Corresponding M2, UBR4, and β actin levels were determined by western blot. (F) UBR4 WT or UBR4 KO HEK293T cells were transfected with the autophagosome marker plasmid DIRAS3-N-RFP (red); 24 hr later, cells were infected with A/WSN/33 (MOI = 2). After 16 hr, cells were subjected to immunostaining. Nuclei are depicted in blue and M2 in green. M2-DIRAS3 co-localization is marked by arrows, and scale bar represents 10 μm. Images of three representative independent experiments are shown. Graphs represent mean ± SD of three independent experiments in (A) and (C); * and # indicate p values compared with control and Scr shRNA, respectively. In (D) and (E), # indicates p value compared to UBR4 WT samples. Immunofluorescence images are representative of three independent experiments, and scale bar represents 10 μm. See also Figure S5.
Figure 6
Figure 6. UBR4 Knockdown Mitigates IAV Replication and Pathogenesis In Vivo
Six-week-old female BALB/c mice (20 per group) were administered PBS or PPMOs (100 μg in 40 μl PBS, the equivalent of approximately 5 mg/kg) intranasally for 2 consecutive days. Five mice from each group were used to study PPMO toxicity without IAV infection (Figure S7C). On day 0, 15 mice per group were infected with A/Puerto Rico/8/34 (250 PFU) intranasally. Five mice per group were euthanized on days 3 and 6 post-infection. Lungs were harvested to determine virus titer, UBR4 expression, and histopathology. In five mice per group, survival was studied until day 14. (A) Upper shows experimental setup. (B) Graph shows mouse body weight ± SEM up to day 7 post-infection, for at least five mice per group. (C) Graph shows mice survival (five per group). (D) Graph shows mean lung virus titer ± SD on days 3 and 6 post-infection. * and # represent p value compared with PBS and Scr PPMO group, respectively. (E) Mouse lungs were isolated on day 0 (before infection), day 3, and day 6 post-infection, and H&E staining was performed on lung sections. Representative images are shown. Areas showing extensive inflammation are marked by arrows. Scale bars represent 300 μm. See also Figure S6.

Comment in

Similar articles

Cited by

References

    1. Beale R, Wise H, Stuart A, Ravenhill BJ, Digard P, Randow F. A LC3-interacting motif in the influenza A virus M2 protein is required to subvert autophagy and maintain virion stability. Cell Host Microbe. 2014;15:239–247. - PMC - PubMed
    1. Brass AL, Huang IC, Benita Y, John SP, Krishnan MN, Feeley EM, Ryan BJ, Weyer JL, van der Weyden L, Fikrig E, et al. The IFITM proteins mediate cellular resistance to influenza A H1N1 virus, West Nile virus, and dengue virus. Cell. 2009;139:1243–1254. - PMC - PubMed
    1. Dubois J, Terrier O, Rosa-Calatrava M. Influenza viruses and mRNA splicing: doing more with less. MBio. 2014;5:e00070–e14. - PMC - PubMed
    1. Dugre V, Levillain P, Lemonnier A. Hyperphosphatemia in case of abnormal proteinemia. Presse Med. 1990;19:338. - PubMed
    1. Edinger TO, Pohl MO, Stertz S. Entry of influenza A virus: host factors and antiviral targets. J Gen Virol. 2014;95:263–277. - PubMed

Publication types