. 2015 Dec 17;528(7582):422-6.
doi: 10.1038/nature16142. Epub 2015 Dec 9.

A mechanism for the suppression of homologous recombination in G1 cells

Affiliations

A mechanism for the suppression of homologous recombination in G1 cells

Alexandre Orthwein et al. Nature. .

Abstract

DNA repair by homologous recombination is highly suppressed in G1 cells to ensure that mitotic recombination occurs solely between sister chromatids. Although many homologous recombination factors are cell-cycle regulated, the identity of the events that are both necessary and sufficient to suppress recombination in G1 cells is unknown. Here we report that the cell cycle controls the interaction of BRCA1 with PALB2-BRCA2 to constrain BRCA2 function to the S/G2 phases in human cells. We found that the BRCA1-interaction site on PALB2 is targeted by an E3 ubiquitin ligase composed of KEAP1, a PALB2-interacting protein, in complex with cullin-3 (CUL3)-RBX1 (ref. 6). PALB2 ubiquitylation suppresses its interaction with BRCA1 and is counteracted by the deubiquitylase USP11, which is itself under cell cycle control. Restoration of the BRCA1-PALB2 interaction combined with the activation of DNA-end resection is sufficient to induce homologous recombination in G1, as measured by RAD51 recruitment, unscheduled DNA synthesis and a CRISPR-Cas9-based gene-targeting assay. We conclude that the mechanism prohibiting homologous recombination in G1 minimally consists of the suppression of DNA-end resection coupled with a multi-step block of the recruitment of BRCA2 to DNA damage sites that involves the inhibition of BRCA1-PALB2-BRCA2 complex assembly. We speculate that the ability to induce homologous recombination in G1 cells with defined factors could spur the development of gene-targeting applications in non-dividing cells.


Conflict of interest statement

The authors declare no competing financial interests.

Figures
Extended Data Figure 1
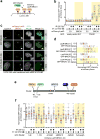
a, Schematic representation of human 53BP1 gene organization and targeting sites of sgRNAs used. Boxes indicate exons (E: yellow, coding sequence; brown, untranslated regions (UTRs)). The indels introduced by CRISPR/Cas9 and their respective frequencies are indicated. b, Wild-type (WT) and 53BP1Δ and U2OS cells were mock- or X-irradiated (10 Gy) before being processed for 53BP1 fluorescence microscopy. DAPI was used to stain DNA and trace the outline of the nucleus. c, Wild-type (WT) and 53BP1Δ U2OS cells were processed for 53BP1 immunoblotting. Tubulin was used as a loading control. d, Wild-type (WT) and 53BP1Δ U2OS cells either synchronized in G1 following a double-thymidine block and release or asynchronously dividing (ASN), were irradiated (2 Gy) and processed for γ-H2AX, PALB2, BRCA2 and BRCA1 immunofluorescence. The micrographs relating to BRCA1 and BRCA2 staining in G1 are found in Fig. 1a. e, Wild-type (WT) and 53BP1Δ U2OS cells synchronized in G1 after release from a double-thymidine block were irradiated (20 Gy) and processed for γ-H2AX, BRCA1 and BRCA2 immunofluorescence. On the left are representative micrographs for the G1-arrested cells and the quantitation of the full experiment is shown on the right (mean ± s.d., N=3).
Extended Data Figure 2
a, Schematic of the LacO/LacR chromatin-targeting system. b, U2OS 256 cells were transfected with the indicated mCherry-LacR and GFP-fusions. GFP fluorescence was measured at the site of the LacO array-localized mCherry focus. Each circle represents one cell analysed and the bar is at the median. Cells were also stained with a Cyclin A antibody to determine cell cycle position (N=3). c, Representative micrographs of U2OS 256 cells transfected with the indicated mCherry-LacR and GFP-fusions; data is quantified in d. d, Quantification of U2OS 256 cells transfected with the indicated mCherry-LacR and GFP-fusions to tether either BRCA1 or PALB2 to the LacO array (N=3). e, Schematic representation of PALB2 architecture and its major interacting proteins. f, Quantification of U2OS 256 cells transfected with the indicated GFP-PALB2 mutants and mCherry-LacR-BRCA1-CC. Cells were also stained with a Cyclin A antibody to determine cell cycle position (N=3).
Extended Data Figure 3
a, Representative micrographs of the experiment shown in Fig. 1d. b, Schematic representation of human KEAP1 gene organization and targeting sites of sgRNAs used as described in Extended Data Fig.1. a. The indels introduced by CRISPR/Cas9 and their respective frequencies are indicated. c, Immunoprecipitation (IP) of PALB2 from extracts prepared from irradiated 293T cells. IP with normal IgG was performed as a control. d, 293T cells with the indicated genotypes were transfected with the indicated HA-KEAP1 constructs, synchronized in G1 or S phases and irradiated. Cells were processed for PALB2 immunoprecipitation (IP). EV, empty vector. e, Quantification of U2OS 256 cells transfected with the indicated GFP-PALB2 mutants and mCherry-LacR-BRCA1. Cells were also stained with a Cyclin A antibody to determine cell cycle position (N=3). f, Quantification of U2OS 256 cells transfected with GFP-PALB2 and mCherry-LacR-BRCA1-CC (WT or K1406R mutant). Cells were also stained with a Cyclin A antibody to determine cell cycle position. This panel shows that the sole lysine in the PALB2-interaction motif of BRCA1 is not involved in the cell cycle regulation of the PALB2-BRCA1 interaction.
Extended Data Figure 4
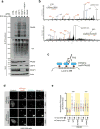
a, HEK293 Flp-In T-REX cells expressing doxycycline (DOX)-inducible His6-Ub were transfected with the indicated siRNAs. Cells were processed for Ni-NTA pull-down. b, 293T cells transfected with an siRNA targeting USP11 and a Flag-PALB2 expression vector were processed for Flag immunoprecipitation followed by mass spectrometry. Representative MS/MS spectra of tryptic diglycine (diG)-PALB2 peptides identified are shown (K16, top; K43, bottom). c, Schematic of the LacO/LacR chromatin-targeting system and the in vivo quantification of ubiquitylated PALB2. d, Representative micrographs of U2OS 256 cells transfected with the indicated mCherry-LacR-PALB2 vectors. Cells were processed for FK2 immunofluorescence. EV, empty vector. Scale bar = 5 μm. e, Quantification of U2OS 256 cells transfected with the indicated mCherry-LacR-PALB2 vectors. Cells were processed for quantification of FK2 fluorescence at the LacO focus. Each circle represents a cell analyzed from 3 independent experiments and the bar is at the median. Cells were also stained with a Cyclin A antibody to determine cell cycle position. Statistical significance was determined by a Kruskall-Wallis test (***, P<0.001; **, P<0.01).
Extended Data Figure 5
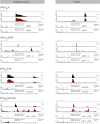
HA-PALB2 (1-103) was subjected to in vitro ubiquitylation reactions that lacked (left panels) or included (right panels) CUL3. Upon trypsin digestion of complete reaction products, 10 heavy labeled AQUA peptides representing N-terminal PALB2 peptides (see Methods section for more information) were spiked into the peptide mixture before LC-MS/MS analysis. Representative fragmentation spectra of AQUA peptides and unlabeled peptides from the reaction products are shown. For each peptide, the traces from top to bottom show: mass range chromatograms (0.1 m/z range surrounding the m/z of the doubly charged peptide) of the heavy- and unlabeled peptide, respectively; representative MS/MS fragmentation spectra including assigned peaks of the heavy- and light-labeled peptide, respectively. The CN heavy-labeled amino acid is indicated by an asterisk (*) and the theoretical and observed m/z of the doubly charged peptide are indicated in the relevant spectra.
Extended Data Figure 6
a, Site-specific chemical ubiquitylation of HA-PALB2 (1-103) at residue 20 (PALB2-KC20-Ub) and 45 (PALB2-KC45-Ub) was carried out by dichloroacetone linking. The resulting ubiquitylated PALB2 polypeptides along with their unmodified counterparts were subjected to pulldown with a fusion of MBP with the coiled-coil domain of BRCA1 (MBP-BRCA1-CC). I, input; PD, pulldown. Asterisk (*) indicates a non-specific band. b, Wild-type and KEAP1Δ 293T cells were treated with cycloheximide (CHX) for the indicated time and then processed for NRF2 and KEAP1 immunoblotting. Actin levels were also determined as a loading control. c, Immunoprecipitation (IP) of USP11 from extracts prepared from 293T cells that were or were not treated with camptothecin (CPT; 200 nM). IP with normal IgG was performed as a control. d, U2OS DR-GFP cells were transfected with the indicated siRNAs. 24 h post-transfection, cells were further transfected with the indicated siRNA-resistant USP11 expression vectors (WT=wild type; CS= C318S and CA= C318A catalytically-dead mutants) or an empty vector (EV), with or without an I-SceI expression vector. The percentage of GFP-positive cells was determined 48 h post-plasmid transfection for each condition and was normalized to the I-SceI + non-targeting (siCTRL) condition (mean ± s.d., N=3). e, Schematic representation of human USP11 (top) and KEAP1 (bottom) gene organization and targeting sites of sgRNAs (as described in Extended Data Figure 1a) used to generate the USP11Δ and USP11Δ/KEAP1Δ 293T cells. The indels introduced by the CRISPR/Cas9 and their respective frequencies are indicated. The USP11 knockout was created first and subsequently used to make the USP11Δ/KEAP1Δ double mutant. f, Immunoprecipitation (IP) of PALB2 from extracts prepared from 293T cells transfected with the indicated siRNA and with or without CPT (200 nM) treatment. IP with normal IgG was performed as a control.
Extended Data Figure 7
a, U2OS DR-GFP cells were transfected with the indicated siRNAs or left untransfected (−). 24 h post-transfection, cells were transfected with an I-SceI expression vector (circle). The percentage of GFP-positive cells was determined 48 h post-plasmid transfection for each condition and was normalized to the I-SceI + non-targeting (CTRL) condition (mean ± s.d., N=3). b, Parental 293T cells (WT) or a USP11Δ derivative were transfected with the indicated GFP-PALB2 constructs, treated with CPT and processed for GFP immunoprecipitation (IP). c, Parental 293T cells (WT) or a USP11Δ derivative were transfected with an empty vector (EV) or the indicated PALB2 expression vectors. Sensitivity of the cells to the PARP inhibitor olaparib was then determined by a clonogenic survival assay (mean ± s.d., N=3).
Extended Data Figure 8
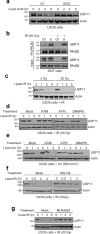
a, U2OS cells synchronized in G1 or S/G2 were treated with cyclohexamide (CHX) and processed at the indicated time points to monitor USP11 stability. b, Immunoprecipitation (IP) of PALB2 from extracts prepared from 293T cells that were synchronized in G1 or S phase and treated or not with IR (20 Gy). c, U2OS cells were irradiated with a dose of 2 or 20 Gy and processed for USP11 immunoblotting at the indicated times post-IR. Actin was used as a loading control. d, U2OS cells, mock-treated or incubated with the ATM (KU55933; ATMi), ATR (VE-821; ATRi) or DNA-PKcs (NU7441; DNAPKi) inhibitors, were irradiated (20 Gy) and processed for USP11 and actin (loading control) immunoblotting. e, Similar experiment to d except that cells were UV-irradiated with a 50 mJ/cm2 dose. f, U2OS cells, mock-treated or incubated with the proteasome inhibitor MG132, were irradiated (20 Gy) and processed for USP11 and actin (loading control) immunoblotting. g, U2OS cells, mock-treated or incubated with the cullin inhibitor MLN4924, were irradiated (20 Gy) and processed for USP11 and actin (loading control) immunoblotting.
Extended Data Figure 9
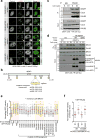
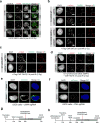
53BP1Δ U2OS cells were transfected with the indicated siRNA, synchronized in G1 or S/G2 by release from a double-thymidine block and irradiated (20 Gy) before being processed for fluorescence microscopy. DAPI was used to trace the nuclear boundary and Cyclin A staining was used to determine cell cycle position. The percentage of cells with more than 5 γ-H2AX-colocalizing PALB2 foci is indicated as the mean ± s.d., N=3. Scale bar = 5 μm. b, Representative micrographs of irradiated G1-synchronized wild-type (WT) and 53BP1Δ U2OS cells transfected with the indicated siRNA and expressing wild-type (WT) CtIP. c, Representative micrographs of irradiated G1-synchronized WT U2OS cells transfected with the indicated siRNA and expressing CtIP-T847E. d, U2OS 53BP1Δ cells were synchronized in G1, supplemented with BrdU, irradiated (2 Gy) and processed for γ-H2AX and BrdU immunofluorescence. The percentage of cells with more than 5 γ-H2AX-colocalizing BrdU foci is indicated (mean ± s.d., N=3). e, Micrograph of a U2OS cell targeted with the CRISPR/mClover system showing the typical perinuclear expression pattern of Lamin A. f, Micrograph of a U2OS cell targeted with the mClover system showing an expression pattern characteristic of subnuclear PML foci. g, Timeline of the gene targeting (LMNA) experiment presented in Fig 4d. h, Timeline of the gene targeting (LMNA or PML) experiment presented in Fig 4e and Extended Data Figure 10.
Extended Data Figure 10
a, Quantitation of gene targeting efficiency at the LMNA locus in asynchronously dividing U2OS cells transfected with increasing amount of donor template and with (black) or without (grey) gRNAs. Gene targeting events were detected by flow cytometry (mean ± s.d., N≥3). b, Quantitation of gene targeting efficiency at the LMNA locus in asynchronously dividing cells transfected with the indicated siRNA. Gene targeting events were detected by flow cytometry (mean ± s.d., N=3). c, Gene targeting efficiency at the PML locus measured by flow cytometry in G1-arrested 53BP1Δ U2OS cells expressing the CtIP-T847E mutant and co-transfected with the indicated siRNA or a PALB2-KR expression construct (mean ± s.d., N=3). d, Representative FACS profiles showing the gating for 1N DNA content cells and the detection of mClover-positive cells in the LMNA gene targeting assay in asynchronous (ASN) or G1-arrested 53BP1Δ U2OS cells expressing the CtIP-T847E mutant and co-transfected with the indicated siRNA or a PALB2-KR expression construct. e, Gene targeting efficiency at the LMNA locus measured by flow cytometry in G1-arrested parental (WT) and 53BP1Δ U2OS cells transfected with KEAP1 siRNA and expressing the CtIP-T847E mutant (mean ± s.d., N=3). f, Gene targeting efficiency at the LMNA locus measured by flow cytometry in G1-arrested parental (WT) and 53BP1Δ U2OS cells transfected with the indicated siRNA and expressing either wild-type (WT) or the CtIP-T847E mutant (mean ± s.d., N=3).
Figure 1
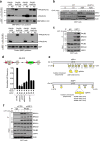
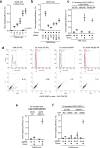
Figure 1. Inhibition of the BRCA1-PALB2 interaction in G1 is CRL3-KEAP1-dependent
a, Micrographs of irradiated (2 Gy) G1-synchronized U2OS cells processed for γ-H2AX, BRCA1 and BRCA2 immunofluorescence. b, Quantitation of the experiment shown in a and Extended Data Fig. 1d. ASN, asynchronously dividing. WT, wild type (mean ± s.d., N=3). c, Immunoprecipitation (IP) of PALB2 from extracts prepared from mock- or X-irradiated 293T cells synchronized in S or G1 phases. A normal IgG IP was performed as control. Cyclin A staining ascertains cell cycle synchronization. For gel source data, see Supplementary Figure 1. d, Quantitation of the experiment shown in Extended Data Fig. 3a. 53BP1Δ U2OS cells transfected with the indicated GFP-PALB2 vectors and siRNAs were irradiated (20 Gy) before being processed for microscopy (mean ± s.d., N=3). e, Normal IgG and PALB2 IPs from extracts prepared from synchronized and irradiated 293T cells of the indicated genotypes.
Figure 2
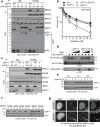
Figure 2. Ubiquitylation of PALB2 prevents BRCA1-PALB2 interaction
a, Sequence of the PALB2 N-terminus and mutants. b, GFP IP of extracts derived from G1- or S-phase synchronized 293T cells expressing the indicated GFP-PALB2 proteins. c, In vitro ubiquitylation of the indicated HA-tagged PALB2 proteins by CRL3-KEAP1. d, Pulldown assay of ubiquitylated HA-PALB2 (1-103) incubated with MBP or MBP-BRCA1-CC. I: input, PD: pulldown, FT: flow-through. The asterisk denotes a fragment of HA-PALB2 competent for BRCA1 binding.
Figure 3
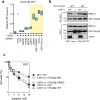
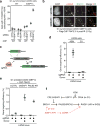
Figure 3. USP11 opposes the activity of CRL3-KEAP1
a, Normal IgG or PALB2 immunoprecipitation (IP) of extracts derived from CPT-treated 293T cells of the indicated genotypes transfected with GFP-USP11 constructs. EV, empty vector; WT, wild type; CS, C318S. b, Clonogenic survival assays of 293T cells of the indicated genotypes treated with olaparib (mean ± s.d., N≥3). c, Normal IgG or PALB2 IP of extracts derived from CPT-treated 293T cells of the indicated genotypes. d, Immunoblots of deubiquitylation reactions containing ubiquitylated HA-tagged PALB2 (1-103) and increasing concentrations of GST-USP11 or its C318S (CS) mutant. USP2 was used as a control. e, Cell cycle-synchronized U2OS cells were irradiated (20 Gy dose) and processed for immunoblotting. f, Immunoblots of extracts from irradiated U2OS cells transfected with the indicated siRNAs. g, Fluorescence micrographs of G1-synchronized and irradiated (20 Gy) 53BP1Δ U2OS cells transfected with the indicated siRNAs. The percentage of cells with more than 5 γ-H2AX-colocalizing BRCA2 foci is indicated (mean ± s.d., N=3).
Figure 4
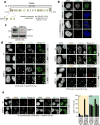
Figure 4. Reactivation of HR in G1
a, Quantitation of wild type (WT) and 53BP1Δ U2OS cells co-transfected with non-targeting (CTRL) or KEAP1 siRNAs and vectors expressing WT CtIP or the T847E (TE) mutant that were synchronized in G1, irradiated (2 Gy) and processed for γ-H2AX and RAD51 immunofluorescence (mean ± s.d., N=3). b, Representative micrographs from a. c, Schematic of the gene targeting assay. d, Gene targeting efficiency at the LMNA locus in asynchronously dividing (ASN) and G1-arrested U2OS cells (mean ± s.d., N=3). e, Gene targeting at the LMNA locus in G1-arrested cells transfected with the indicated siRNA or a PALB2-KR expression vector (mean ± s.d., N=3). f, Model of the cell-cycle regulation of HR.

Comment in

Similar articles

Cited by

References

    1. Jasin M, Rothstein R. Repair of strand breaks by homologous recombination. Cold Spring Harbor Perspect Biol. 2013;5:a012740. - PMC - PubMed
    1. Hartlerode A, Odate S, Shim I, Brown J, Scully R. Cell cycle-dependent induction of homologous recombination by a tightly regulated I-SceI fusion protein. PLoS One. 2011;6:e16501. - PMC - PubMed
    1. Rothkamm K, Kruger I, Thompson LH, Lobrich M. Pathways of DNA double-strand break repair during the mammalian cell cycle. Mol Cell Biol. 2003;23:5706–5715. - PMC - PubMed
    1. Panier S, Durocher D. Push back to respond better: regulatory inhibition of the DNA double-strand break response. Nat Rev Mol Cell Biol. 2013;14:661–672. - PubMed
    1. Ma J, et al. PALB2 interacts with KEAP1 to promote NRF2 nuclear accumulation and function. Mol Cell Biol. 2012;32:1506–1517. - PMC - PubMed

Publication types

MeSH terms

Substances